ETF/No Load Fund Tracker Newsletter For Friday, November 22, 2013
ETF/No Load Fund Tracker StatSheet
————————————————————-
THE LINK TO OUR CURRENT ETF/MUTUAL FUND STATSHEET IS:
https://theetfbully.com/2013/11/weekly-statsheet-for-the-etfno-load-fund-tracker-newsletter-updated-through-11212013/
————————————————————
Market Commentary
Friday, November 22, 2013
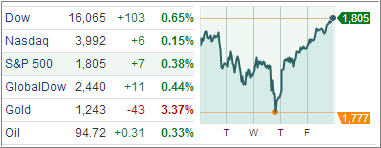
S&P 500 GAINS SEVEN OUT OF SEVEN

[Chart courtesy of MarketWatch.com]
1. Moving The Markets
Seven was a lucky number at least for the S&P 500 index, which managed to rack up gains seven weeks in a row. As the weekly chart above shows, the mid-week dip proved to be another buying opportunity with the index now closing above the 1,800 milestone for the first time, while the Dow frolicked again above the 16,000 level.
Providing ammunition for the continued upward move were increased pace of hiring as well as favorable decisions by European regulators regarding drug makers, which pushed up healthcare stocks with one of our spotlight ETFs (XLV) gaining 1.34% for the day.
News on potential tapering was noticeably absent today, which appears to be the one fly in the ointment that can derail this market at anytime. However, right now the direction continues to be the path of least resistance, which is higher.
Our ETFs in the spotlight confirm this trend, so let’s take a look:
2. ETFs in the Spotlight
In case you missed the announcement and description of this section, you can read it here again.
It features 10 broadly diversified ETFs from my HighVolume list as posted every Monday. Furthermore, they are screened for the lowest MaxDD% number meaning they have been showing better resistance to temporary sell offs than all others over the past year.
In other words, all of them never triggered their 7.5% sell stop level during this time period, which included a variety of severe market pullbacks but no move into outright bear market territory.
Here are the 10 candidates:
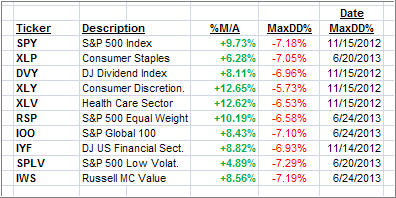
All of them are in “buy” mode meaning their prices are above their respective long term trend lines by the percentage indicated (%M/A).
Now let’s look at the MaxDD% column and review the ETF with the lowest drawdown as an example. As you can see, that would be XLY with the lowest MaxDD% number of -5.73%, which occurred on 11/15/2012.
The recent sell off in the month of June did not affect XLY at all as its “worst” MaxDD% of -5.73% still stands since the November 2012 sell off.
A quick glance at the last column showing the date of occurrences confirms that five of these ETFs had their worst drawdown in November 2012, while the other five were affected by the June 2013 swoon, however, none of them dipped below their -7.5% sell stop.
Year to date, here’s how the above candidates have fared so far:
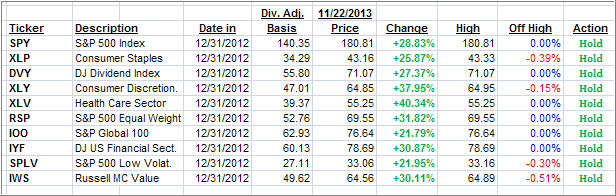
With the positive tone in the market having returned, most ETFs have made new highs represented by the 0.00% value in the “Off High” column.
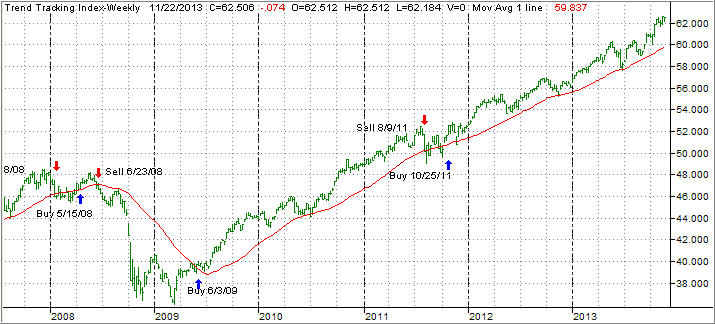
3. Domestic Trend Tracking Indexes (TTIs)
Trend wise, our Trend Tracking Indexes (TTIs) rallied with the markets and remain above their long term trend lines by the following percentages:
Domestic TTI: +4.77% (last week +4.79%)
International TTI: +7.42% (last week +7.59%)
Have a great week.
Ulli…
Disclosure: I am obliged to inform you that I, as well as advisory clients of mine, own some of these listed ETFs. Furthermore, they do not represent a specific investment recommendation for you, they merely show which ETFs from the universe I track are falling within the guidelines specified.
————————————————————-
READER Q & A FOR THE WEEK
All Reader Q & A’s are listed at our web site!
Check it out at:
http://www.successful-investment.com/q&a.php
A note from reader Franz:
Q: Ulli: Why is the 39 week SMA used in Trend Tracking? If I missed that discussion please excuse. Thank you.
A: Franz: When I developed the Trend Tracking Indexes back in the 1980s, I experimented with various SMAs but decided that the 39 week SMA was most appropriate. Subsequently, I never found a valid reason to change that.
———————————————————-
WOULD YOU LIKE TO HAVE YOUR INVESTMENTS PROFESSIONALLY MANAGED?
Do you have the time to follow our investment plans yourself? If you are a busy professional who would like to have his portfolio managed using our methodology, please contact me directly or get more details at:
https://theetfbully.com/personal-investment-management/
———————————————————
Back issues of the ETF/No Load Fund Tracker are available on the web at:
https://theetfbully.com/newsletter-archives/