02-07-2014

Ulli Newsletter Archives Contact

ETF/No Load Fund Tracker Newsletter For Friday, February 7, 2014

ETF/No Load Fund Tracker StatSheet

————————————————————-

THE LINK TO OUR CURRENT ETF/MUTUAL FUND STATSHEET IS:

https://theetfbully.com/2014/02/weekly-statsheet-for-the-etfno-load-fund-tracker-newsletter-updated-through-02062014/

————————————————————

Market Commentary

Friday, February 7, 2014

EQUITIES END WEEK ON A POSITIVE NOTE
Fri pic

[Chart courtesy of MarketWatch.com]

1. Moving The Markets

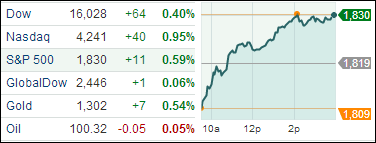
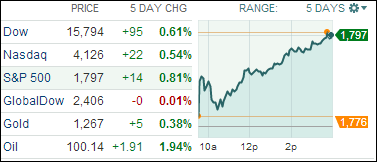
The U.S. stock market finished the week on a positive note. The Nasdaq gained over 1.4%, while the S&P 500 and Dow each gained over 1%. The market dug itself a hole at the start of the week, plunging more than 2 percent on Monday. The slide began with investor anxiety over an industry survey that found that manufacturing grew much more slowly in January than in December. Lackluster U.S. auto sales for January added to the bad news.

Investor sentiment began to brighten by Wednesday with a survey of private businesses that showed companies added 175,000 jobs in January, which was in line with average monthly gains the past two years. On Thursday, news that fewer people applied for unemployment benefits last week helped lift the market. On Friday, the market’s gains were broad. All 10 sectors in the S&P 500 index moved higher, led by industrial and health care stocks.

Some stocks missed the rally. LinkedIn fell $13.86 or 6.2 percent, to $209.59 after the company said its performance may falter this year as it spends more on long-term projects and revenue growth slows.

Investors will have no shortage of potentially market-moving news to watch out for in the coming weeks. The bulk of the latest quarterly earnings cycle is over, but the markets will be watching how Washington grapples with another debt ceiling deadline, and how quickly the Federal Reserve moves to reduce its monthly bond purchases.

Our 10 ETFs in the Spotlight recovered and backed away from their trailing sell stops; 9 of them are remaining on the bullish side of their respective trend lines as the tables below show.

2. ETFs in the Spotlight

In case you missed the announcement and description of this section, you can read it here again.

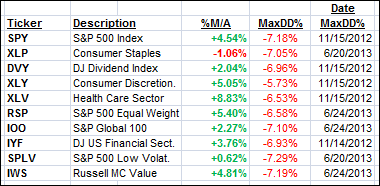
It features 10 broadly diversified ETFs from my HighVolume list as posted every Monday. Furthermore, they are screened for the lowest MaxDD% number meaning they have been showing better resistance to temporary sell offs than all others over the past year.

In other words, none of them ever triggered their 7.5% sell stop level during this time period, which included a variety of severe market pullbacks but no move into outright bear market territory.

Here are the 10 candidates:
MaxDD

All of them, except XLP, are in “buy” mode meaning their prices are above their respective long term trend lines by the percentage indicated (%M/A).

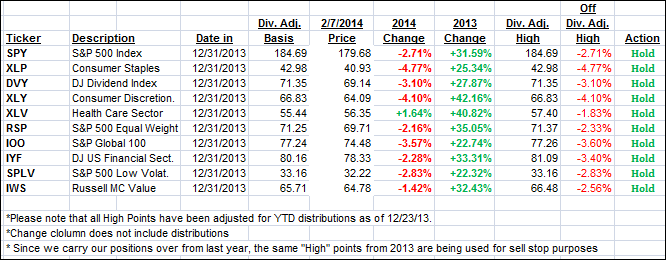
Year to date, here’s how the above candidates have fared so far:
YTD

To be clear, the first table above shows the position of the various ETFs in relation to their respective long term trend lines (%M/A), while the second one tracks their trailing sell stops in the “Off High” column.

Personally, I liquidated our holdings in XLY and XLP as their trend lines were broken to the downside. While the past 2 days showed a reversal, I will look for opportunities elsewhere and not repurchase XLY and XLP at this particular time.

3. Domestic Trend Tracking Indexes (TTIs)

Our Trend Tracking Indexes (TTIs) joined the roller coaster of the past week but managed to climb higher thanks or the rally of the past 2 days:

Domestic TTI: +2.53% (last Friday +2.36%)

International TTI: +4.11% (last Friday +3.37%)

Have a great week.

Ulli…

Disclosure: I am obliged to inform you that I, as well as advisory clients of mine, own some of these listed ETFs. Furthermore, they do not represent a specific investment recommendation for you, they merely show which ETFs from the universe I track are falling within the guidelines specified.

————————————————————-

READER Q & A FOR THE WEEK

All Reader Q & A’s are listed at our web site!
Check it out at:

http://www.successful-investment.com/q&a.php

A note from reader Kathy:

Q: Ulli: Two days ago your newsletter said you liquidated these positions but today’s charts are still showing a hold?  Am I missing something?

A: Kathy: As I mentioned in the NL, I am tracking 2 different items in the 2 tables. The first one shows any trend line breaks, some of which happened, while the second one tracks the trailing sell stops.

I did sell my positions on a break below the trend line, but you can use the trailing sell stops as well. It all depends on your risk tolerance.

———————————————————-

WOULD YOU LIKE TO HAVE YOUR INVESTMENTS PROFESSIONALLY MANAGED?

Do you have the time to follow our investment plans yourself? If you are a busy professional who would like to have his portfolio managed using our methodology, please contact me directly or get more details at:
https://theetfbully.com/personal-investment-management/

ETF/No Load Fund Tracker Newsletter For Friday, February 7, 2014

Ulli ETF Tracker Contact

ETF/No Load Fund Tracker StatSheet

————————————————————-

THE LINK TO OUR CURRENT ETF/MUTUAL FUND STATSHEET IS:

https://theetfbully.com/2014/02/weekly-statsheet-for-the-etfno-load-fund-tracker-newsletter-updated-through-02062014/

————————————————————

Market Commentary

Friday, February 7, 2014

EQUITIES END WEEK ON A POSITIVE NOTE

Fri pic

[Chart courtesy of MarketWatch.com]

1. Moving The Markets

The U.S. stock market finished the week on a positive note. The Nasdaq gained over 1.4%, while the S&P 500 and Dow each gained over 1%. The market dug itself a hole at the start of the week, plunging more than 2 percent on Monday. The slide began with investor anxiety over an industry survey that found that manufacturing grew much more slowly in January than in December. Lackluster U.S. auto sales for January added to the bad news.

Investor sentiment began to brighten by Wednesday with a survey of private businesses that showed companies added 175,000 jobs in January, which was in line with average monthly gains the past two years. On Thursday, news that fewer people applied for unemployment benefits last week helped lift the market. On Friday, the market’s gains were broad. All 10 sectors in the S&P 500 index moved higher, led by industrial and health care stocks.

Some stocks missed the rally. LinkedIn fell $13.86 or 6.2 percent, to $209.59 after the company said its performance may falter this year as it spends more on long-term projects and revenue growth slows.

Investors will have no shortage of potentially market-moving news to watch out for in the coming weeks. The bulk of the latest quarterly earnings cycle is over, but the markets will be watching how Washington grapples with another debt ceiling deadline, and how quickly the Federal Reserve moves to reduce its monthly bond purchases.

Our 10 ETFs in the Spotlight recovered and backed away from their trailing sell stops; 9 of them are remaining on the bullish side of their respective trend lines as the tables below show.

Read More

Weekly StatSheet For The ETF/No Load Fund Tracker Newsletter – Updated Through 02/06/2014

Ulli ETF Tracker Contact

ETF/Mutual Fund Data updated through Thursday, February 6, 2014

Table of Content082312

If you are not familiar with some of the terminology used, please see the Glossary of Terms.


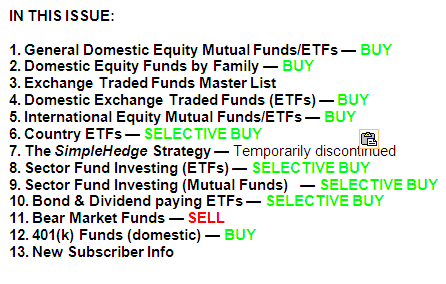
1. DOMESTIC EQUITY MUTUAL FUNDS/ETFs: BUY — since 10/25/2011

TTI

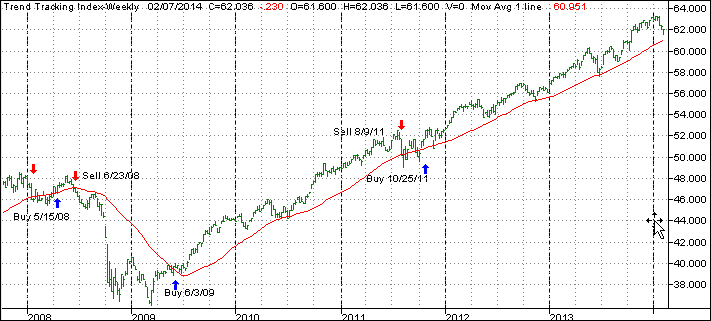
Our main directional indicator, the Domestic Trend Tracking Index (TTI), broke through its long-term trend line generating a Sell for this area effective 8/9/2011. Over the recent past, we’ve seen the TTI hovering slightly below and above this dividing line between bullish and bearish territory. The clear break to the upside occurred on 10/24/11 and, effective 10/25/11, a new Buy signal for domestic equities went into effect.

As of today, our TTI (green line in above chart) has bounced off its long term trend line (red) by +1.87%.

To avoid a potential whip-saw, a Sell signal to move out of all domestic equity positions will be generated once we have clearly pierced the line to the downside. Be sure to tune in for the latest updates.

Read More

Stocks Back On Top; ECB Not To Drop Interest Rates

Ulli Market Commentary Contact

Thur pic

[Chart courtesy of MarketWatch.com]

1. Moving The Markets

Stocks here in the U.S. had their best gain in 7 weeks today. The S&P 500 (SPX) closed up 1.24%, the Dow (DJIA) closed up 1.22% and the Nasdaq Composite (COMP) finished the day 1.1% higher. What seemed to have the biggest impact on markets today was the data on weekly jobless claims. Data was released that showed the number of people who applied for unemployment benefits for the first time fell by 20,000 to 331,000 last week, which was 6,000 better than the forecasted 337,000

Green Mountain Coffee Roasters (GMCR) exploded upwards 26% today after releasing the news that Coca-cola (KO) will take a 10% stake in the company for $1.25 billion alongside a 10-year drink deal.  Disney (DIS) was one of the Dow’s big gainers today. Shares increased 5.3% after its earnings topped estimates, drawing on big gains from the recent blockbuster “Frozen”.

Across the globe, European stock markets reacted positively to the news that the European Central Bank has decided not to change interest rates from their current 0.25% level. Some analysts had thought it might cut rates down to 0.1%. Weak growth and an unexpected drop in inflation have raised concerns that the eurozone might slide into deflation, which could cripple the economy. Asian stocks performed relatively well today apart from the Nikkei.

Our 10 ETFs in the Spotlight recovered as well with only 2 of them hovering below their respective long-term trend lines.

Read More

Volatility Is All The Buzz

Ulli Market Commentary Contact

WEd pic

[Chart courtesy of MarketWatch.com]

1. Moving The Markets

Volatility seems to be the name of the game so far in 2014. One day the markets are down, the next they bounce back only to fall again the day after. All of the major U.S. indices closed in the red today after a private survey showed that U.S. businesses added jobs at a steady but modest pace in January. Investors are also looking to a key government report on job growth on Friday, as many investors remain leery, waiting to see if upcoming economic reports and company earnings will show that the U.S. economic recovery is on track.

Despite Wednesday’s overall decline in the market, many stocks finished in the green. Walgreens (WAG) was amongst the top performers of the S&P, gaining 3.4%. TJ Max (TJX) was not far behind, gaining 3.1%. If you like gambling (on other things besides stocks) you may have taken note of the casino stocks that were in the news today.  Las Vegas Sands (LVS), Wynn Resorts (WYNN) and MGM Resorts International (MGM) all dropped today as a reaction to the disappointing gambling revenue numbers that came out of Macau. Apparently, there was significantly less gambling throughout the lunar New Year holiday.

While not making major news today, gold still remains a topic of interest as the markets continue to be unpredictable. The Market Vectors Junior Gold Miners ETF (GDXJ) has gained an impressive 16% this year, a remarkable comeback from last year’s 61% plunge. The Market Vectors Gold Miners ETF (GDX), tracking large-cap miners, has bounced back 10% this year from a 54% nose-dive last year and the SPDR Gold Trust (GLD), the largest ETF tracking gold bullion, with $32 billion in assets, has gained 4% year to date after losing 28% in 2013.

Our 10 ETFs in the Spotlight meandered with 4 of them now hovering below their respective long-term trend lines.

Read More

02-05-2014

Ulli Newsletter Archives Contact

The ETF/No Load Fund Tracker

Monthly Review—January 31, 2013

US Stocks End January With Losses; Europe Posts Biggest Decline Since June

US stocks suffered their worst monthly decline in over a year in January as disappointing earnings, a continuing selloff in emerging markets and renewed fears over a looming deflation in the euro zone sapped investor confidence.

The S&P 500 index closed out January at 1,783, capping its monthly loss at 3.6 percent. Seven of the ten sectors finished the month lower with energy declining the most and shedding 6.3 percent. Consumer-discretionary was the second-weakest sector and followed energy closely with a 6.0 percent slump.

Both the DJIA and the S&P 500 marked their worst monthly declines since May 2012.

Stock markets witnessed heavy selling towards the end of the month as a steep drop in emerging market currencies prompted anxious investors to flee riskier assets. The Federal Reserve’s decision to reduce its monthly assets purchase by another $10 billion to $65 billion triggered the rout in emerging market currencies, as spooked investors set off capital outflows on fears of a liquidity tightening in the US. Some analysts said, however, the correction was expected as equities rose too fast at the end of last year.

The US economy continued to trudge along although the fourth-quarter advance GDP estimate showed an increase of 3.2 percent, tallying annual GDP at 1.9 percent. That compares with the 2.8 percent growth witnessed in 2012. Economists attributed the slowdown to large tax hikes and sharp government spending cuts that came into effect in the first half of 2013.

Consumer spending, the largest component of the economy that constitutes nearly 70 percent of gross domestic product, rose a seasonally adjusted 0.4 percent in December after an upwardly revised 0.6 percent rise in November. Spending could experience headwinds in the earlier part of the year as some 1.35 million Americans are likely to be affected after the Jan 1 cutoff in extra jobless benefits.

Nevertheless, the economy continued to paint a mixed picture in January. Orders for durable goods fell 4.3 percent in December although business capital spending rose at the fastest rate in nearly two years.

The much awaited Case/Shiller composite index revealed US home prices ticked down 0.1 percent in November with nine of the 20 cities tracked showing price drops. Still, home prices were up 13.7 percent over the same period in 2012, which marked the fastest annual growth since early 2006. Median home prices rose 8.4 percent to $265,800 from the prior year.

Across the Atlantic, the Stoxx Europe 600 index lost 1.8 percent in January to mark its worst monthly loss since June.

The threat of a looming deflation in the currency bloc continued to haunt investors. Data released by the European Union’s statistics office Eurostat showed January inflation dropped to 0.7 percent from 0.8 percent in the prior month, stoking fears of a spiraling decline in consumer prices that could derail the fragile recovery.

While the major trend direction, as measured by my Domestic Trend Tracking Index (TTI), remains bullish, short-term, we have seen a reversal that has brought us to within striking distance of a break below the trend line (red) and into bear market territory. We will have to wait and see as to whether that will actually materialize or not. Here’s the latest TTI chart:

TTI

The index itself (green line) still hovers above the trend line (red) by +1.15%.

With the market pullback in January and into early February, some our holdings headed south as well and triggered our tailing sell stops.

The 12-months chart below clearly shows the top in the markets (red arrow) and the subsequent decline of our various positions as we headed into January.

12-months

The weakest of the bunch was consumer staples (XLP) which, despite its conservative nature, has been on a slowdown since mid-November. Our sell stop was triggered towards the end of January, and the position was liquidated.

The fund with the sharpest drop was the Consumer Discretionary ETF (XLY), which showed the greatest volatility, tripped our sell stop in early February and was liquidated as well. We are holding all others for the time being, and I am prepared to pull the trigger should the need arise.

It’s too early to tell whether this current sell-off will continue and push us into outright bear market territory or if some sudden positive economic data points will save the month. We have suddenly slipped into quicksand and it’s important that we stay with our exit strategy just in case the bear returns with a vengeance and presents a repeat performance of 2008, a year with devastating consequences that most investors already have conveniently forgotten.