Equity ETFs Remain Red While Mortgage ETFs Gain Ground

Ulli Market Commentary Contact

Tue pic

[Chart courtesy of MarketWatch.com]

1. Moving The Markets

U.S. stocks fell for a third straight session, dropping from record levels in a broad decline as investors took profits amid signs of a weak holiday shopping season. Retail and consumer discretionary stocks were among the weakest of the day. Amazon.com Inc slipped 2 percent to $384.66 and was one of the biggest drags on the S&P 500. Some investors might simply be locking in profits after eight weeks of gains, while others might be fearful of the Fed beginning to taper the stream of cash it’s pumping into the economy.

On a more global scale, the yen advanced against the dollar and the euro on Tuesday, reversing losses sustained earlier in the global trading day, as falling stock markets worldwide sent traders into the relative safety of the Japanese currency. This was perhaps a factor in Japan’s Nikkei share average rising to its highest close in six years today. Brazil’s economy contracted in the third quarter for the first time since early 2009 as a steep drop in investment showed flagging confidence in what was recently one of the world’s most attractive emerging markets.

Mortgage REIT ETFs are gaining focus on renewed taper concerns. The declining delinquency rates coupled with an increasing credit balance in turn enhances credit quality of the firms, making the conditions ideal for investing in the mortgage finance industry. Further, stable job markets, rising home sales, higher home prices and still-low mortgage interest rates are compelling homeowners to finance more loans.

Our ETFs in the Spotlight continued to slip off their highs but remain in bullish territory:

Read More

Window Shoppers Prevail But USDs Still Appreciating

Ulli Market Commentary Contact

Mon pic

[Chart courtesy of MarketWatch.com]

1. Moving The Markets

Shoppers spent less over the Thanksgiving weekend and that weighed on stocks Monday. While they turned out in record numbers in the four days ending Sunday they plunked down less cash than they did last year. It was the first decline in Thanksgiving weekend spending since a retail trade group began tracking it in 2006. Investors reacted by selling all types of retailer stocks, from department stores to specialty chains. J.C. Penney, Target and Coach fell more than 1 percent each. Urban Outfitters dropped 3.5 percent.

The dollar is up against its major competitors at the start of the new trading week. The U.S. currency recovered from early weakness Monday and has extended its gains following the unexpected increase in the ISM manufacturing index. There will be a number of important U.S. economic reports released later this week, including GDP on Thursday and the U.S. jobs report for November on Friday.

All ETF sectors, except for Energy and Health Care, closed in the red zone Monday. Already reeling from some sour November performances, precious metals mining ETFs have started the last month of the year in similar fashion to how they ended the previous month: Ugly.

A rocky 2013 for emerging markets exchange traded funds in terms of investor redemptions continued in November and looks to do the same in December, with diversified funds tracking developing world economies witnessing $3.6 billion of outflows last month. Of the 10 worst ETFs in terms of 2013 outflows, five are emerging markets funds, including FXI and the iShares MSCI Brazil Capped ETF (EWZ), according to BlackRock data.

Our ETFs in the Spotlight pulled slightly off their highs, so let’s take a look:

Read More

ETFs/Mutual Funds On The Cutline – Updated Through 11/29/2013

Ulli ETFs on the Cutline Contact

ETFs/Mutual Funds On The Cutline – Updated Through 11/29/2013

Below are the latest ETF Cutline reports, which show how far above or below their respective long-term trend lines (39 week SMA) my currently tracked ETFs/MFs are positioned.

The first report covers the ETF Master List from Thursday’s StatSheet and includes 398 ETFs, of which currently 332 (last week 340) are hovering in bullish territory.

The second report includes only High Volume ETFs. To clarify, High Volume (HV) ETFs are defined as those with an average daily volume of $10 million or higher.

These ETFs are generated from my selected list of some 93 that I use in my advisor practice. It cuts out the “noise,” which simply means it eliminates those ETFs that I would never buy because of their volume limitations. 67 ETFs (last week 71) have managed to remain in bullish territory after the recent market volatility.

The third report covers Mutual Funds on the Cutline. There are currently 791 (last week 794) above the line and 59 below it out of the 859 that I follow.

Take a look:

1. ETF Master Cutline Report     

2. ETF High Volume Cutline Report

3. MF Cutline Report

In case you are not familiar with some of the terminology used in the reports, please read the Glossary of Terms.

If you missed the original post about the Cutline approach, you can read it here.

One Man’s Opinion: Will Equities Move Higher Until The Fed Starts To Raise Rates?

Ulli Market Review Contact

92835431Janet Yellen is expected to be confirmed as the next head of the Federal Reserve, and the US employment number is her main concern. She has made it adequately clear that she’s single-mindedly focused on jobs and not really concerned about the inflation aspect or any other data point, said David Robin, managing director and co-head of financial futures and options at Newedge LLC.

The Fed has done some heavy lifting since the early part of September to retake control of the policy path message; that rates are going to be on hold for an extended period and tapering is not even on the near-term horizon though it was certainly part of the discussion, however, it’s not a viable policy path.

Everybody knows Janet Yellen is going to be to the dovish side of Chairman Bernanke when she takes over. She made it very clear in her testimony that she’s even further to the dovish side and any question that she’s going to waver from her single-minded task of regenerating economic growth should be put to rest. Her commitment on that issue is pretty solid, and the markets are fairly clear on that message as well, David said.

Read More

New ETFs On The Block: Wisdomtree Korea Hedged Equity ETF (DXKW)

Ulli Korea ETFs Contact

91551519WisdomTree, the New York-based fifth largest exchange-traded fund issuer with about $38 billion in assets under management and 55 different products, has launched its sixth currency-hedged equity ETF.

The latest product – the WisdomTree Korea Hedged Equity Fund (DXKW), is another attempt by the issuer to replicate the wild success of its $10.6 billion Japan Hedged Equity Fund (DXJ) that has mopped up nearly $9 billion in assets in 2013 alone.

The new fund is the first hedged-currency play on South Korea, Asia’s fourth largest economy, and allows US investors to buy Korean equities while eliminating fluctuations in the exchange rate between the US dollar and the South Korean Won.

Read More

11-29-2013

Ulli Newsletter Archives Contact

ETF/No Load Fund Tracker Newsletter For Friday, November 29, 2013

ETF/No Load Fund Tracker StatSheet

————————————————————-

THE LINK TO OUR CURRENT ETF/MUTUAL FUND STATSHEET IS:

https://theetfbully.com/2013/11/weekly-statsheet-for-the-etfno-load-fund-tracker-newsletter-updated-through-11272013/

————————————————————

Market Commentary

Friday, November 29, 2013

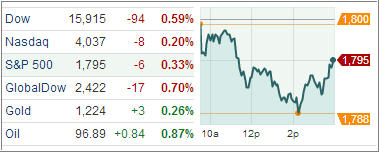
GOVERNMENT SHUTDOWN SEEMS ALL BUT FORGOTTEN

Fri chart

[Chart courtesy of MarketWatch.com]

1. Moving The Markets

The factors behind stocks’ gains this week were perhaps more difficult to pin down than usual. One driver appeared to be a general sense that economic growth was improving, but not so fast as to encourage the Federal Reserve to slam on the brakes by tightening monetary policy. Stocks saw their biggest gains on Thursday, when the Labor Department reported that weekly jobless claims had declined to levels last seen in September—and close to where they had been before the recession began in late 2007.

Perhaps one of the most important economic news stories of the week pertained to Barak Obama’s signature healthcare reform. The administration revealed Wednesday that online health insurance enrollment for small businesses will be delayed by a year. The opening of the online health exchange for small businesses had previously been delayed until the end of this month, but it has now been pushed back until November of 2014.

The government shutdown and fiscal problems seem all but forgotten though as the ETF markets rallied throughout November. The top non-leveraged ETFs over November include Global X China Financials ETF (CHIX) up 11.2%, SPDR S&P Pharmaceuticals ETF (XPH) up 10.5% and iShares China Large-Cap ETF (FXI) up 10.0%.  Chinese stocks are rising to a one-month high after Beijing pledged extensive economic, legal and social reforms.

Our ETFs in the spotlight confirm these trends, so let’s take a look:

2. ETFs in the Spotlight

In case you missed the announcement and description of this section, you can read it here again.

It features 10 broadly diversified ETFs from my HighVolume list as posted every Monday. Furthermore, they are screened for the lowest MaxDD% number meaning they have been showing better resistance to temporary sell offs than all others over the past year.

In other words, none of them ever triggered their 7.5% sell stop level during this time period, which included a variety of severe market pullbacks but no move into outright bear market territory.

Here are the 10 candidates:

MaxDD

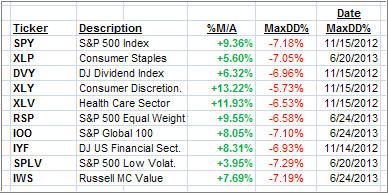
All of them are in “buy” mode meaning their prices are above their respective long term trend lines by the percentage indicated (%M/A).

Now let’s look at the MaxDD% column and review the ETF with the lowest drawdown as an example. As you can see, that would be XLY with the lowest MaxDD% number of -5.73%, which occurred on 11/15/2012.

The recent sell off in the month of June did not affect XLY at all as its “worst” MaxDD% of -5.73% still stands since the November 2012 sell off.

A quick glance at the last column showing the date of occurrences confirms that five of these ETFs had their worst drawdown in November 2012, while the other five were affected by the June 2013 swoon, however, none of them dipped below their -7.5% sell stop.

Year to date, here’s how the above candidates have fared so far:

YTD

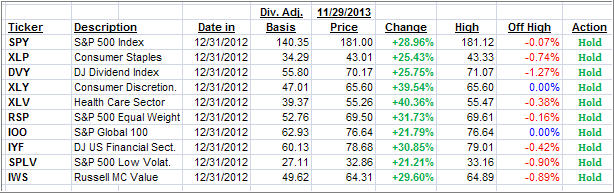
With the positive tone in the market having returned, 2 ETFs have made new highs this week represented by the 0.00% value in the “Off High” column.

3. Domestic Trend Tracking Indexes (TTIs)

Trend wise, our Trend Tracking Indexes (TTIs) headed higher with the indexes and remain above their long term trend lines by the following percentages:

Domestic TTI: +4.85% (last Friday +4.77%)

International TTI: +7.57% (last Friday +7.42%)

Have a great week.

Ulli…

Disclosure: I am obliged to inform you that I, as well as advisory clients of mine, own some of these listed ETFs. Furthermore, they do not represent a specific investment recommendation for you, they merely show which ETFs from the universe I track are falling within the guidelines specified.

————————————————————-

READER Q & A FOR THE WEEK

All Reader Q & A’s are listed at our web site!
Check it out at:

http://www.successful-investment.com/q&a.php

A note from reader Mike:

Q: Ulli: What is the difference between the “DD%” and the “trailing stop loss %”?

A: Mike: The DD% refers to the percentage a fund has come off its high. This is the high a fund has made since you purchased it, and it serves as a basis for calculating the trailing sell stop. For example, let’s assume you bought an ETF for $10 and it subsequently moves as follows for the next trading days: 10.05, 9.98, 10.15, 10.21, 10.30, 10.19, 10.14…

The high it has made in this data series is 10.30, which becomes the basis for calculating your 7.5% trailing sell stop, which would be at 9.52. If prices sink through 9.52, without taking out the high of 10.30 first, that would be your trigger point to exit the position.

In my weekly StatSheet listings, you can see the percentage a fund has come off its high in the DD% column. Once that number exceeds -7.5%, it means a sell signal for that fund has been generated. To be clear, if you bought this fund at a different time than shown in the StatSheet, you need to track your own highs (no pun intended) as mentioned above.

Hope this clarifies it.

———————————————————-

WOULD YOU LIKE TO HAVE YOUR INVESTMENTS PROFESSIONALLY MANAGED?

Do you have the time to follow our investment plans yourself? If you are a busy professional who would like to have his portfolio managed using our methodology, please contact me directly or get more details at:

https://theetfbully.com/personal-investment-management/

———————————————————

Back issues of the ETF/No Load Fund Tracker are available on the web at:

https://theetfbully.com/newsletter-archives/