
- Moving the market
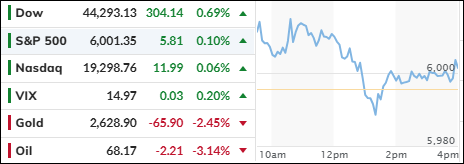
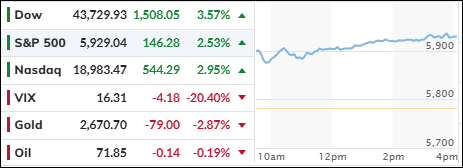
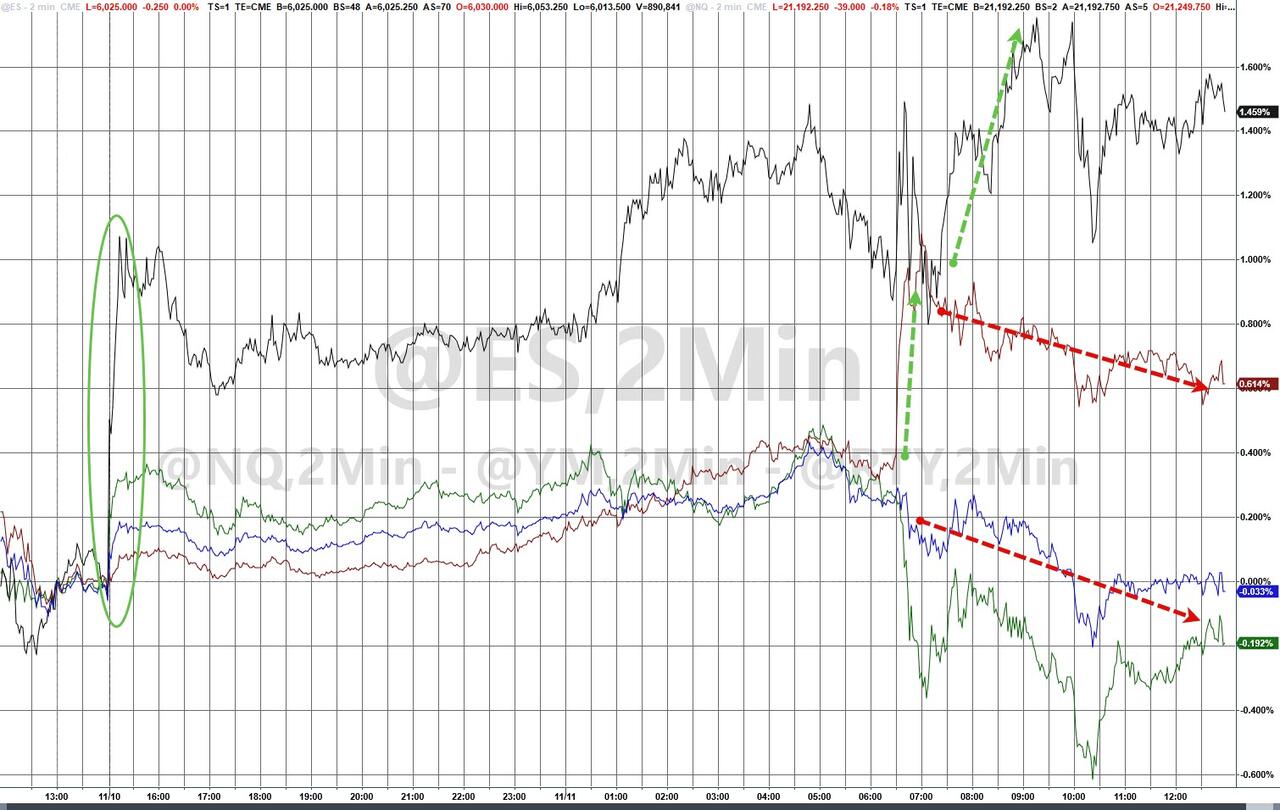
The Dow continued its rally from last week, surpassing the 44,000 mark, while the S&P 500 also made significant strides by crossing the 6,000 level. However, the Nasdaq lagged. With the bond markets closed, trading activity was somewhat limited.
Several major banks saw their stock prices rise significantly, contributing to the Dow’s impressive gain of over 300 points. Traders are hopeful that Trump’s election victory might lead to more lenient regulations for the banking sector.
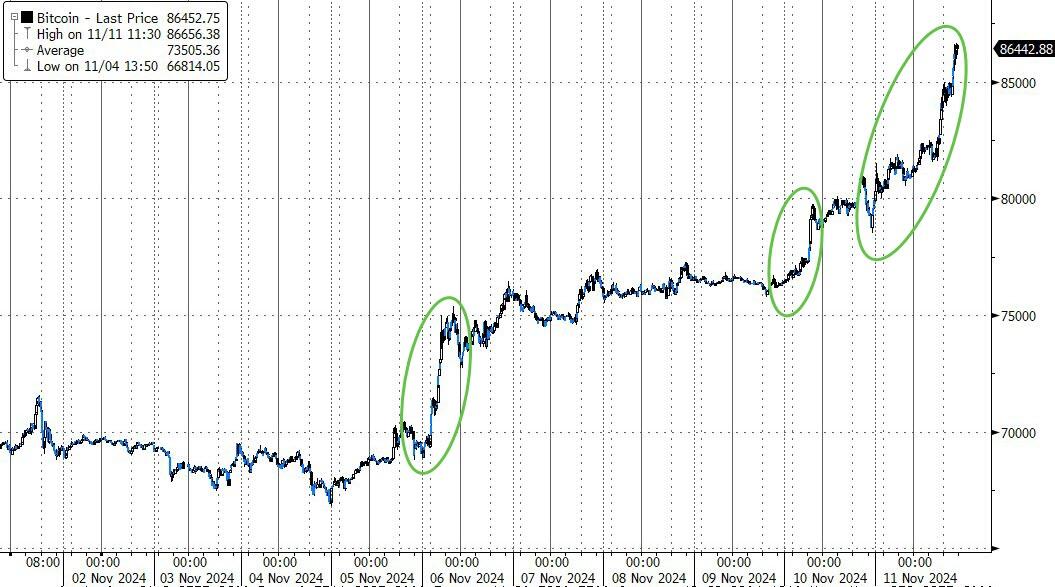
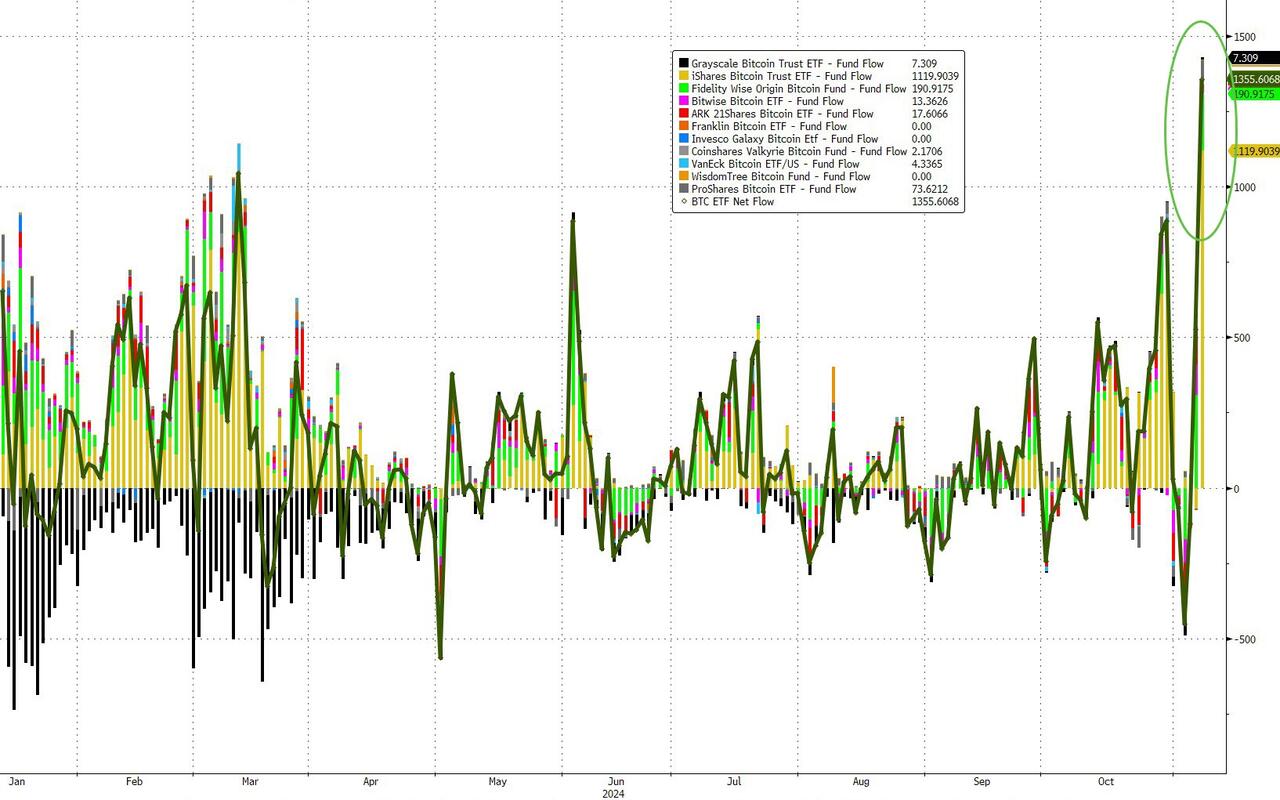
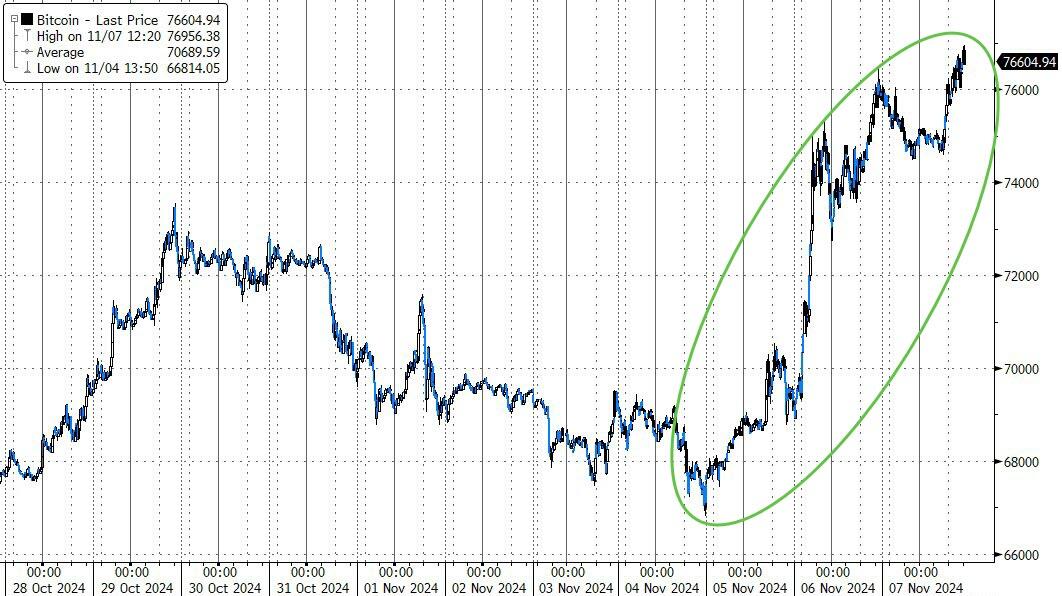
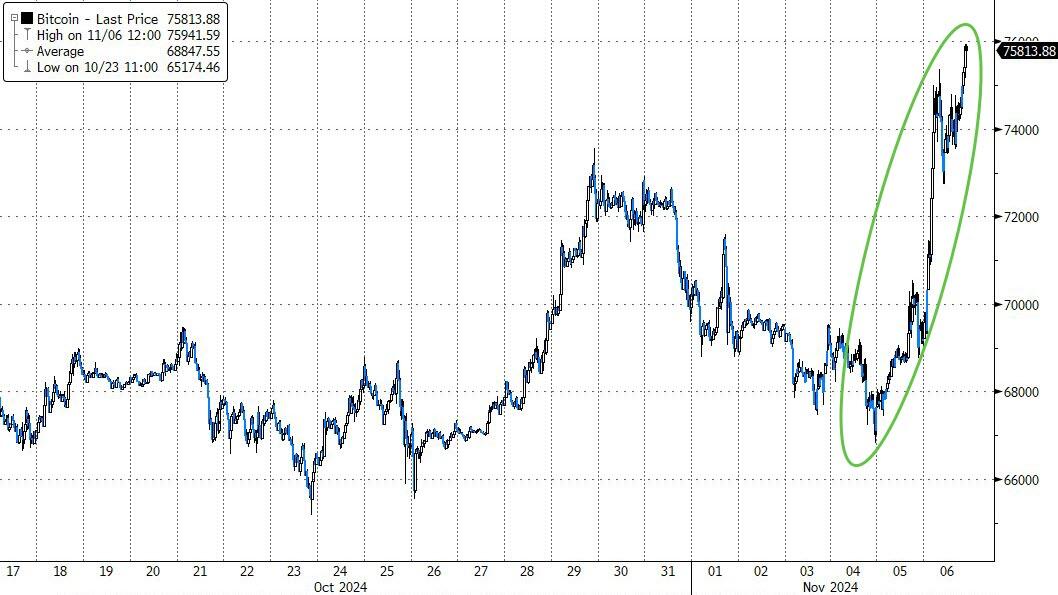
Bitcoin underwent a massive surge over the weekend, effortlessly breaking through the $80,000 barrier and ending the day around $87,000. This rise was fueled by hopes of deregulation and the historical trend that Bitcoin’s best performances occur approximately six months after each four-year halving cycle.
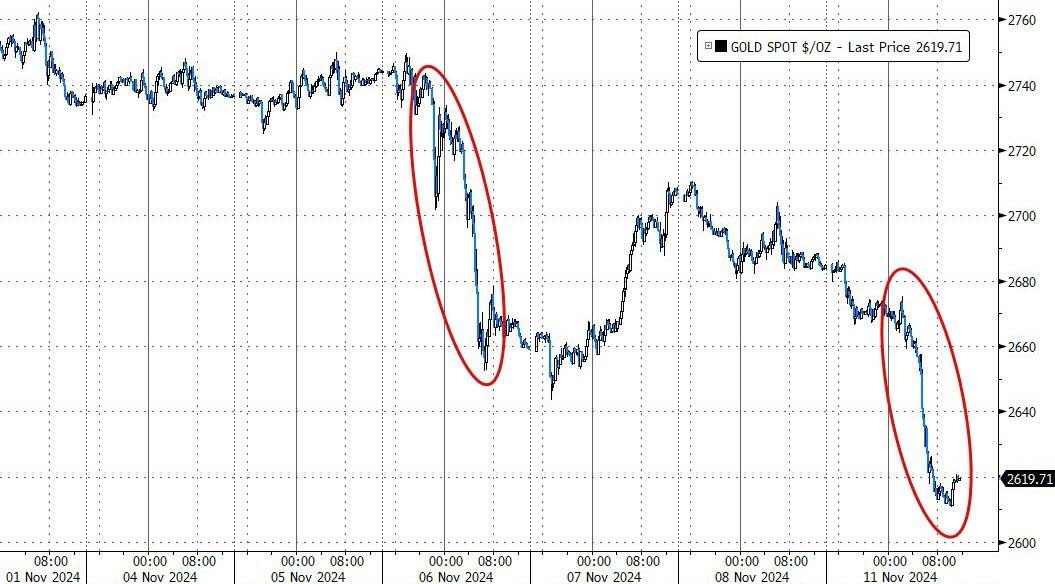
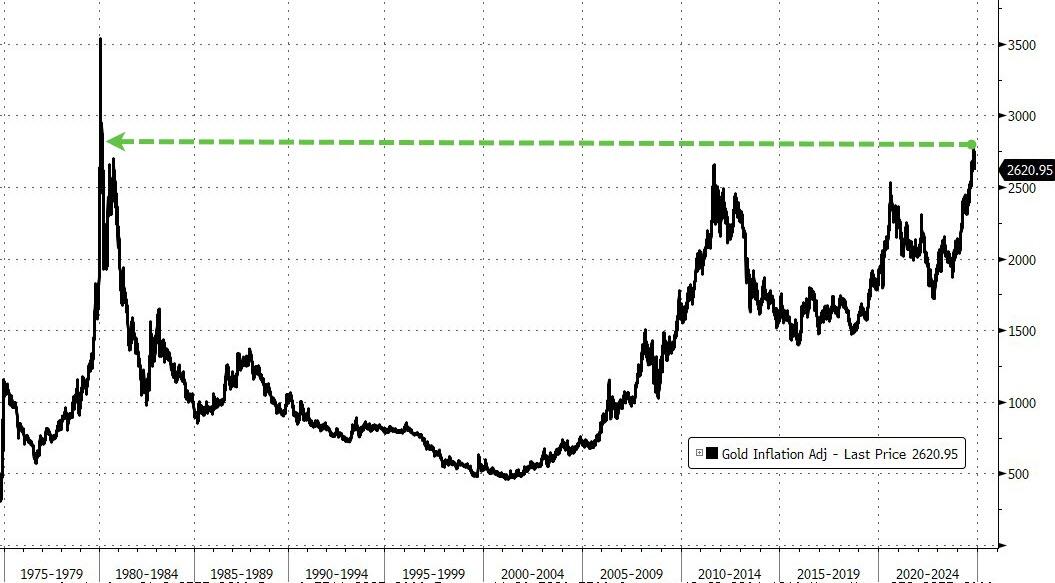
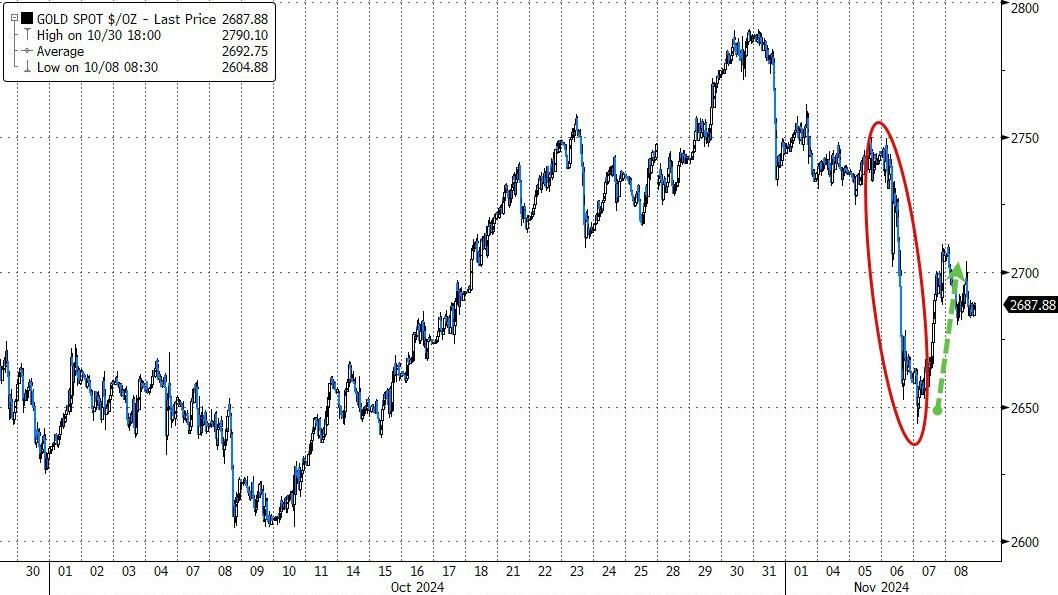
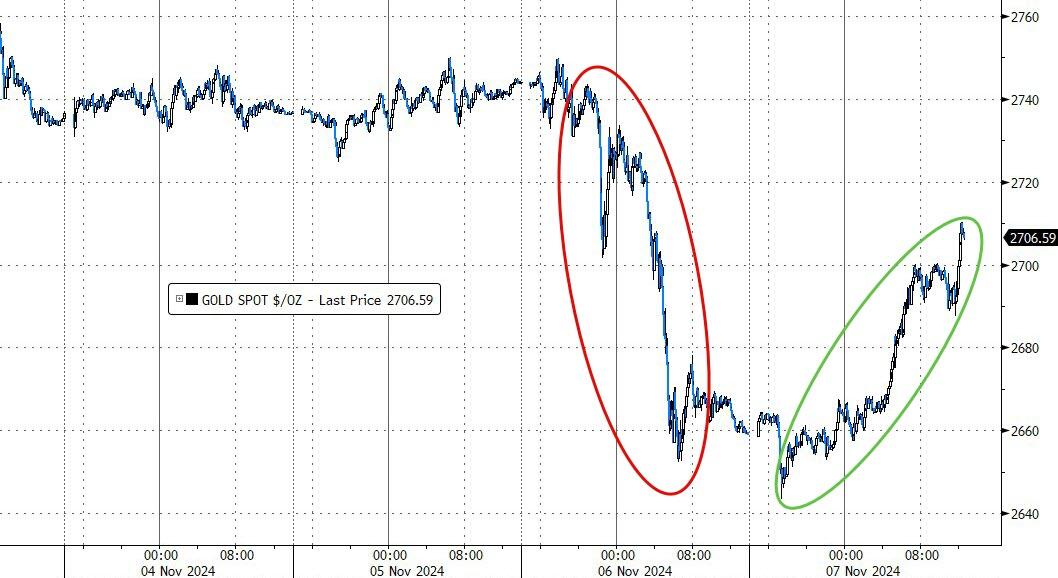
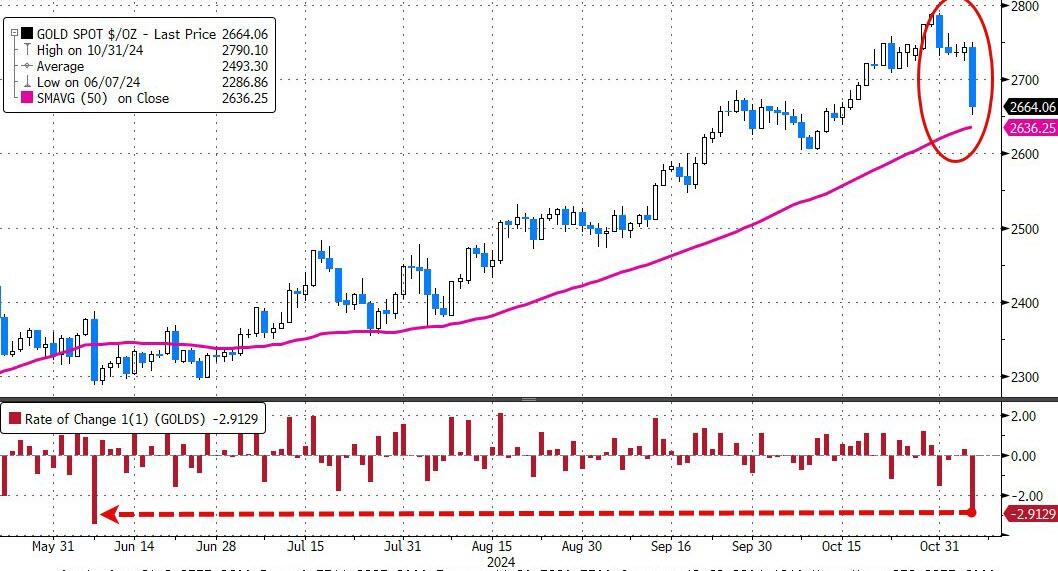
In contrast, gold prices have been declining since the election. However, when adjusted for inflation, the precious metal has not seen a significant pullback from its all-time high.
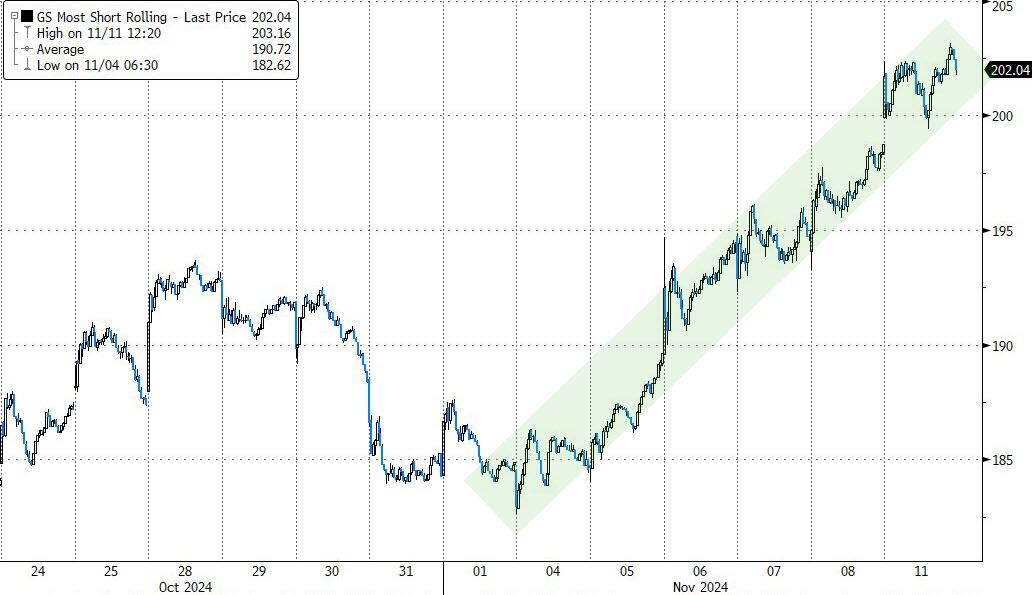
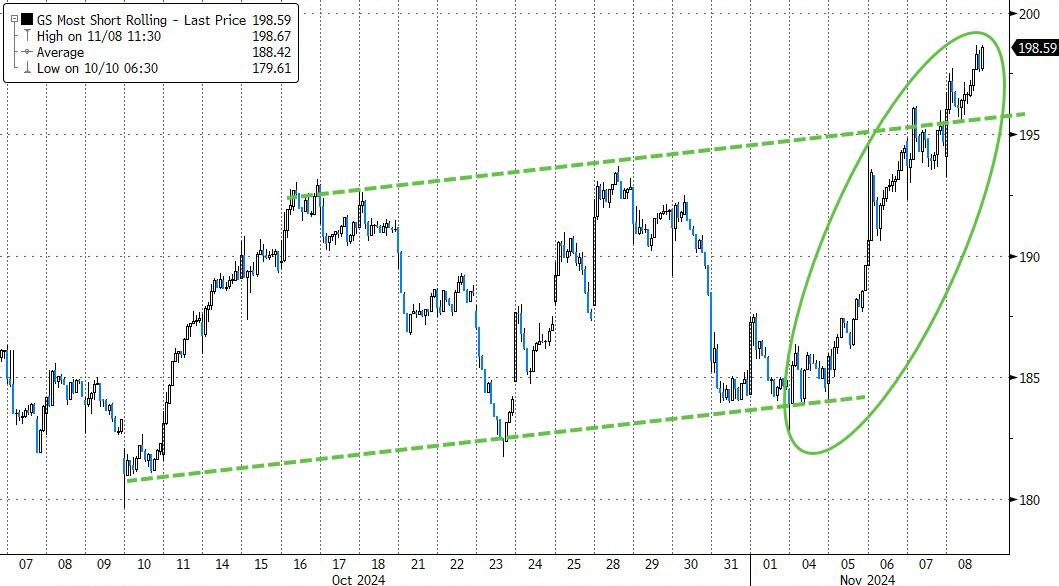
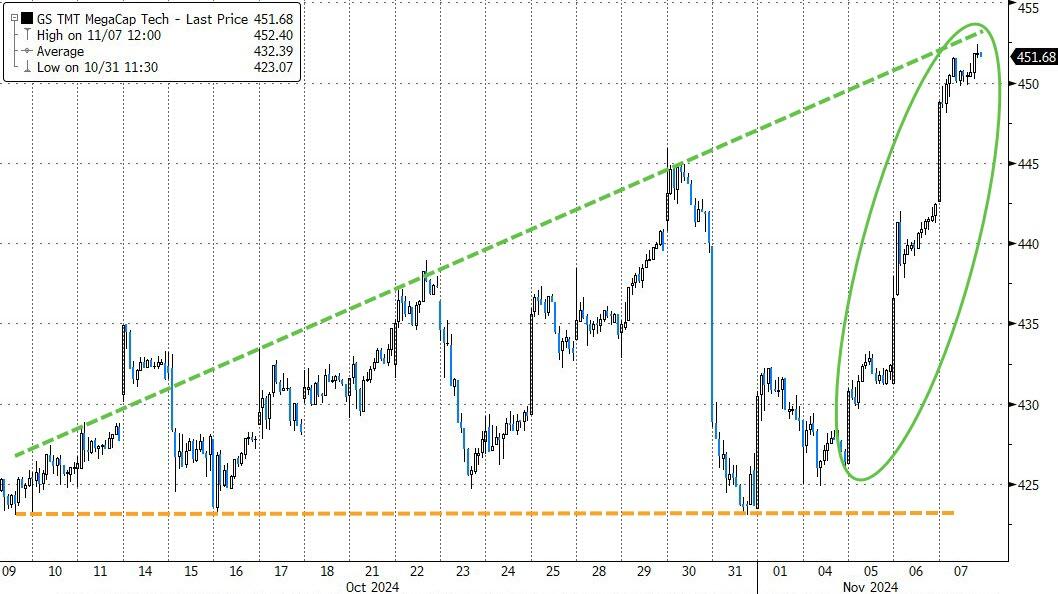
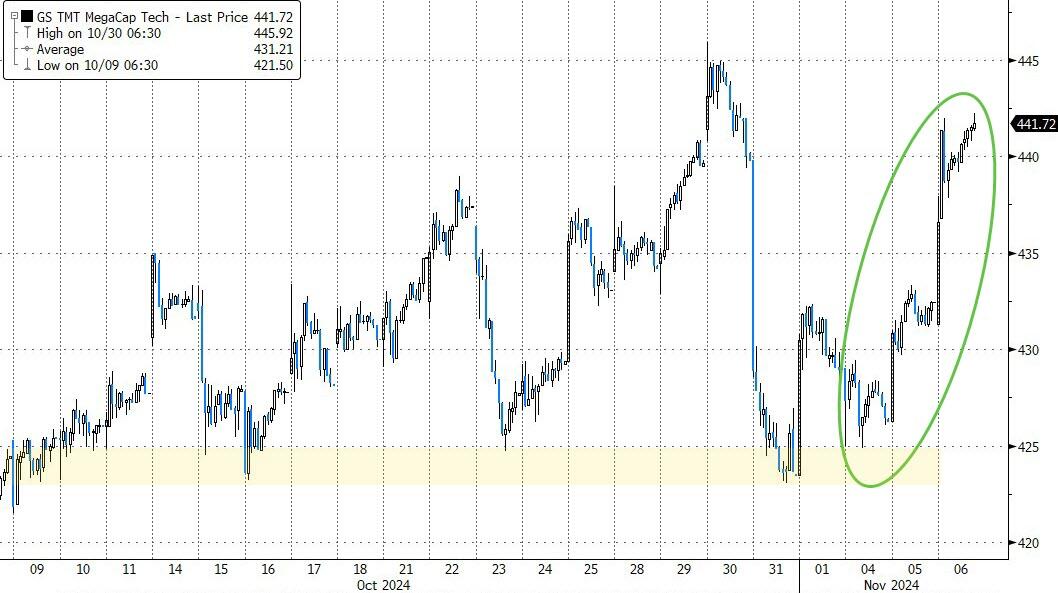
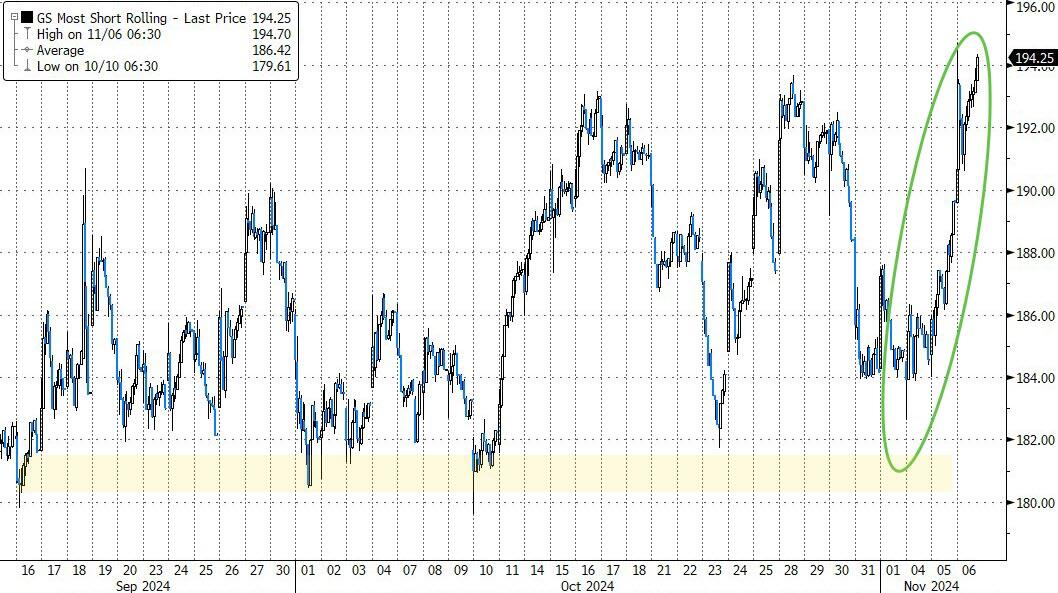
Small Caps emerged as the big winners, while the Nasdaq, despite closing slightly in the green, was the biggest loser. This was partly due to the most shorted stocks recording their fifth consecutive day of gains.
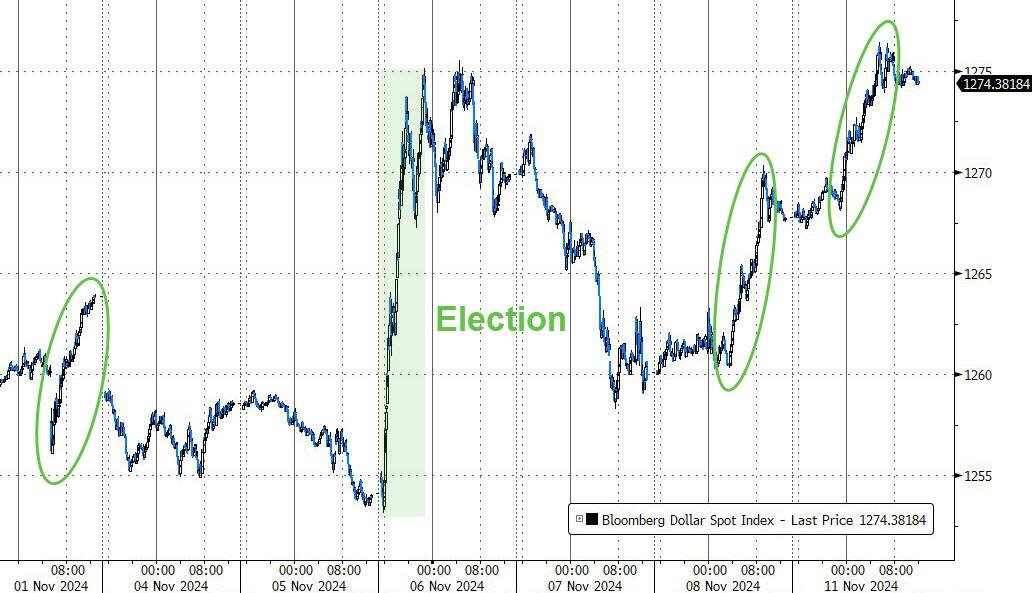
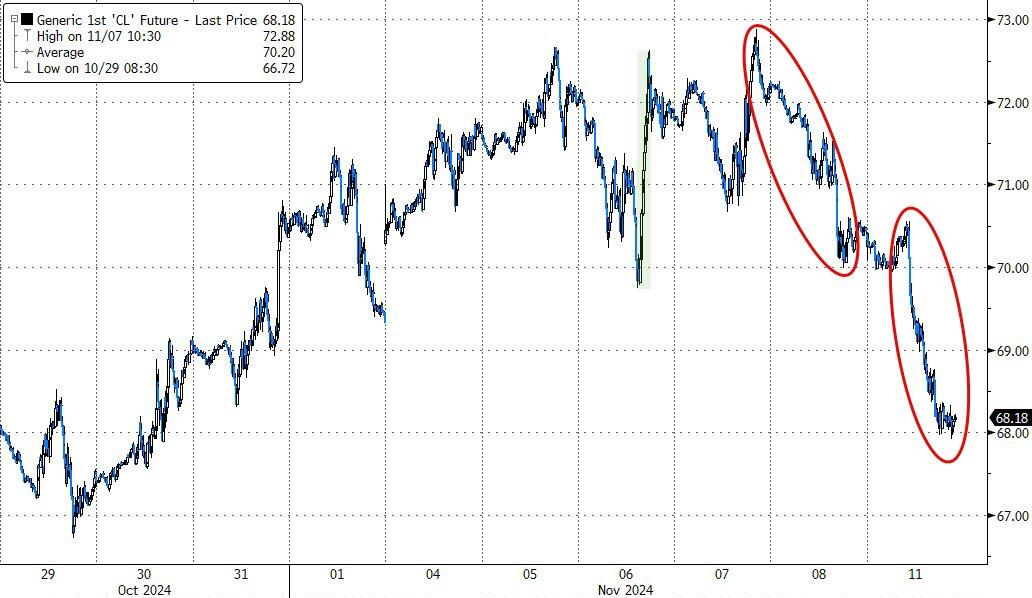
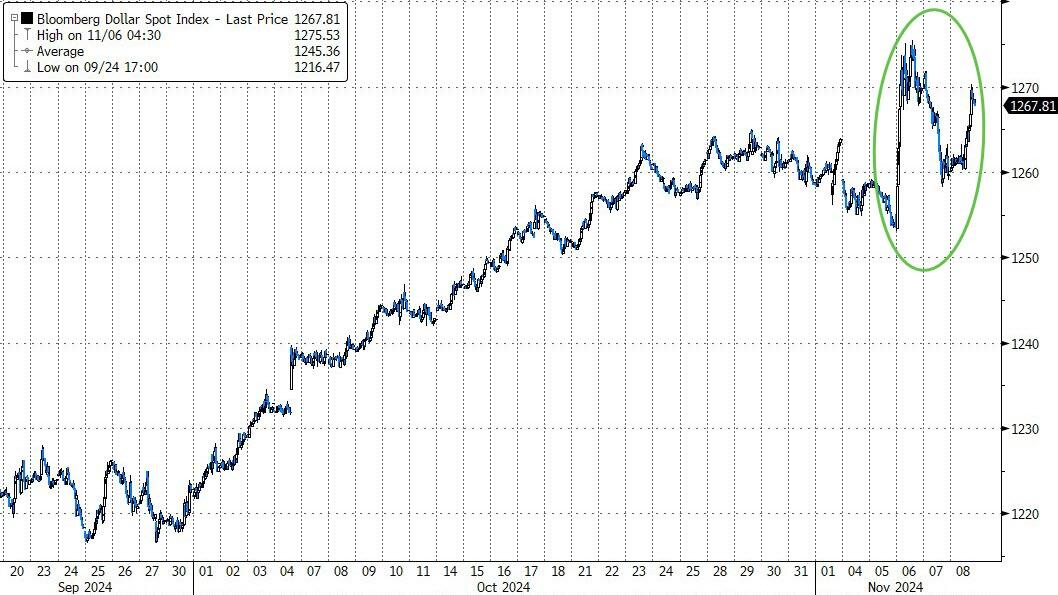
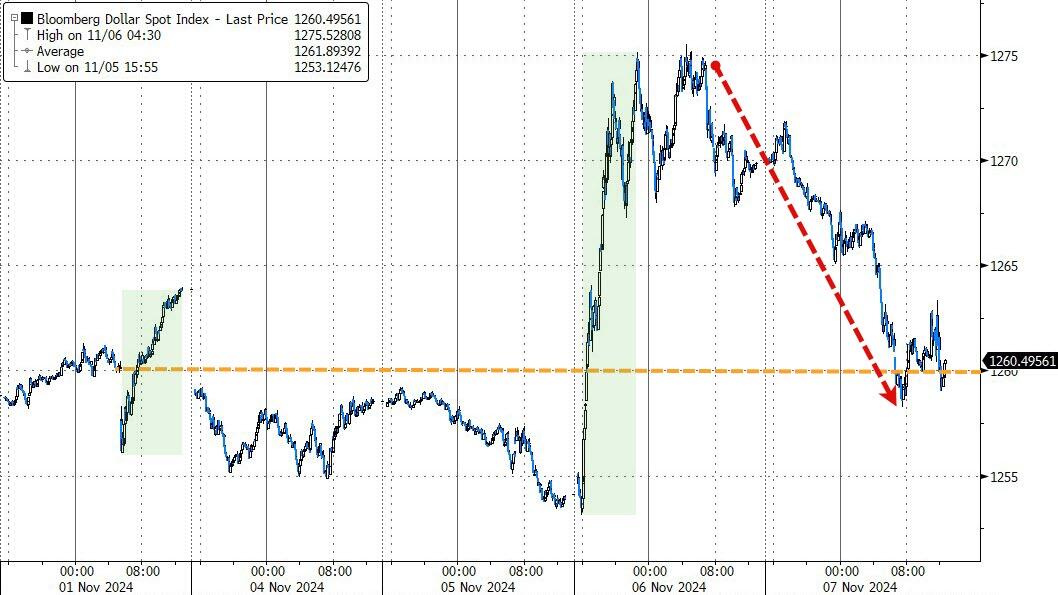
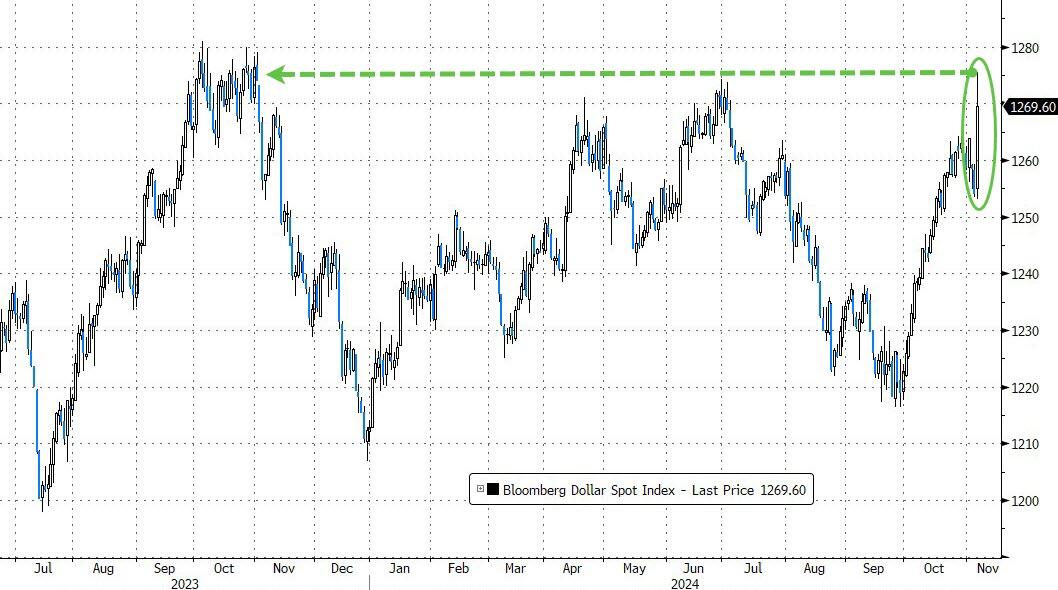
The dollar rallied back to recent highs, while crude oil prices fell to two-week lows, dropping below the $70,000 level.
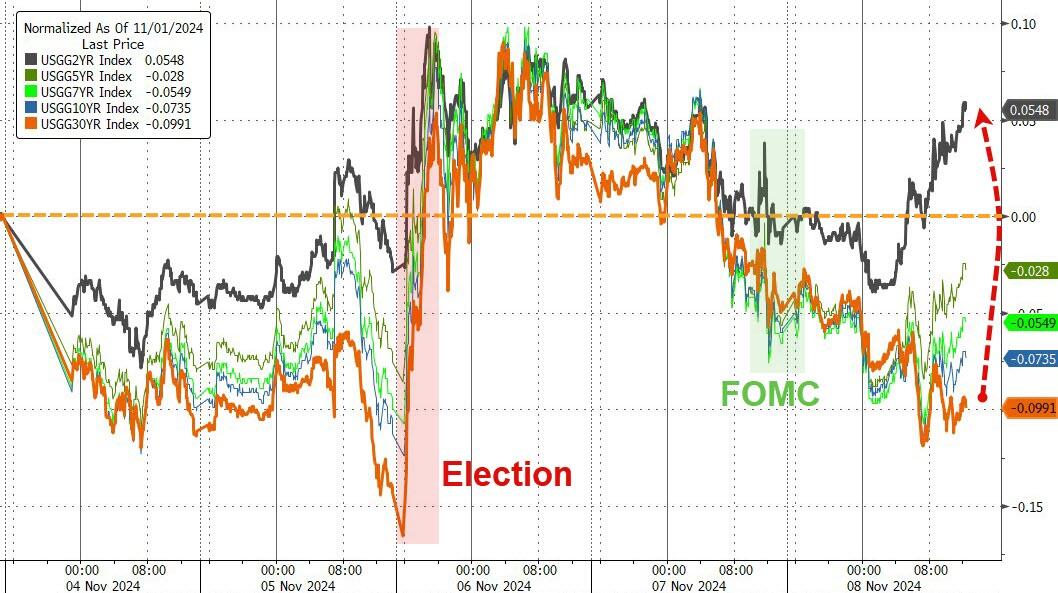
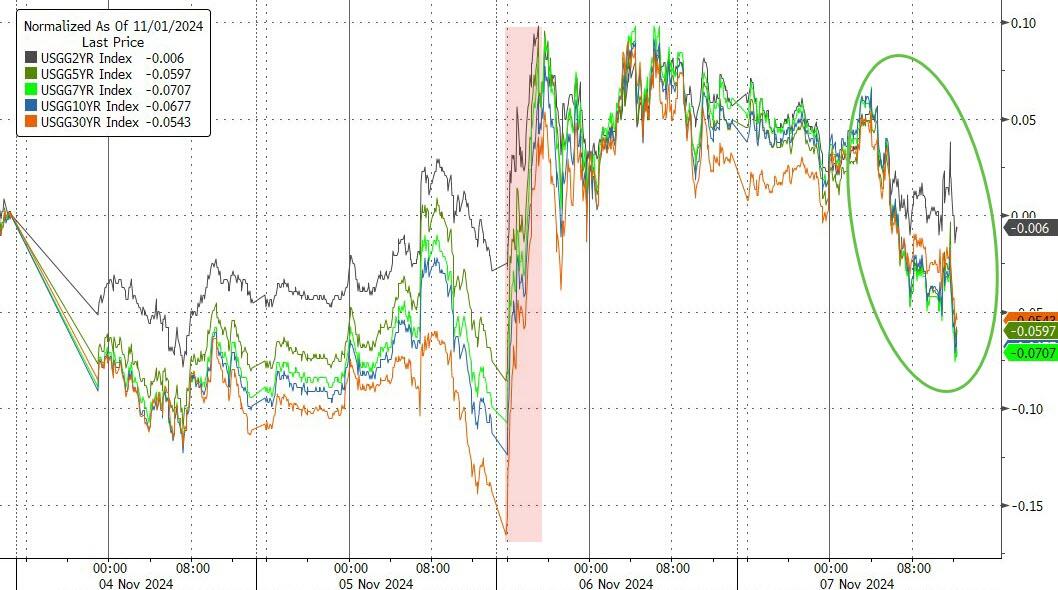
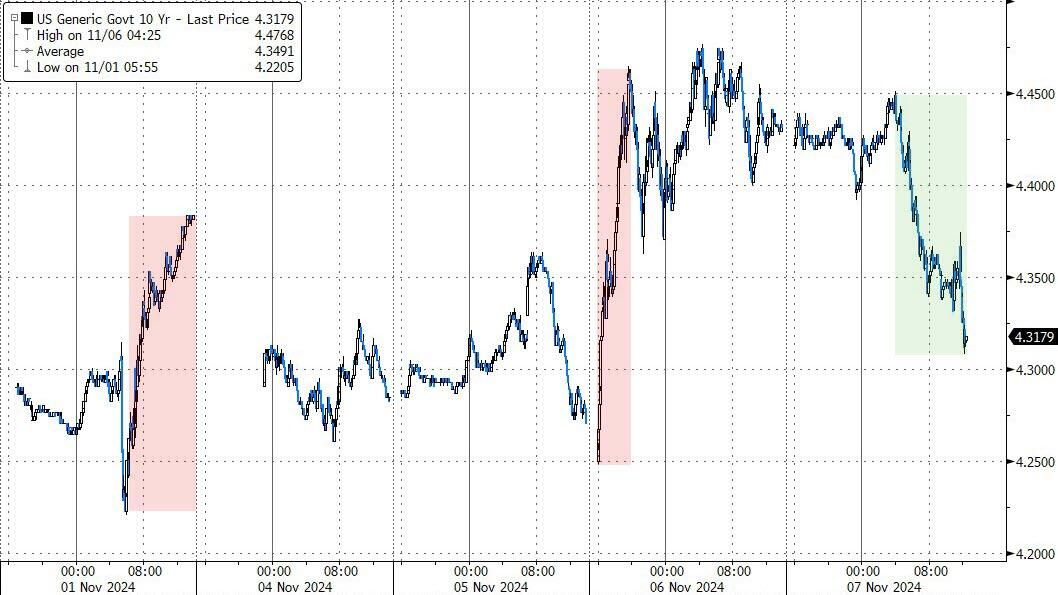
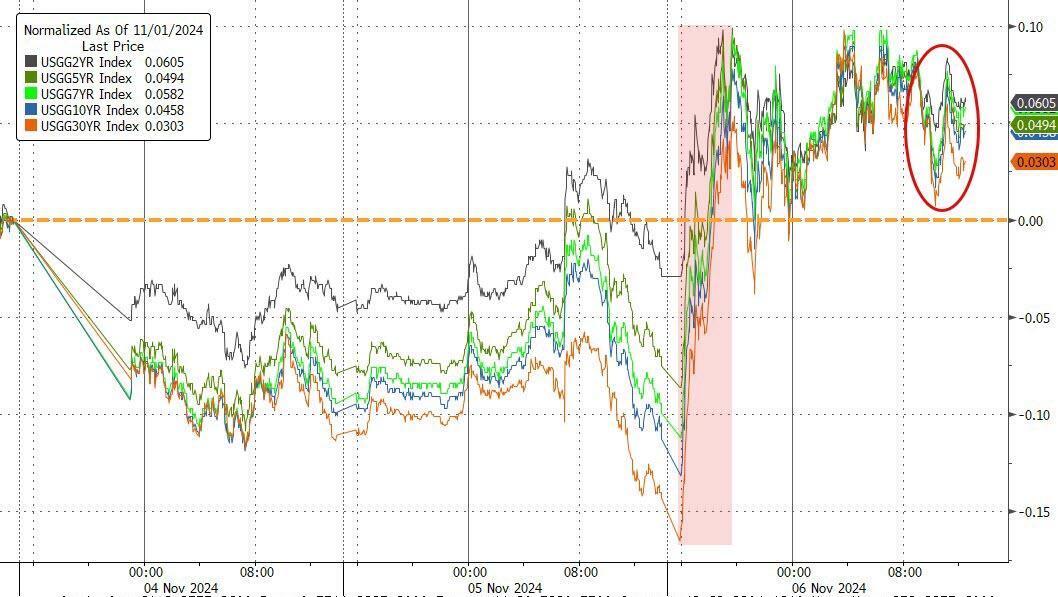
The futures markets are indicating a potential increase in 10-year bond yields, which could put some pressure on the bullish sentiment when the markets open tomorrow.
Read More
