Aggressive Option Buying Saves Stocks, Gold Rallies As Dollar Weakens

Ulli Market Commentary Contact

[Chart courtesy of MarketWatch.com]

  1. Moving the market

The major indexes remained relatively unchanged in early trading, ahead of this week’s announcements of big tech earnings and economic data, as well as the latest developments in the trade saga.

There is still no clarity on any potential agreement with China, although Treasury Secretary Bessent noted progress on other proposals, suggesting that a deal with India might be “one of the first” to come.

The tug-of-war continues, with Trump stating last week that discussions with China were underway, which was vehemently denied by Chinese officials.

We are now approaching the busiest period of the first-quarter earnings season, during which more than 180 S&P 500 companies will release their reports.

April has been a volatile month for the indexes. The S&P 500 briefly entered bear market territory on April 7 but has since made a recovery. However, the index has yet to break through key resistance levels, leading some technical analysts to speculate that we might reverse and test the lows again.

This is a real possibility, as markets typically experience a lot of back-and-forth and testing of resistance levels—both on the downside and the upside—before stabilizing.

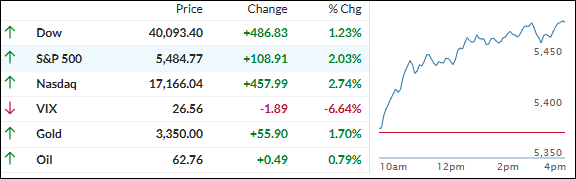
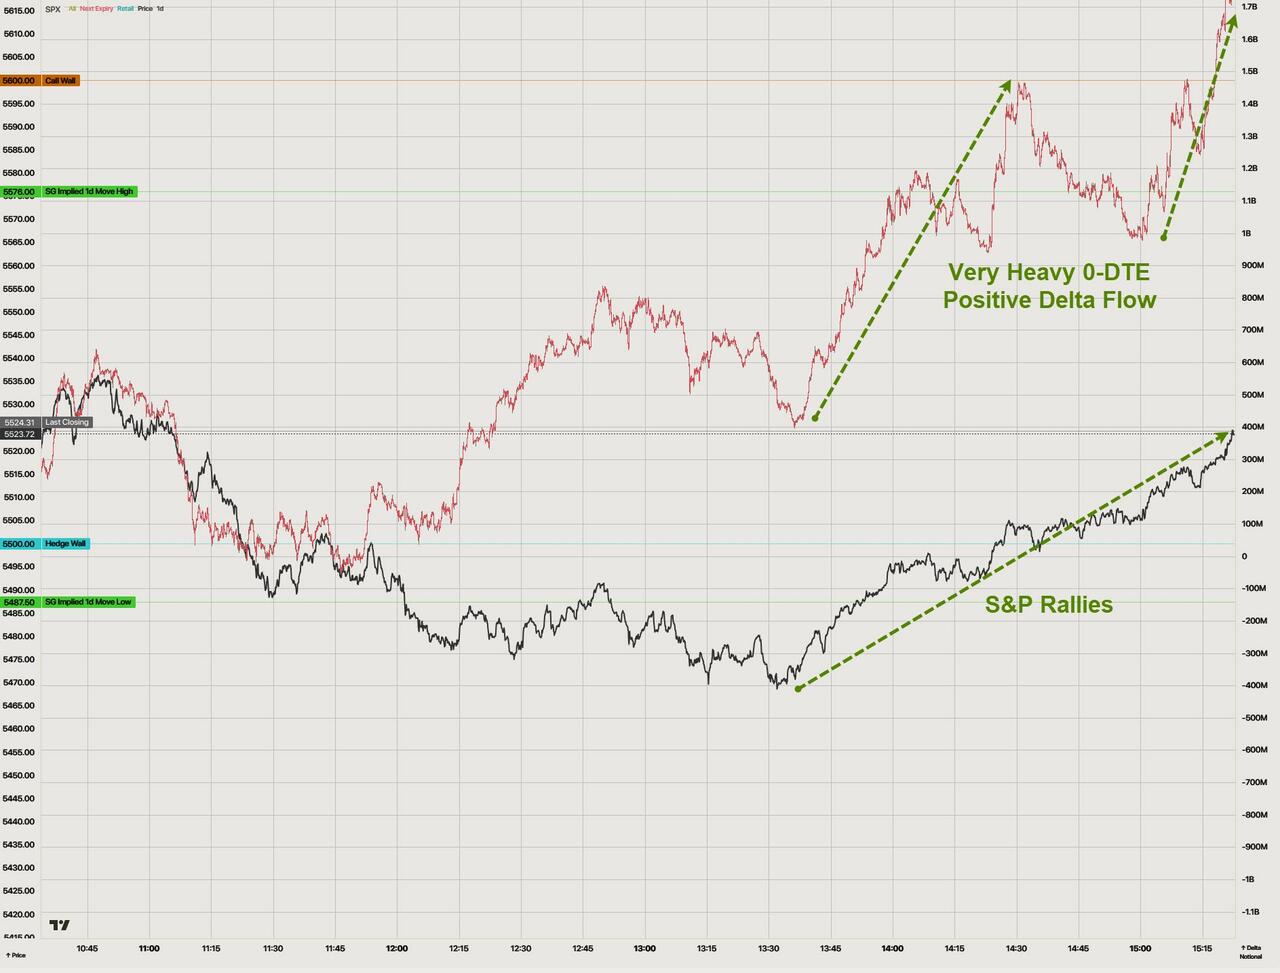
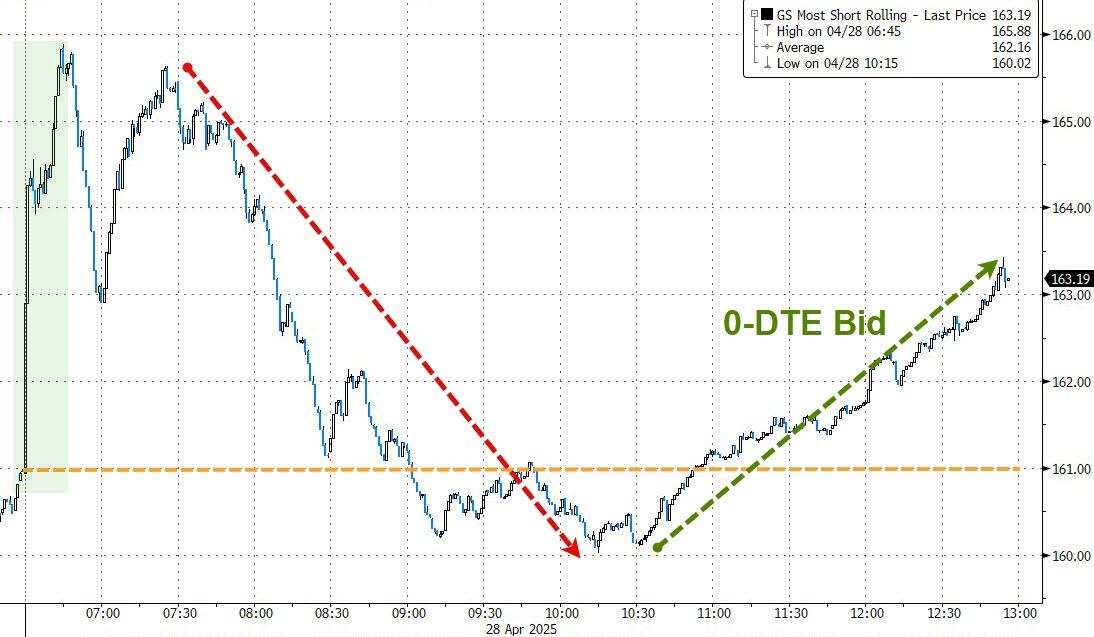
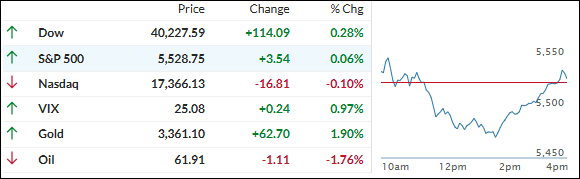
Today, stocks were saved by aggressive option buying in the last hour, which pulled the S&P 500 to a green close, although the Nasdaq did not follow suit.

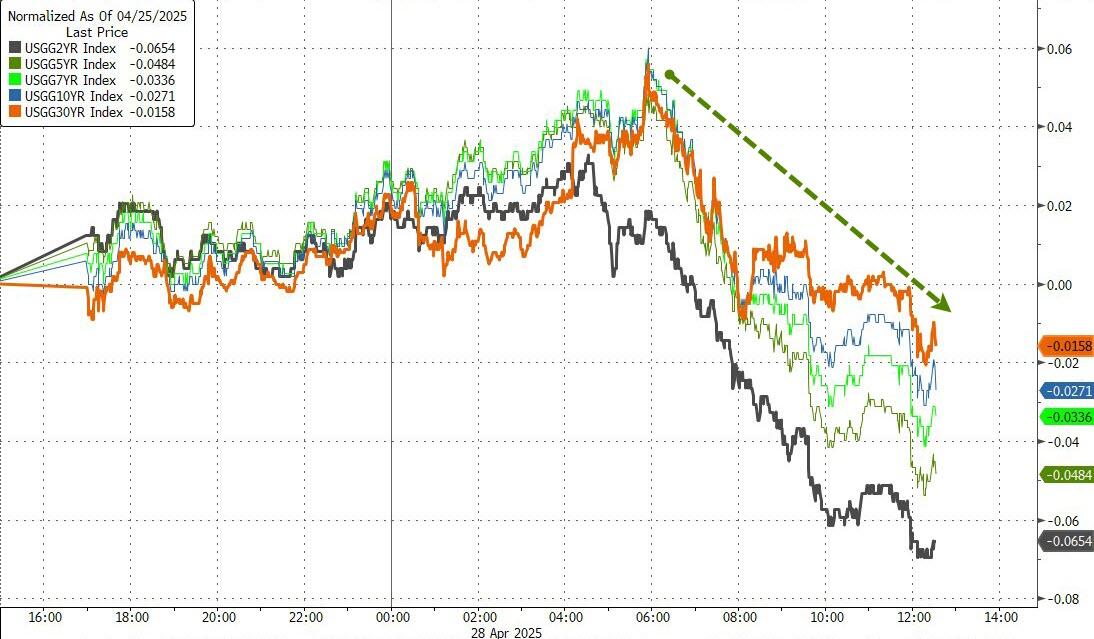
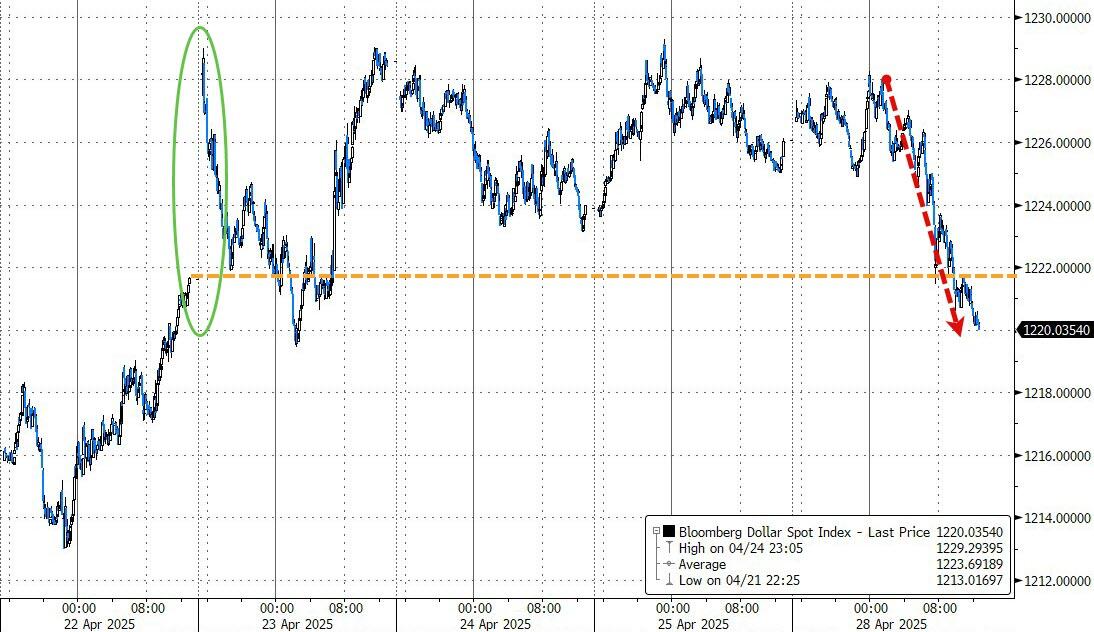
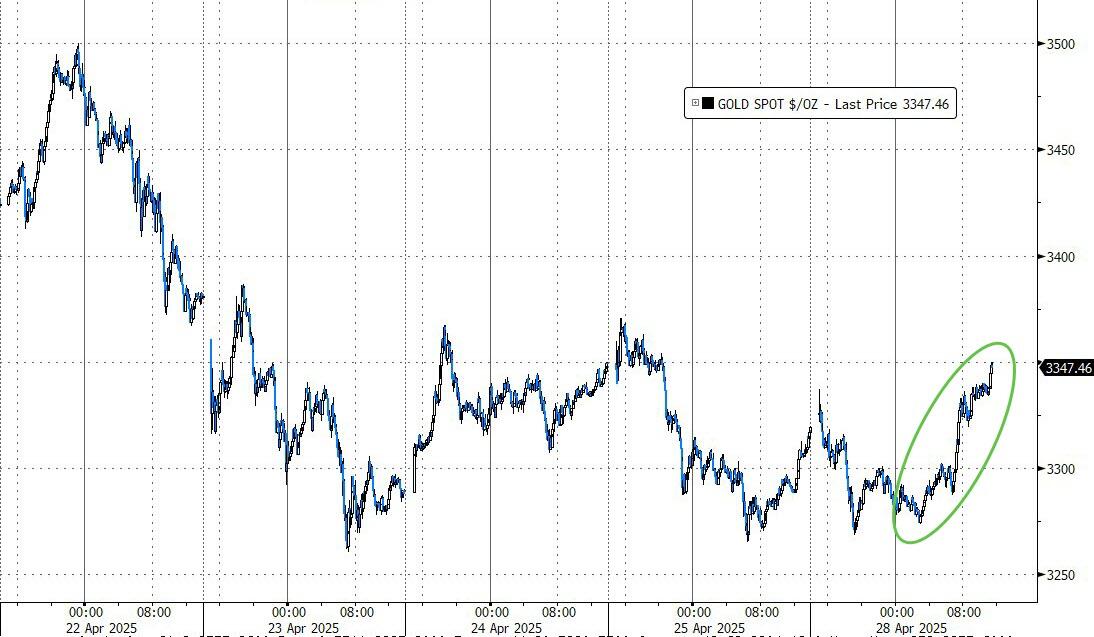
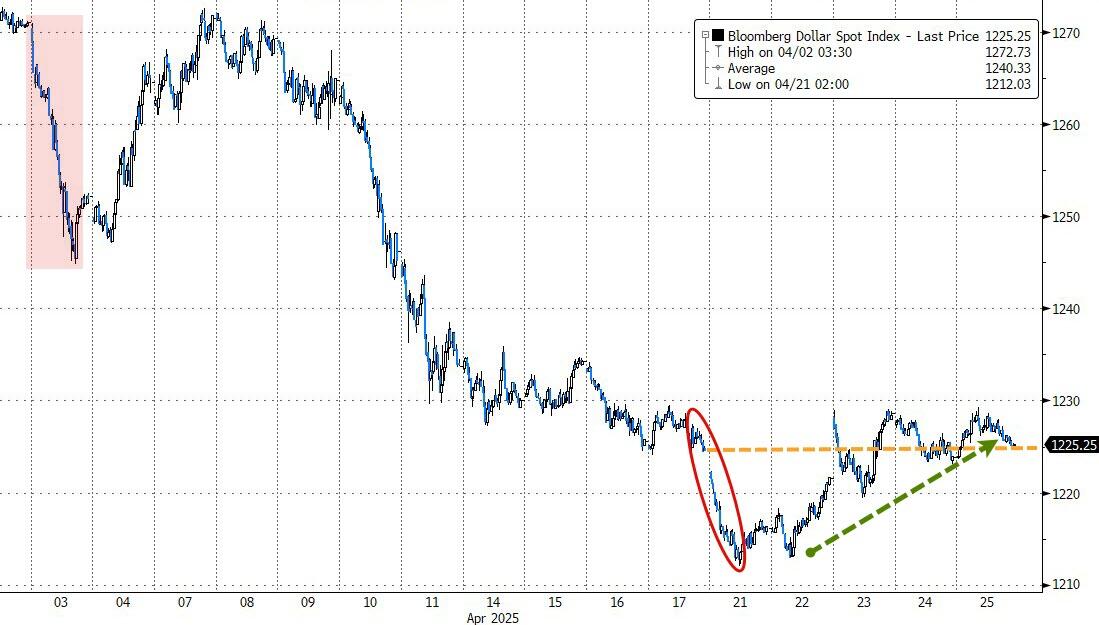
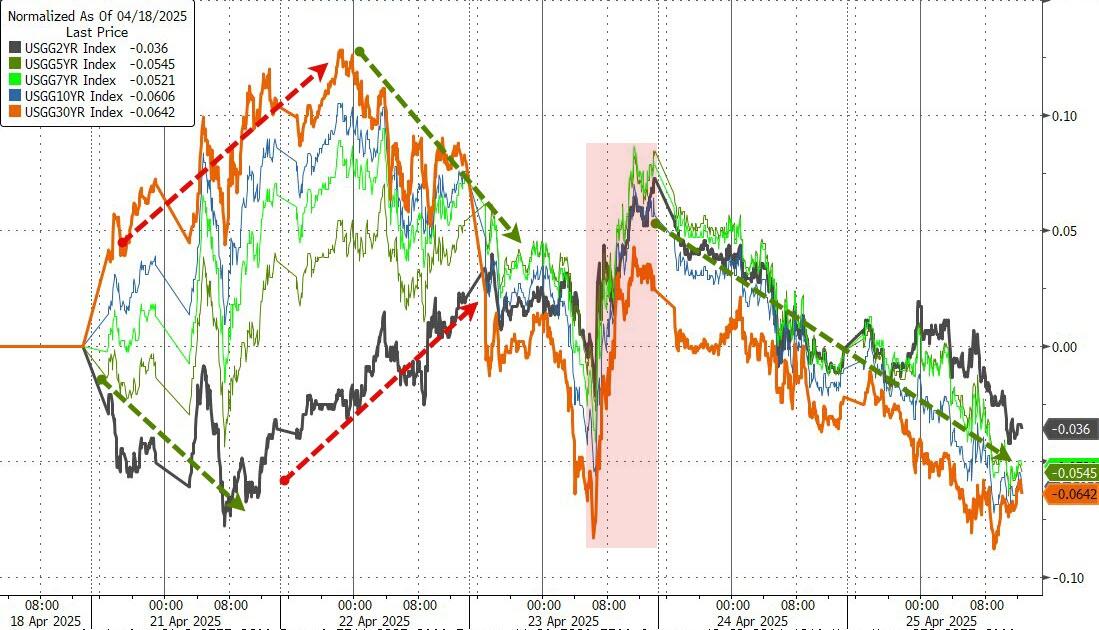
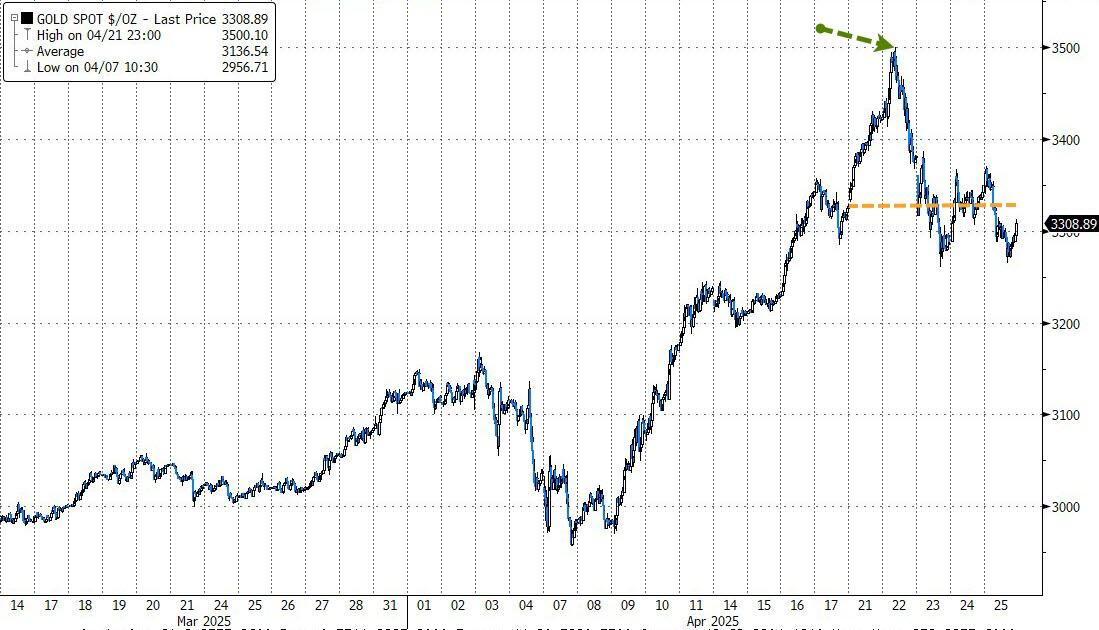
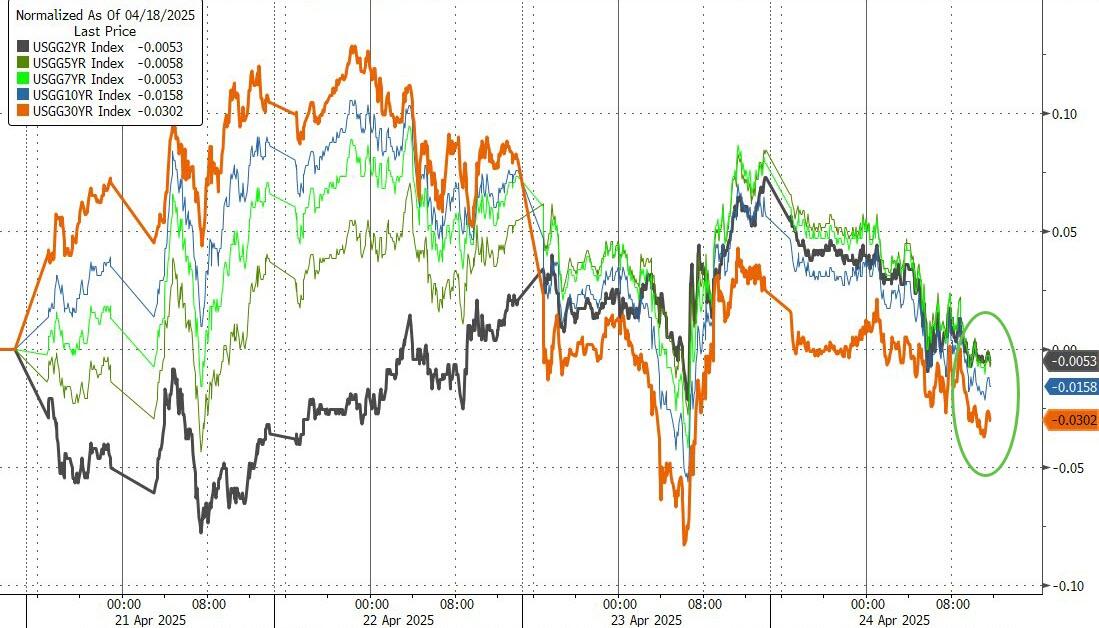
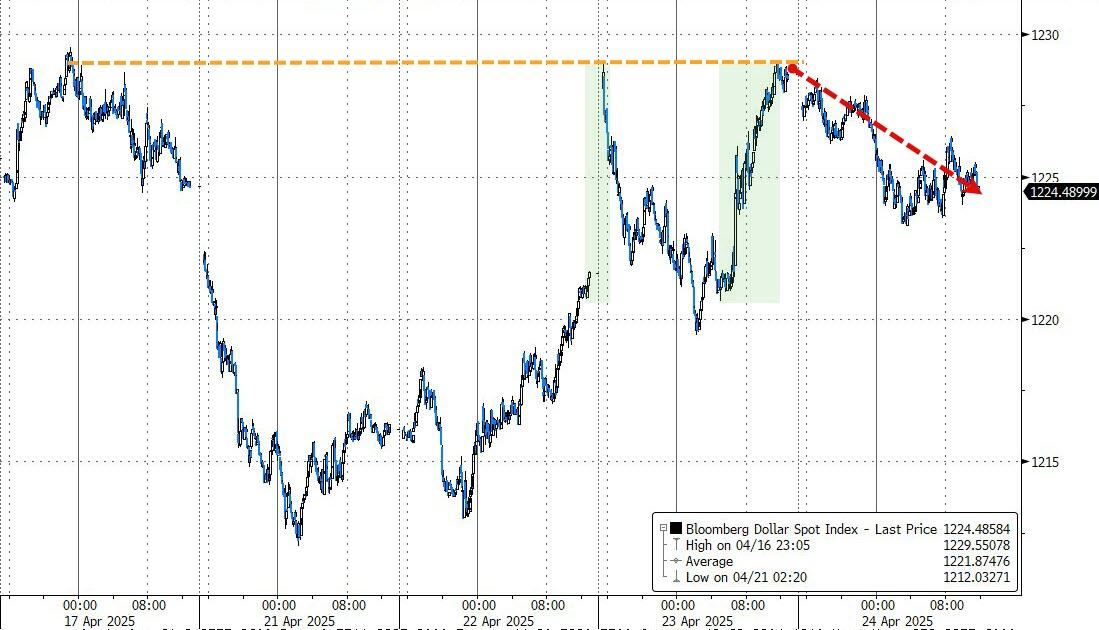
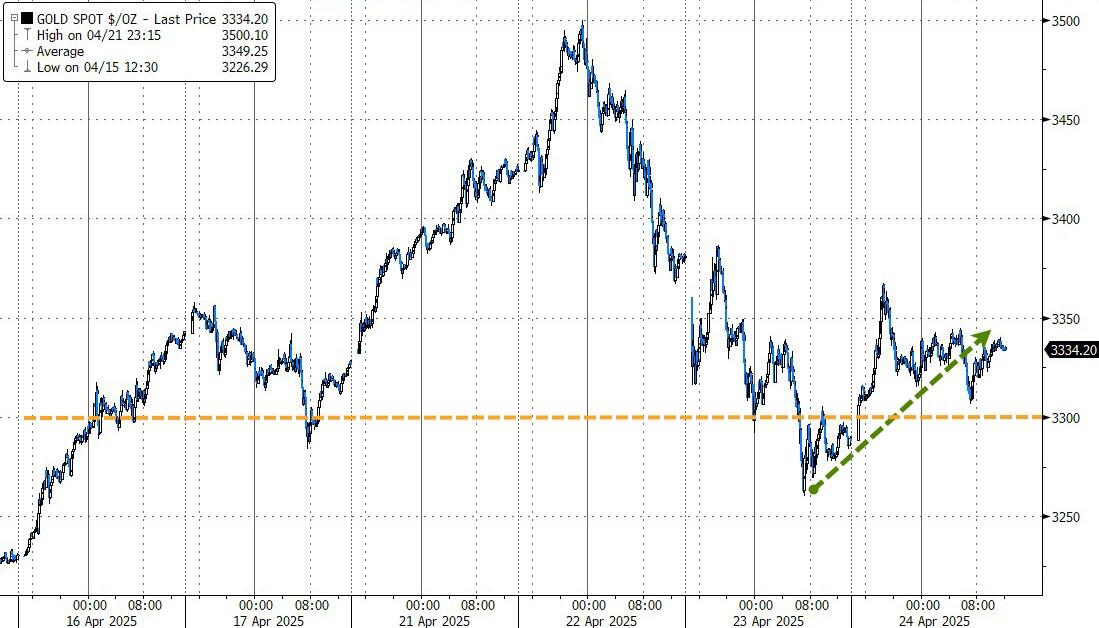
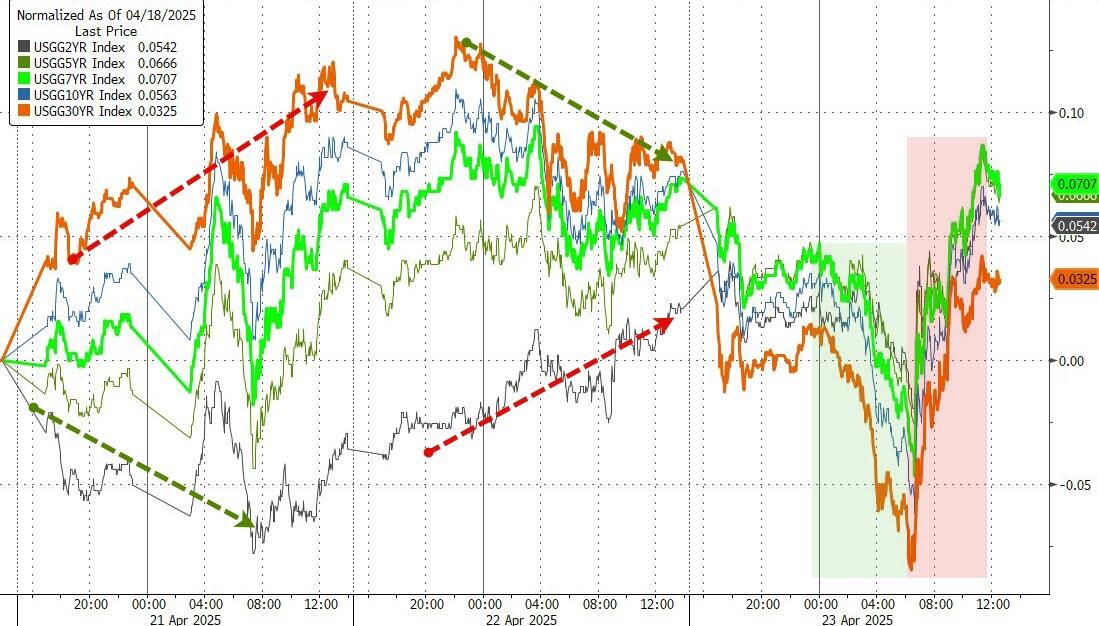
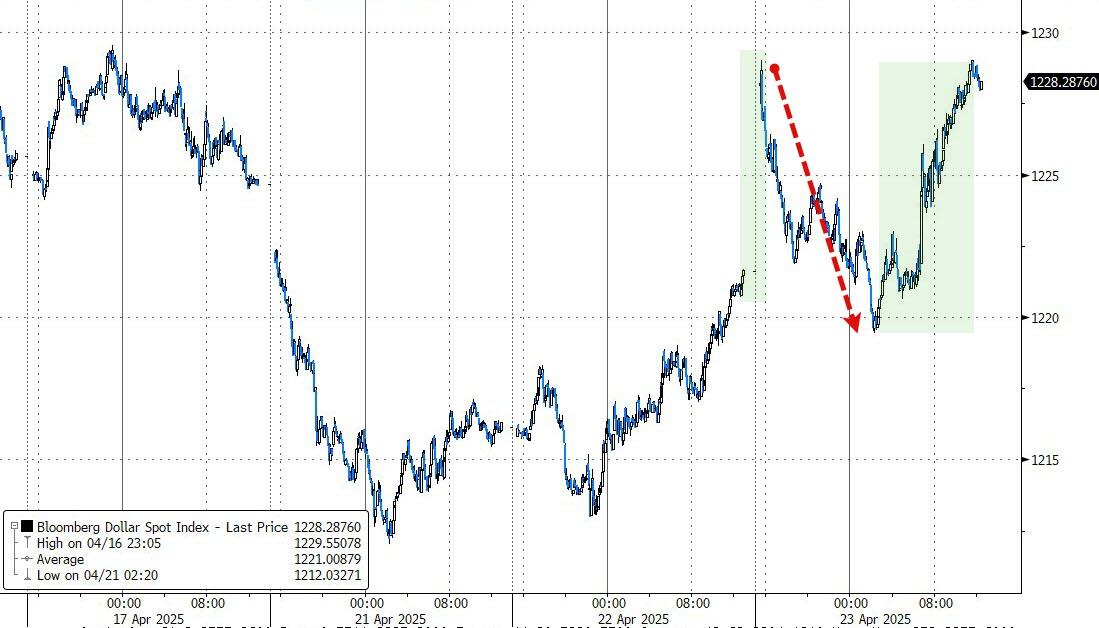
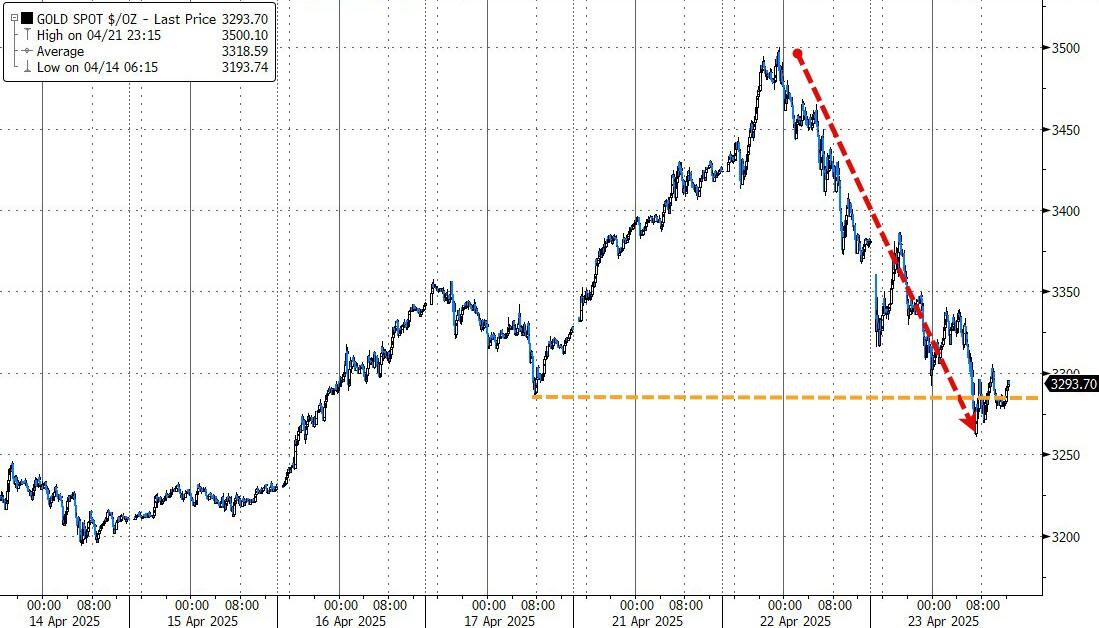
Most shorted stocks were squeezed, and bond yields retreated, providing further support. The dollar took a beating, which gave gold a reason to rally strongly, with the precious metal reaching $3,360 again.

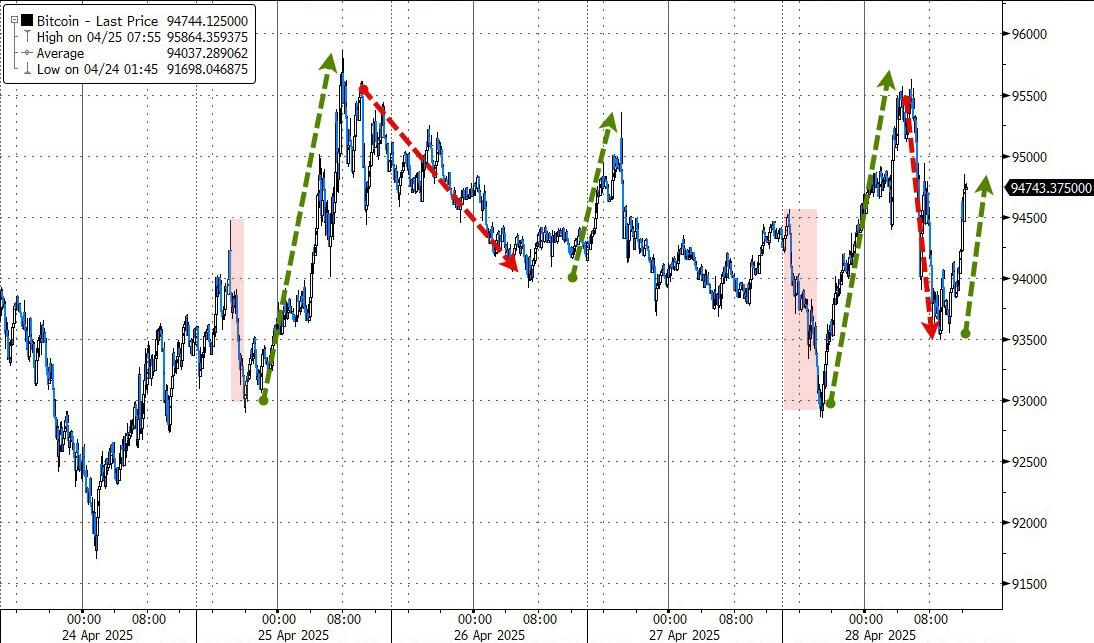
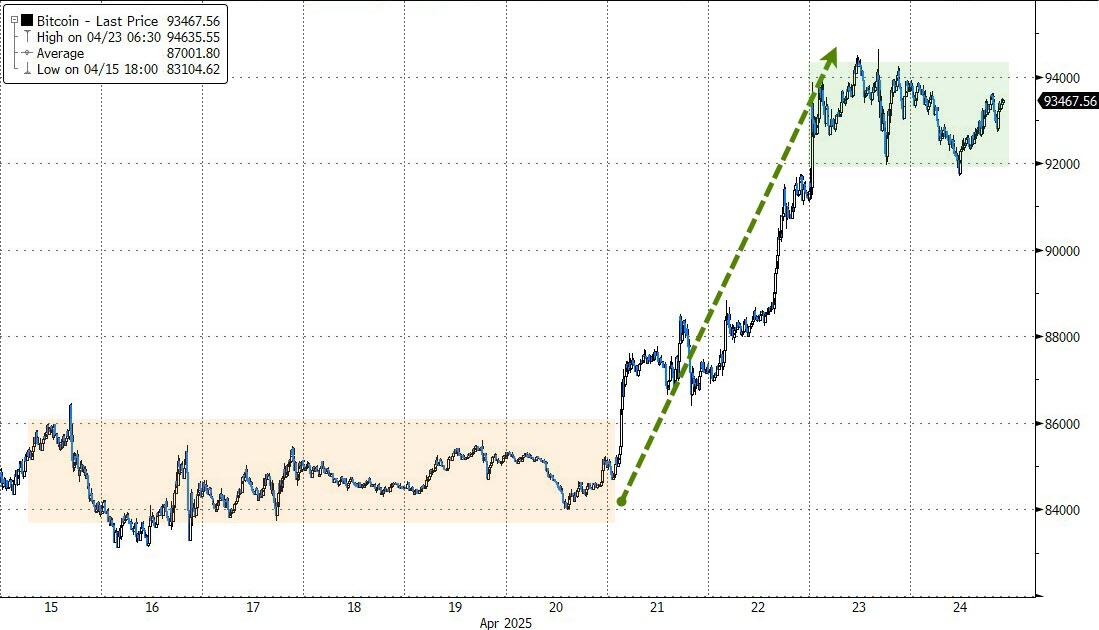
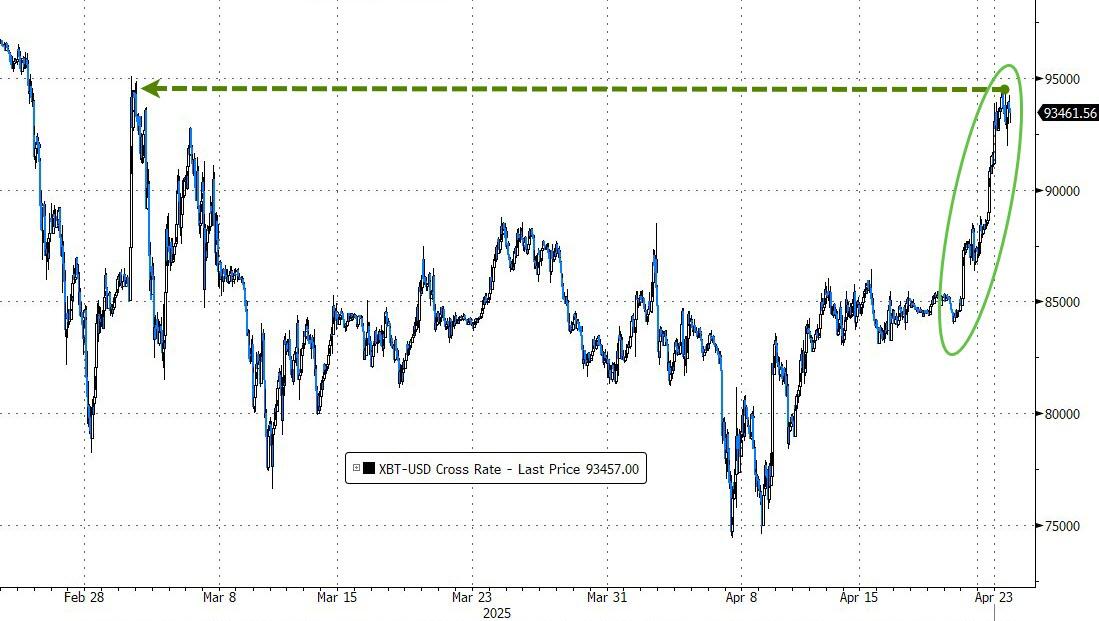
Bitcoin touched $95.5k in overnight trading, swung wildly during the day session, but ultimately lost a fraction.

While the S&P 500 is still down for April, it is within striking distance of wiping out that deficit before the month ends.

Read More
ETFs On The Cutline – Updated Through 04/25/2025

Ulli ETFs on the Cutline Contact

Do you want to know which ETFs are hot and which ones are not? Then you need my High-Volume ETF Cutline report. It tells you how close or far each of the 311 ETFs I follow is from its long-term trend line (39-week SMA). These are the ETFs that trade more than $5 million a day, so they are not some obscure funds that nobody cares about.

The report is split into two parts: The winners that are above their trend line (%M/A), and the losers that are below it. The yellow line is the line of shame that separates them. You can see how many ETFs are in each group and how they have changed since the last report (48 vs. 108 current).

Take a peek:

The HV ETF Master Cutline Report

If you are confused by some of the terms we use, don’t panic. I have a helpful Glossary of Terms for you.

If you want to learn more about the Cutline method and how it can make you rich (or at least less poor), read my original post here.

ETF Tracker Newsletter For April 25, 2025

Ulli Market Commentary Contact

ETF Tracker StatSheet          

You can view the latest version here.

STOCKS AND BONDS SHOW STRONG WEEKLY PERFORMANCE DESPITE CHOPPY SESSION

[Chart courtesy of MarketWatch.com]

  1. Moving the market

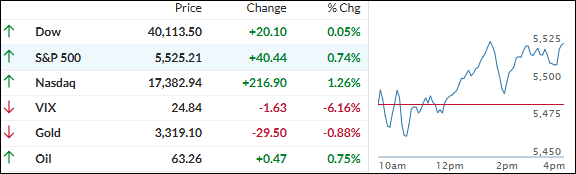
Equities initially slipped but later recovered as traders weighed mixed earnings from major tech companies and the latest developments in the trade war.

Google parent Alphabet, part of the Mag7 stock basket, exceeded first-quarter earnings expectations, causing its stock to jump 2%. In contrast, Intel fell 7% after issuing disappointing guidance.

Bullish sentiment was further impacted by Trump’s comments in Time magazine, where he stated that he would consider it a “total victory” if the U.S. had high tariffs of 20% to 50% on foreign countries a year from now.

He also announced that many trade deals would be finalized in the next three to four weeks. However, there were no updates on China, which revealed that there were no ongoing discussions on tariffs, dampening market enthusiasm.

ZH described today’s session as choppy, range-bound, and quiet. Despite this, stocks and bonds showed strong performance for the week.

The dollar managed modest gains after two weeks of decline. Bond yields were lower this week, and gold experienced only its third down week of the year after reaching the $3,500 level, a pullback that was expected.

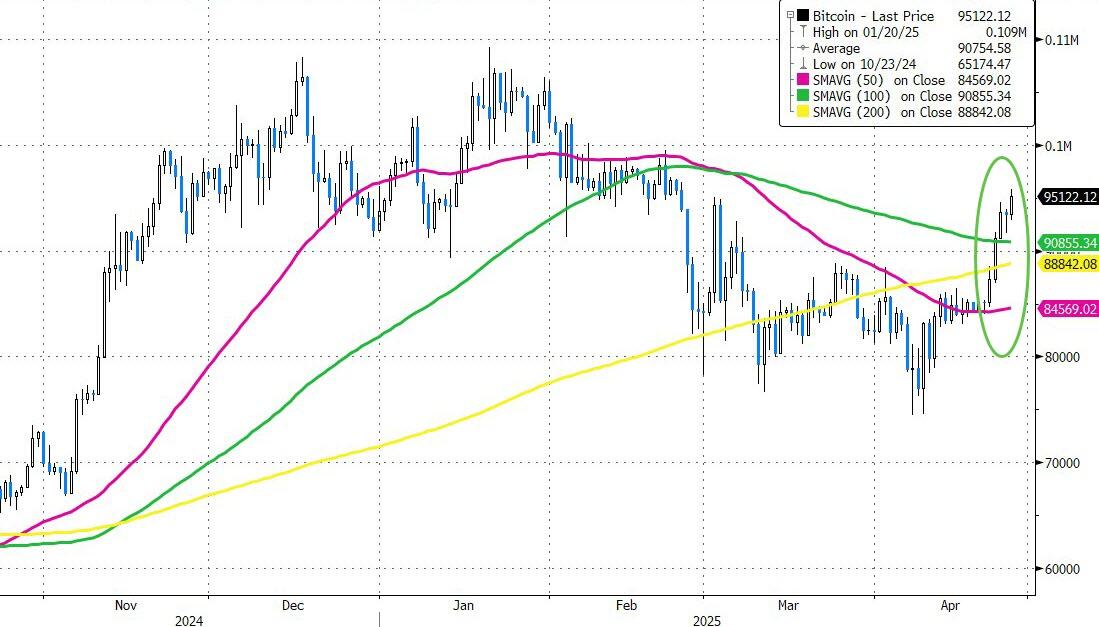
Bitcoin had a great week, touching $95,000 for the first time since February and breaking above key technical levels.

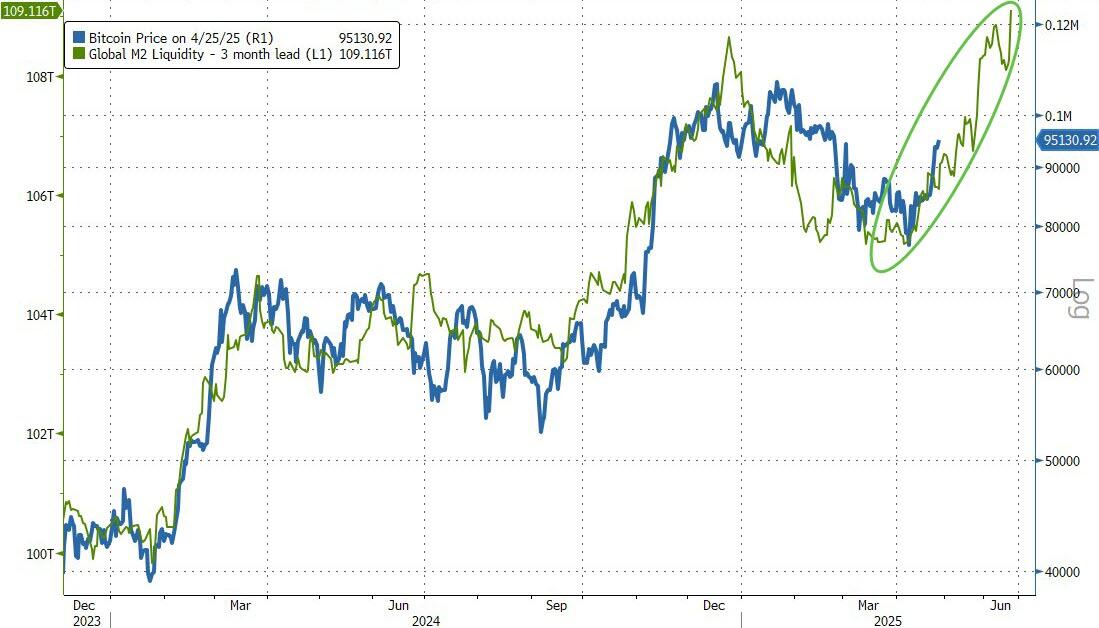
As I have repeatedly pointed out, Bitcoin appears to be in a bull run following global liquidity with a three-month lag.

Will it catch up with gold’s year-to-date performance?

Read More

Weekly StatSheet For The ETF Tracker Newsletter – Updated Through 04/24/2025

Ulli ETF StatSheet Contact

ETF Data updated through Thursday, April 24, 2025

How to use this StatSheet:

  1. Out of the 1,800+ ETFs out there, I only pick the ones that trade over $5 million per day (HV ETFs), so you don’t get stuck with a lemon that nobody wants to buy or sell.
  1. Trend Tracking Indexes (TTIs)

These are the main indicators that tell you when to buy or sell Domestic and International ETFs (section 1 and 2). They do that by comparing their position to their long-term M/A (Moving Average). If they cross above, and stay there, it’s a green light to buy. If they fall below, and keep going, it’s a red light to sell. And to make sure you don’t lose your shirt if things go south, I also use a 12% trailing stop loss on all positions in these categories.

  1. All other investment areas don’t have a TTI and should be traded based on the position of each ETF relative to its own trend line (%M/A). That’s why I call them “Selective Buy.” In other words, if an ETF goes above its own trend line, you can buy it. But don’t forget to use a trailing sell stop of 12%, or less if you’re feeling nervous.

If some of these words sound like Greek to you, please check out the Glossary of Terms and new subscriber information in section 9.

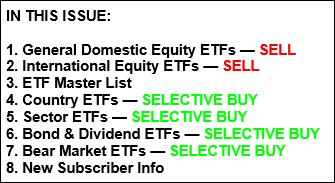
  1. DOMESTIC EQUITY ETFs: SELL— effective 4/4/2025

Click on chart to enlarge

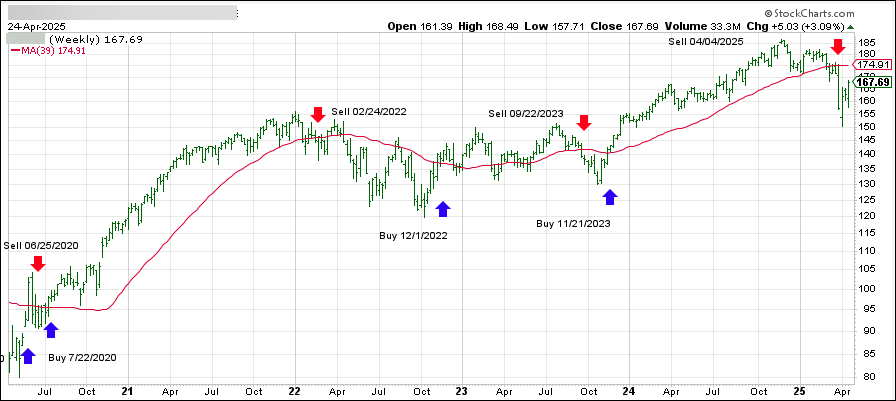
This is our main compass, the Domestic Trend Tracking Index (TTI-green line in the above chart). It has broken below its long-term trend line (red) by -4.13% and has moved into “Sell” mode as of 4/4/2025.

Read More

China Dismisses Trade Talk Progress, Markets Remain Optimistic

Ulli Market Commentary Contact

[Chart courtesy of MarketWatch.com]

  1. Moving the market

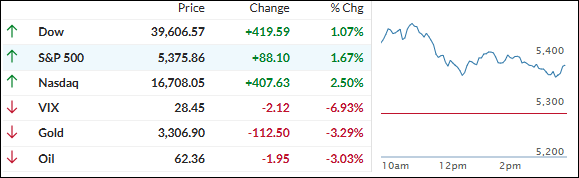
The tech sector led the ongoing rebound, as traders sought signs of progress in the heated tariff situation.

Despite China’s overnight announcement that no trade talks were happening with the U.S., they confirmed that all statements about progress on bilateral talks should be dismissed and that the cancellation of unilateral tariffs is forthcoming.

Wall Street traders found Trump’s less confrontational approach toward talks with Beijing more convincing, which fueled bullish sentiment for the third consecutive day.

While the markets are hoping for a reversal of tariffs or significant trade deals, we are still in correction territory. It remains to be seen whether the current optimism will push both indexes back onto a bullish path.

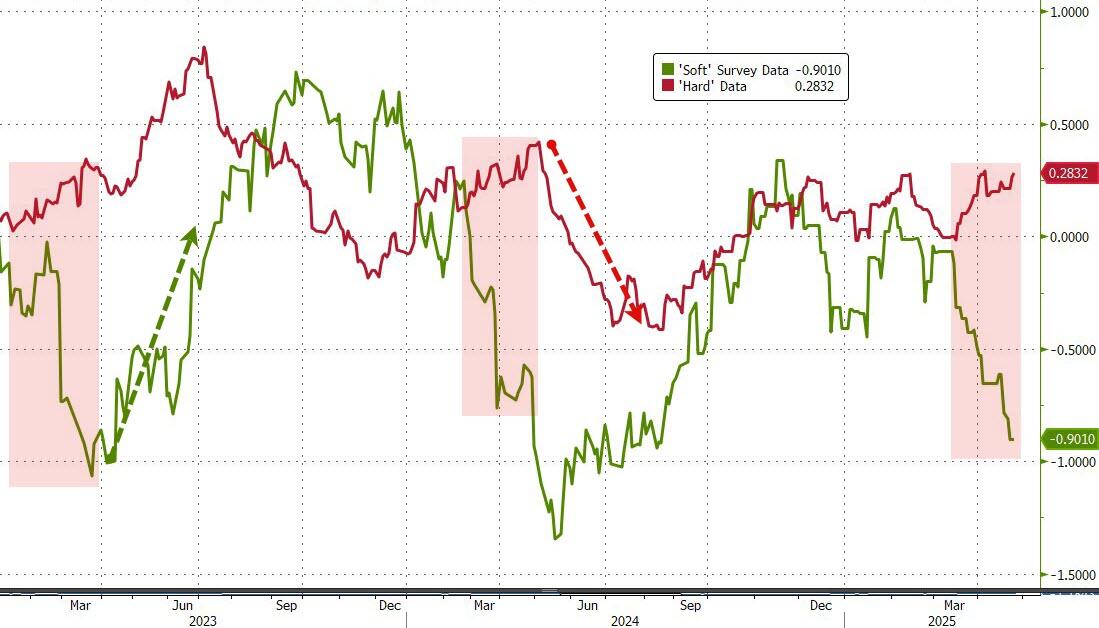
Recent economic “hard” data has crushed the “recession is imminent” narrative, although “soft” data remains weak, as illustrated by this chart.

Despite the headline fluctuations, the markets advanced steadily without any significant intraday selloff.

Bond yields dropped, the dollar retreated from yesterday’s highs, which helped gold rebound from its recent pullback, while Bitcoin maintained its gains.

Can the markets close out this week with another win tomorrow?

Read More

Relief Rally: Markets Surge On Trump’s Easing Of Fed And Tariff Concerns

Ulli Market Commentary Contact

[Chart courtesy of MarketWatch.com]

  1. Moving the market

The markets received a significant boost this morning from Trump, who softened his stance on Fed Chair Powell and China tariffs—two topics that had recently caused market turmoil.

First, he indicated that he does not plan to remove Powell from his position as Central Bank leader. Second, he expressed a willingness to adopt a less confrontational approach to negotiations with China, noting that the current 145% tariff on Chinese imports is “very high” and will be significantly reduced.

This was the signal the markets had been waiting for. Even a hint of easing tensions between the two countries brought relief to Wall Street, as traders and algorithms pushed the “buy” buttons, driving the markets sharply higher.

While this is a positive start, it remains to be seen whether this rebound has enough momentum to pull us out of the current bear market. Right now, it’s simply a relief rally, but is it based on false hope?

The markets ended the session off their highs as the headline ping pong continued, dampening the early euphoric reaction. None of today’s events were “new” news; it was merely a reiteration.

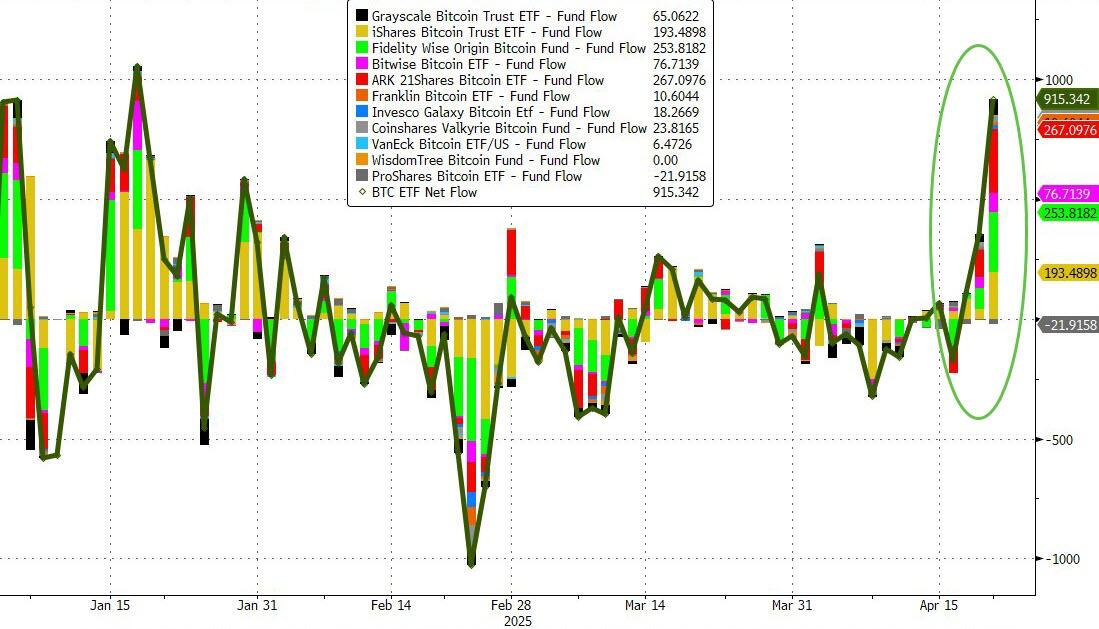
Bitcoin ETFs saw a massive inflow yesterday, propelling the cryptocurrency over $94k, its highest level since March.

Bond yields fluctuated wildly, first dropping, and then rising, yet rate-cut expectations fell. The dollar swung dramatically, while gold continued to slip but found support around the $3,300 level.

Uncertainty reigns supreme as the markets remain volatile, with no clear long-term trend direction in sight.

Read More