Volatility Remains But Markets Snap Back

Ulli Market Commentary Contact

Tue pic

[Chart courtesy of MarketWatch.com]

1. Moving The Markets

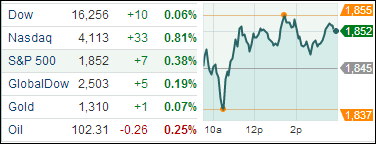
U.S. stocks rose today, snapping a three-day losing streak as investors smiled upon social media and tech shares. Being its volatile self, the S&P is now back in positive territory for the year. Tuesday’s advance followed the S&P 500’s biggest three-day retreat since late January and the Nasdaq’s steepest three-day drop since November 2011. Notable gainers that bounced back from sell-offs over the past couple of days included Amazon.com Inc, (AMZN) up 2.9%; Yahoo Inc, (YHOO) up 2.3% at; and LinkedIn (LKND), up 5.9%

Financial stocks were back in the spotlight today as we received word that regulators finalized the rule to limit banks’ reliance on debt. Under the new rule, the eight biggest U.S. banks must raise a total of about $68 billion in capital by 2018 to comply with a new rule designed to prevent another financial crisis. The rules would apply to JPMorgan Chase, Citigroup, Bank of America, Wells Fargo, Goldman Sachs, Morgan Stanley, BNY Mellon and State Street .

In the international realm, European markets fell as tensions flared again in Ukraine. Russia’s Foreign Ministry warned Kiev on Tuesday that use of force in the eastern region could lead to civil war. Asian markets were mixed Tuesday. Tokyo’s Nikkei fell 1.4% as the central bank ended a policy meeting without any hint of further economic stimulus.

Our 10 ETFs in the Spotlight recovered with one of them making a new high while 9 of them are still positive YTD.

Read More

Equities Selloff Continues…

Ulli Market Commentary Contact

Mon pic

[Chart courtesy of MarketWatch.com]

1. Moving The Markets

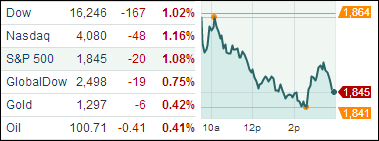
Today officially marks the first day that all three major indexes (S&P, Dow and Nasdaq) are negative year to date. The Nasdaq continued its decline (which began last Thursday) and is now down a combined 4.6% over the three day period. The S&P 500 and Dow Jones both finished down more than 1% each today as well. The buzz is that the recent losses relate to investors rotating out of growth stocks, especially in the tech sector, and reinvesting into value stocks.

Following suit, Internet stocks were among the day’s biggest decliners with Amazon.com (AMZN) down 1.6% and Yahoo! Inc (YHOO) off 3.5%. The Global X Social Media ETF (SOCL.) which includes Groupon Inc (GRPN) and LinkedIn (LNKD) fell 2.5%.

While the recent three day selloff may startle some, overall market sentiment remains positive moving forward. With the big gains that many investors have realized since the beginning of the year, it is not uncommon for a market correction such as this to take place. Volatility has always been on the plate thus far in 2014 though, so do not be surprised to see it continue moving forward. However, this is the time to make sure you have your sell stops in place should this pullback accelerate and turn into an outright bear market. As always, our Trend Tracking Indexes (TTIs), see section 3 below, will be our guide.

Our 10 ETFs in the Spotlight headed south as well but none of them has broken their individual long term trend line to the downside yet; 9 of them are still in the green YTD. Take a look:

Read More

ETFs/Mutual Funds On The Cutline – Updated Through 04/04/2014

Ulli ETFs on the Cutline Contact

Below are the latest ETF Cutline reports, which show how far above or below their respective long-term trend lines (39 week SMA) my currently tracked ETFs/MFs are positioned.

The first report covers the ETF Master List from Thursday’s StatSheet and includes 398 ETFs, of which currently 367 (last week 364) are hovering in bullish territory.

The second report includes only High Volume ETFs. To clarify, High Volume (HV) ETFs are defined as those with an average daily volume of $10 million or higher.

These ETFs are generated from my selected list of some 97 that I use in my advisor practice. It cuts out the “noise,” which simply means it eliminates those ETFs that I would never buy because of their volume limitations. 81 ETFs (last week 75) have managed to remain in bullish territory after the recent market volatility.

The third report covers Mutual Funds on the Cutline. There are currently 695 (last week 696) above the line and 154 below it out of the 859 that I follow.

Take a look:

1. ETF Master Cutline Report     

2. ETF High Volume Cutline Report

3. MF Cutline Report

In case you are not familiar with some of the terminology used in the reports, please read the Glossary of Terms.

If you missed the original post about the Cutline approach, you can read it here.

One Man’s Opinion: Is The Weak Labor Market Weighing On Inflation?

Ulli Market Review Contact

92835431The March US nonfarm payrolls number was slightly disappointing as economists had forecast a higher reading although revised estimates for February came in better than expected.

However, Randall Kroszner, a professor of economics at the Chicago University’s Booth School and a former Federal Reserve governor, thinks the latest number is pretty much right on target since the job creation rate has been about 200,000 per month for about the last 12 months. There has been an uptick in the work-week after the tick-down in the previous two months, which indicates things are pretty much on track for the Fed’s forecast, he noted.

Asked if the weak wage growth-rate is a matter of concern since it indicates the hiring rate is yet to pick up, Randy said the economy is creating a reasonable number of jobs though it may not be as strong as the Fed would like to see. However, the decline in nominal and real income growth will keep the wage pressure down, allowing the Fed to keep rates low for longer, he observed.

Read More

New ETFs On The Block: First Trust RBA Quality Income ETF (QINC)

Ulli Income ETFs Contact

105487691The dividend ETF space has managed to generate considerable interest among investors in recent months. Responding to investor demand, issuers have launched a raft of new funds while lining up quite a few more in an attempt to give a new spin to the age old dividend investing strategy.

First Trust, the Il-based leading global issuer of exchange-traded funds, is the newest entrant to the high-yield dividend ETF fray. The First Trust RBA Quality Income ETF (QINC) tracks the Richard Bernstein Advisors Quality Income Index, giving investors exposure to income producing stocks. The underlying equity index has been developed by Richard Bernstein Advisors, an independent advisory founded by former Merrill Lynch Chief Investment Strategist Richard Bernstein.

The index aims to maintain attractive current income while controlling risks associated with investing in higher-yielding equities. RBA believes high dividend-yield stocks should be viewed with caution as lower stock prices may simply reflect investor anticipation of impending dividend cuts or omissions. The risks associated with high-dividend stocks are simply higher since they may lead to selection of stocks whose dividends are either discontinued or reduced going forward.

Read More

04-04-2014

Ulli Newsletter Archives Contact

ETF/No Load Fund Tracker Newsletter For April 4, 2014

ETF/No Load Fund Tracker StatSheet

————————————————————-

THE LINK TO OUR CURRENT ETF/MUTUAL FUND STATSHEET IS:

https://theetfbully.com/2014/04/weekly-statsheet-for-the-etfno-load-fund-tracker-newsletter-updated-through-04032014/

————————————————————

Market Commentary

Friday, April 4, 2014

STOCKS POSITIVE OVERALL FOR THE WEEK ON OPTIMISTIC U.S. ECONOMIC DATA
Fri pic

[Chart courtesy of MarketWatch.com]

1. Moving The Markets

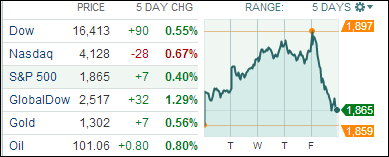
Stocks rose as a suite of economic data raised optimism about the health of the economy.  Headlining the focus was the March employment report, which showed job growth of 192,000 for the month.  Combined with upward revisions to hiring in January and February, and an increase in the average hours worked, labor market trends are consistent with other indicators that signal the economy is regaining its footing after a volatile first quarter.  The end of March marked the fifth consecutive quarterly advance for the stock market, with the S&P 500 delivering a total return of 1.8% in the first three months of the year.

Elsewhere, the largest S&P 500 sector, technology, proved to be a significant drag on the major averages amid weakness in large names. Apple (AAPL) Google (GOOG), Microsoft (MSFT), and Visa (V) lost between 1.3% and 4.7% with Google seeing the largest decline of the bunch. Smaller momentum names registered even larger losses with FireEye (FEYE), Splunk (SPLK), and Yelp (YELP) down between 5.6% and 8.2%. The three names extended their weekly losses to 20.7%, 12.0%, and 14.1%, respectively.

On the upside, utilities (+0.6%) posted a solid gain with lower yields giving a boost to the rate-sensitive sector.

Gold rose the most in three weeks. Gold has rebounded this year after plunging almost 30% last year as the dollar appreciated and the U.S. economy showed signs of strengthening without inflation. In energy trading, the price of oil rose 85 cents, or 0.8%, to $101.14 a barrel.

Our 10 ETFs in the Spotlight rode the roller coaster with the indexes but 9 of them are remaining on the plus side YTD.

2. ETFs in the Spotlight

In case you missed the announcement and description of this section, you can read it here again.

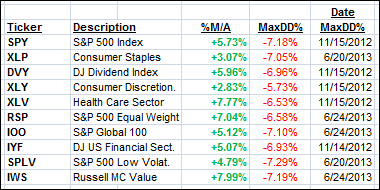
It features 10 broadly diversified ETFs from my HighVolume list as posted every Monday. Furthermore, they are screened for the lowest MaxDD% number meaning they have been showing better resistance to temporary sell offs than all others over the past year.

In other words, none of them ever triggered their 7.5% sell stop level during this time period, which included a variety of severe market pullbacks but no move into outright bear market territory.

Here are the 10 candidates:
MaxDD

All of them are in “buy” mode meaning their prices are above their respective long term trend lines by the percentage indicated (%M/A).

Year to date, here’s how the above candidates have fared so far:
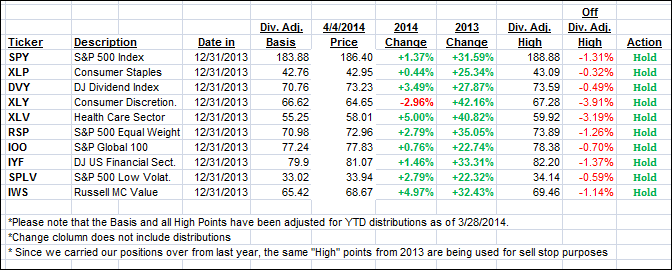
YTD

To be clear, the first table above shows the position of the various ETFs in relation to their respective long term trend lines (%M/A), while the second one tracks their trailing sell stops in the “Off High” column.

3. Domestic Trend Tracking Indexes (TTIs)

Our Trend Tracking Indexes (TTIs) only changed slightly from last Friday’s close due to today’s sell off, which wiped out most of the gains:

Domestic TTI: +2.31% (last Friday +2.48%)

International TTI: +3.74% (last Friday +3.37%)

Have a great week.

Ulli…

Disclosure: I am obliged to inform you that I, as well as advisory clients of mine, own some of these listed ETFs. Furthermore, they do not represent a specific investment recommendation for you, they merely show which ETFs from the universe I track are falling within the guidelines specified.

————————————————————-

READER Q & A FOR THE WEEK

All Reader Q & A’s are listed at our web site!
Check it out at:

http://www.successful-investment.com/q&a.php

A note from reader Ken:

Q: Ulli: I follow you via Twitter and noticed that you publish Friday’s newsletter edition around 4 pm PST. About an hour later you publish an update, but I can’t seem to figure out what has been updated. Could you explain?

A: Ken: Sure, when I publish the newsletter, I don’t have all weekending values available by 4 pm. The update I post later in the day makes a correction to the Trend Tracking Indexes (TTIs) when the weekly moving averages are being adjusted. These data points become available later on, hence the update.

———————————————————-

WOULD YOU LIKE TO HAVE YOUR INVESTMENTS PROFESSIONALLY MANAGED?

Do you have the time to follow our investment plans yourself? If you are a busy professional who would like to have his portfolio managed using our methodology, please contact me directly or get more details at:

https://theetfbully.com/personal-investment-management/

———————————————————

Back issues of the ETF/No Load Fund Tracker are available on the web at:

https://theetfbully.com/newsletter-archives/