ETF/No Load Fund Tracker Newsletter For Friday, January 31, 2014
ETF/No Load Fund Tracker StatSheet
————————————————————-
THE LINK TO OUR CURRENT ETF/MUTUAL FUND STATSHEET IS:
https://theetfbully.com/2014/01/weekly-statsheet-for-the-etfno-load-fund-tracker-newsletter-updated-through-01302014/
————————————————————
Market Commentary
Friday, January 31, 2014
A BEARISH END TO A NOT SO FRUITFUL MONTH

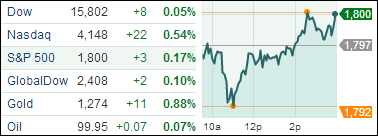
[Chart courtesy of MarketWatch.com]
1. Moving The Markets
This week was filled with ups and downs in the market, as you can see from the above weekly chart. Various corporate earnings reports, as well as strong Q4 2013 growth data, were released this week that entailed an overall bullish sentiment for the U.S. economy. However, worries pertaining to emerging markets trumped the positive sentiment for U.S. Growth, which resulted in losses across the board for the major U.S. indexes this week and for the month of January respectively.
In January, the Dow fell 5.3%, the S&P fell 3.6% and the Nasdaq ended the month down 1.7%. This was the first time that the S&P ended January in the red since 2010.
Global equity markets have been rattled by the outlook for emerging markets, including slower growth in China, while the Federal Reserve’s decision this week to keep withdrawing its monetary stimulus added to worries. Now that the Fed has decided to cut back on its bond purchases, many Investors are selling off their share emerging market investments mainly because they are no longer as attractive.
For those of you living in a winter wonderland of snow over the past month, it has been hard not to notice the bullish performance that natural gas has experienced. Recently, the price of natural gas passed $5.00/mmbtu, up from $3.50/mmbtu three months ago. In Friday’s trading, UNG (which we have no holdings in) surged more than 8%, which is a 52-week high. However, some speculate that there a continued increase is not sustainable and are thus looking to secure gains and sell. It will be interesting to see how Mother Nature treats the U.S. over the next month and subsequently how the natural gas market responds.
Our 10 ETFs in the Spotlight slipped but 9 of them are remaining on the bullish side of their respective trend lines as the table below shows.
2. ETFs in the Spotlight
In case you missed the announcement and description of this section, you can read it here again.
It features 10 broadly diversified ETFs from my HighVolume list as posted every Monday. Furthermore, they are screened for the lowest MaxDD% number meaning they have been showing better resistance to temporary sell offs than all others over the past year.
In other words, none of them ever triggered their 7.5% sell stop level during this time period, which included a variety of severe market pullbacks but no move into outright bear market territory.
Here are the 10 candidates:

All of them, except XLP, are in “buy” mode meaning their prices are above their respective long term trend lines by the percentage indicated (%M/A).
Now let’s look at the MaxDD% column and review the ETF with the lowest drawdown as an example. As you can see, that would be XLY with the lowest MaxDD% number of -5.73%, which occurred on 11/15/2012.
The recent sell off in the month of June did not affect XLY at all as its “worst” MaxDD% of -5.73% still stands since the November 2012 sell off.
A quick glance at the last column showing the date of occurrences confirms that five of these ETFs had their worst drawdown in November 2012, while the other five were affected by the June 2013 swoon, however, none of them dipped below their -7.5% sell stop.
Year to date, here’s how the above candidates have fared so far:

3. Domestic Trend Tracking Indexes (TTIs)
Our Trend Tracking Indexes (TTIs) joined the ups and downs of the past week, but they remain on the bullish side of their respective trend lines:
Domestic TTI: +2.24% (last Friday +2.67%)
International TTI: +3.16% (last Friday +4.34%)
Have a great week.
Ulli…
Disclosure: I am obliged to inform you that I, as well as advisory clients of mine, own some of these listed ETFs. Furthermore, they do not represent a specific investment recommendation for you, they merely show which ETFs from the universe I track are falling within the guidelines specified.
————————————————————-
READER Q & A FOR THE WEEK
All Reader Q & A’s are listed at our web site!
Check it out at:
http://www.successful-investment.com/q&a.php
A note from reader Don:
Q: Ulli:
Is your 39 week moving average really a 195 day moving average? (39 weeks x 5 trading days per week = 195)
A: Don: There is a small difference. With a 39-week M/A, you recalculate the average only every Friday while when using a 195 day M/A, you would recalculate every day. I prefer the former, though in the end it may not make that much difference. Whatever you prefer, you should use.
———————————————————-
WOULD YOU LIKE TO HAVE YOUR INVESTMENTS PROFESSIONALLY MANAGED?
Do you have the time to follow our investment plans yourself? If you are a busy professional who would like to have his portfolio managed using our methodology, please contact me directly or get more details at:
https://theetfbully.com/personal-investment-management/
———————————————————
Back issues of the ETF/No Load Fund Tracker are available on the web at:
https://theetfbully.com/newsletter-archives/