The ETF/No Load Fund Tracker
Monthly Review—February 28, 2014
US Equities Rebound In February; Europe Rallies To A Seven-Month High
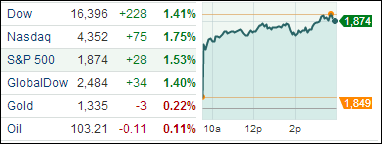
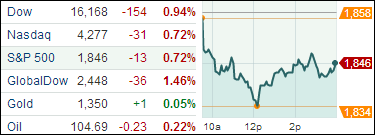
US stocks made a strong comeback in February after starting 2014 on a dismal note with all the major indexes recouping January’s losses and the S&P 500 logging its 48th record monthly close in the past 52.
The blue-chip Dow Jones Industrial Average finished up 4 percent for February. That was the largest monthly percentage gain since January 2013.
The benchmark S&P 500 closed at 1,859, capping its monthly gain at 4.3 percent.
The NASDAQ Composite index ended at 4,308, up five percent for the month. The tech-heavy index notched up its biggest monthly gain since September 2013.
A batch of better-than-expected economic reports lifted US stock markets higher. The final reading of the consumer sentiment index for February was revised upwards to 81.6 from an initial estimate of 81.2, indicating improving confidence.
New home sales jumped 9.6 percent in January to a seasonally-adjusted 468,000 annual pace, the most since July 2008, data released by the Commerce Department showed. Separately, data released by the National Association of Realtors showed pending home sales rose 0.1 percent to 95 in January. The gauge slumped to 94.9 in December, the lowest since November 2011, as poor weather, low inventory and declining affordability hit sales. A reading of 100 is equivalent to the average contract activity seen in 2001.
The Chicago PMI for February rose to 59.8 from 59.6, beating analysts’ estimate of a decline to 56.0.
Economic-data firm Markit’s US flash purchasing managers’ index surged to 56.7 in February from 53.7 in the previous month as production rebounded, indicating increasing traction in manufacturing.
On the downside, the government cut its earlier estimate of US growth in the final months of 2013 as consumers apparently didn’t quite spend as much as originally reported. Fourth quarter gross domestic product grew at a 2.4 percent annual rate instead of the previously reported 3.2 percent.
Markit’s initial reading on services sector for February dropped to 52.7 from January’s final reading of 56.7.
The Philadelphia Fed’s manufacturing index slipped to minus 6.3 in February from 9.4 in January.
Across the Atlantic, European stocks rallied with the Stoxx Europe 600 index notching up a 4.8 percent gain for February. That was best performance by the benchmark index since July.
In terms of growth, Germany continued to race ahead of the pack. Gross domestic product expanded by 0.4 percent in the final quarter of last year.
Unemployment rate across the 18-member currency zone remained unchanged in January at 12 percent, the EU’s statistics office Eurostat said in Brussels.
Inflation in the euro region came in at a 0.8 percent annual pace in January, slightly exceeding an earlier estimate of 0.7 percent. That eased pressure on European Central Bank President Mario Draghi to loosen policies further to stave off deflation.
In last month’s issue, I pointed to the weakness in equities and the possibility of a return to bear market territory. However, with the strong rebound during February, that did not come to pass, and we recovered all of January’s losses.
As our Domestic Trend Tracking Index (TTI) below clearly shows, the pullback in January was followed by a V-type recovery in February with the S&P 500 breaking into record territory:
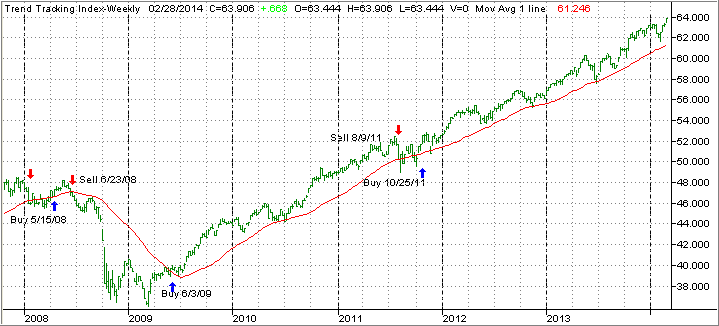
The index itself (green line) now hovers above the trend line (red) by +4.34% (last month +1.15%).
Since we were stopped out of Consumer staples (XLP) and Consumer discretionary (XLY), I replaced these empty spots with more Healthcare (XLV) and some Pharmaceuticals (PJP), while increasing our holdings in the S&P 500 index. That put us on track in joining the upward momentum of the markets to new highs.
Looking back over the past month, here is how our main holdings have fared during this rebound, which started in the second week of February:
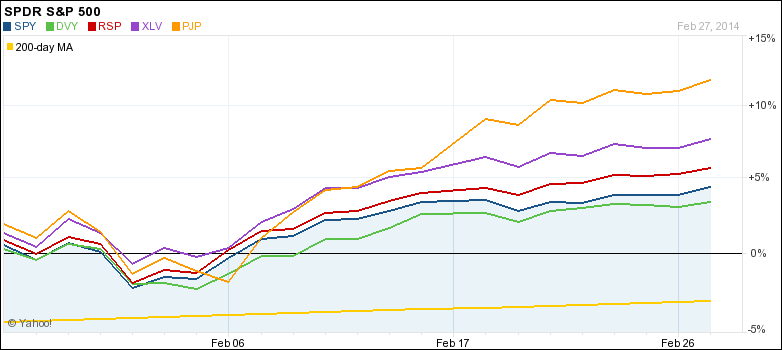
As you can see, Healthcare and Pharmaceuticals especially have been on a tear continuing where they left off in 2013. While January’s market weakness is now in the rearview mirror, we need to remain alert and not fall into complacency by being ready to adjust our portfolios should market conditions change.
Looking at the the big picture, our above Trend Tracking Index (TTI) will alert us to major changes in market direction, while on a day-to-day basis our trailing sell stops will be the guide to determine the level of our equity exposure.