ETF/No Load Fund Tracker Newsletter For May 16, 2014
ETF/No Load Fund Tracker StatSheet
————————————————————-
THE LINK TO OUR CURRENT ETF/MUTUAL FUND STATSHEET IS:
https://theetfbully.com/2014/05/weekly-statsheet-for-the-etfno-load-fund-tracker-newsletter-updated-through-05152014/
————————————————————
Market Commentary
Friday, May 16, 2014
GOING NOWHERE
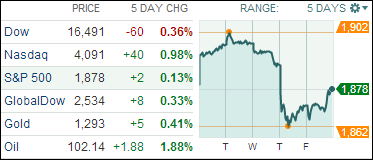
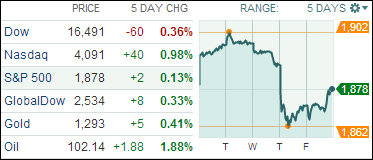
[Chart courtesy of MarketWatch.com]
1. Moving The Markets
This was the week in which the S&P 500 attempted to break through its psychologically important 1,900 milestone marker. We came close on Monday and Tuesday before the bears gained the upper hand on Thursday, as the above 5-day chart shows. Today’s modest rebound, for which we may thank the ever lurking buy-the-dip crowd, left the benchmark index unchanged for the past five trading days.
We’ve seen this before, as sell-off attempts were taken as opportunities for buyers to step in and reverse what appeared to be the start of a downtrend. Fueling this pattern has been a generally positive market outlook.
On the economic front, construction on new US homes surged last month topping economists’ forecasts indicating that the rebound from a tough winter may still have some legs. On the negative side, consumer sentiment fell unexpectedly in April leaving bulls and bears stuck in a tug-of-war.
Our 10 ETFs in the Spotlight followed the roller coaster ride; no new highs were made today and 8 of them remain on the plus side YTD.
2. ETFs in the Spotlight
In case you missed the announcement and description of this section, you can read it here again.
It features 10 broadly diversified ETFs from my HighVolume list as posted every Monday. Furthermore, they are screened for the lowest MaxDD% number meaning they have been showing better resistance to temporary sell offs than all others over the past year.
In other words, none of them ever triggered their 7.5% sell stop level during this time period, which included a variety of severe market pullbacks but no move into outright bear market territory.
Here are the 10 candidates:
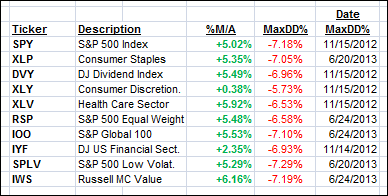
All of them are in “buy” mode, meaning their prices are above their respective long term trend lines by the percentage indicated (%M/A).
Year to date, here’s how the above candidates have fared so far:
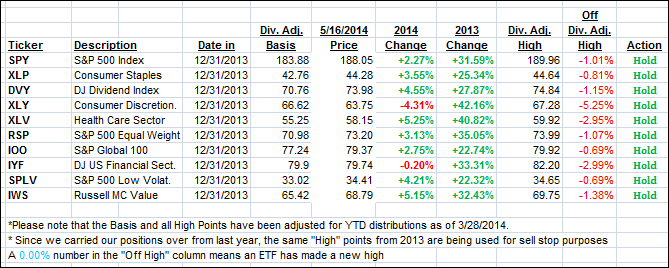
To be clear, the first table above shows the position of the various ETFs in relation to their respective long term trend lines (%M/A), while the second one tracks their trailing sell stops in the “Off High” column. The “Action” column will signal a “Sell” once the -7.5% point is taken out in the “Off High” column.
3. Domestic Trend Tracking Indexes (TTIs)
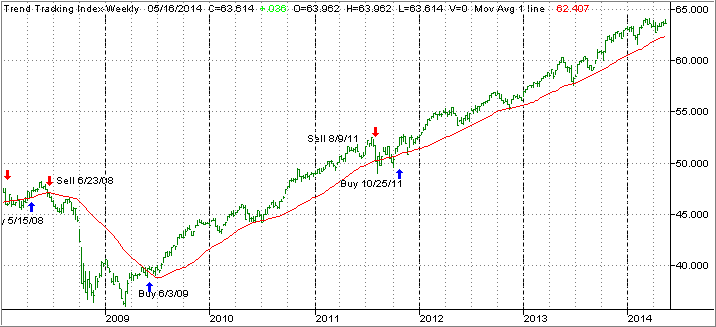
Our Trend Tracking Indexes (TTIs) meandered without making any clear headway, but both remain on the bullish side of the trend line by the following percentages:
Domestic TTI: +2.09% (last Friday +2.05%)
International TTI: +3.01% (last Friday +2.87%)
Have a great weekend.
Ulli…
Disclosure: I am obliged to inform you that I, as well as advisory clients of mine, own some of these listed ETFs. Furthermore, they do not represent a specific investment recommendation for you, they merely show which ETFs from the universe I track are falling within the guidelines specified.
————————————————————-
READER Q & A FOR THE WEEK
All Reader Q & A’s are listed at our web site!
Check it out at:
http://www.successful-investment.com/q&a.php
A note from reader Joseph:
Q: Ulli: This is more a comment than a question. I really like your 10 ETFs in the Spotlight addition, which I follow daily. I used to be the type of investor who could not be invested in too many mutual funds and/or ETFs.
I now use the spotlight ETFs as my guide, have reduced my total holdings sharply, update my trailing stops daily and have found that my investing endeavors currently not only take much less time but also have reduced my emotional decision making in the process. I am much more relaxed and feel confident that I can better handle the uncertainties of the market place. Thanks for that.
A: Joseph: While I don’t dwell on this often enough, the issues you have addressed exactly describe the main benefits of the trend tracking methodology. Having a plan in place that deals with whatever the market gives you, let’s you make better decisions and, as importantly, allows you to sleep better at night.
———————————————————-
WOULD YOU LIKE TO HAVE YOUR INVESTMENTS PROFESSIONALLY MANAGED?
Do you have the time to follow our investment plans yourself? If you are a busy professional who would like to have his portfolio managed using our methodology, please contact me directly or get more details at:
https://theetfbully.com/personal-investment-management/
———————————————————
Back issues of the ETF/No Load Fund Tracker are available on the web at:
https://theetfbully.com/newsletter-archives/

 The eurozone grew in the first quarter despite no mending of balance-sheets at the macro-level and stagnation in France and the Netherlands, said David Owen, Chief European Economist at Jefferies International. The building blocks for a sustainable and strong-based recovery were not simply there. Inflation in May is likely to print at or below 0.5 percent, which will put pressure on the European Central Bank President Mario Draghi to act in June, he noted.