ETF/No Load Fund Tracker Newsletter For Friday, February 28, 2014
ETF/No Load Fund Tracker StatSheet
————————————————————-
THE LINK TO OUR CURRENT ETF/MUTUAL FUND STATSHEET IS:
————————————————————
Market Commentary
Friday, February 28, 2014
WEEKLY RECAP; EEM BREAKS 50-DAY MOVING AVERAGE

1. Moving The Markets
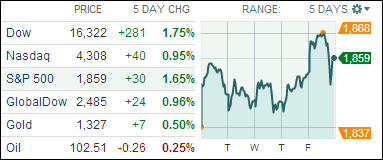
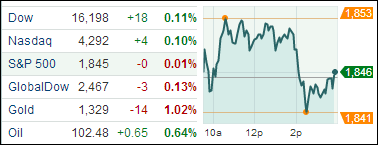
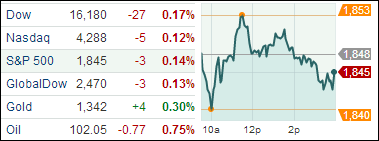
The major indexes here in the U.S. had a nice week overall as the chart above shows. We started off on a positive note with the S&P breaking its intraday record high of 1,858.71 and 7 out of 10 sectors posting gains. Energy led the pack of sector gainers on Monday (+1.5%) and for the entire of the week. We saw the market go up and down only to finish where it started on Tuesday and Wednesday.
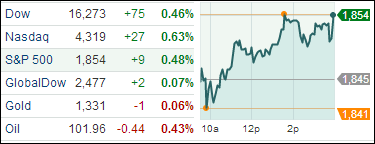
Thursday was a record breaking day for the S&P 500 as it finally closed at a new all-time high. There was a lot of build-up in anticipation of Janet Yellen’s speech to the Federal Reserve; however, her comments did not indicate that the central bank would lower the pace of its stimulus reduction, so investors felt some relief that there were no negative surprises. On Friday, we received news that domestic GDP for Q4 2013 was 2.4%, down from an initial 3.2% estimate, but the markets took it as a non-event.
Tesla (TSLA) stole many of the headlines this week after Morgan Stanley (MS) revised their target price upwards from $153 to $320 alongside the Company’s announcement that they plan on boosting their battery production capability via the “Gigafactory.”
As you know, emerging markets have been a concern for investors since early January. However, just today the iShares MSCI Emerging Markets Index ETF (EEM) closed above its 50-day moving average, which caught the attention of more than a few. Was this a fluke? I remain skeptical regarding the ability of emerging market ETFs to perform well over the next few months, unless their long-term trend line gets broken to the upside.
Our 10 ETFs in the Spotlight held steady and 7 of them have now turned positive for the year.
2. ETFs in the Spotlight
In case you missed the announcement and description of this section, you can read it here again.
It features 10 broadly diversified ETFs from my HighVolume list as posted every Monday. Furthermore, they are screened for the lowest MaxDD% number meaning they have been showing better resistance to temporary sell offs than all others over the past year.
In other words, none of them ever triggered their 7.5% sell stop level during this time period, which included a variety of severe market pullbacks but no move into outright bear market territory.
Here are the 10 candidates:
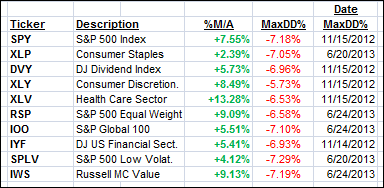
All of them are in “buy” mode meaning their prices are above their respective long term trend lines by the percentage indicated (%M/A).
Year to date, here’s how the above candidates have fared so far:
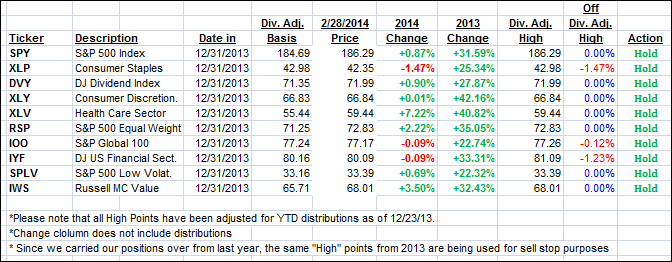
To be clear, the first table above shows the position of the various ETFs in relation to their respective long term trend lines (%M/A), while the second one tracks their trailing sell stops in the “Off High” column.
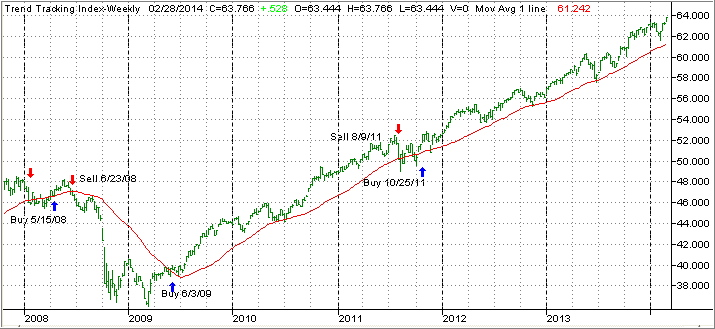
3. Domestic Trend Tracking Indexes (TTIs)
Our Trend Tracking Indexes (TTIs) improved from last week’s close and ended as follows:
Domestic TTI: +4.34% (last Friday +3.45%)
International TTI: +6.39% (last Friday +6.12%)
Have a great week.
Ulli…
Disclosure: I am obliged to inform you that I, as well as advisory clients of mine, own some of these listed ETFs. Furthermore, they do not represent a specific investment recommendation for you, they merely show which ETFs from the universe I track are falling within the guidelines specified.
————————————————————-
READER Q & A FOR THE WEEK
All Reader Q & A’s are listed at our web site!
Check it out at:
http://www.successful-investment.com/q&a.php
A note from reader Jim:
Q: Ulli: Just a word to thank you for all you continually share. Your cool head and sane approach to risk reduction make your blog a bright spot on the web. Your switch in emphasis from mutual funds to ETFs has helped many of us make the transition. The cutline rankings have been very helpful. The ten sector table is a helpful focus.
What I miss are the Trend Tracking charts you used to publish. They continue to be an important reference in your blog, and I miss seeing them. Perhaps I have missed the link to the place they are displayed. Do you still share them? A quick look at the charts provided me more sense of perspective and direction than the simple daily report of x% over or under a trend line I cannot see. Am I the only one that misses the charts?
A: Jim: Thanks for your kind words. Yes, you must have missed it; the Trend Tracking charts are the cornerstone to my methodology, and they are being published always in the weekly StatSheet, which is posted every Thursday around 6 pm PST. The link is then mailed in Friday’s update to all readers.
———————————————————-
WOULD YOU LIKE TO HAVE YOUR INVESTMENTS PROFESSIONALLY MANAGED?
Do you have the time to follow our investment plans yourself? If you are a busy professional who would like to have his portfolio managed using our methodology, please contact me directly or get more details at: