ETF/No Load Fund Tracker Newsletter For March 14, 2014
ETF/No Load Fund Tracker StatSheet
————————————————————-
THE LINK TO OUR CURRENT ETF/MUTUAL FUND STATSHEET IS:
https://theetfbully.com/2014/03/weekly-statsheet-for-the-etfno-load-fund-tracker-newsletter-updated-through-03132014/
————————————————————
Market Commentary
Friday, March 14, 2014
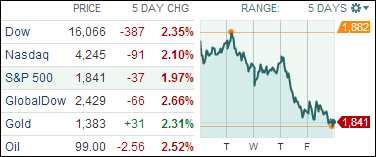
CHINA’S SLOW GROWTH, UKRAINE TENSIONS DRAG MARKETS DOWN FOR THE WEEK

[Chart courtesy of MarketWatch.com]
1. Moving The Markets
A sharp slowdown in China’s pace of growth affected stock and commodity prices globally, as the world’s second-largest economy continues to show signs of weakness. Rising tensions between Russia and the Ukraine also led investors to sell riskier assets this week. Japan reported that its economy grew more slowly than first estimated in the fourth quarter of 2013.
US data were mixed: Jobless benefit claims fell and retail sales rose, but producer prices fell slightly, indicating weakness, and consumer sentiment edged down. Thus, overall this week global stocks broadly lost ground, and the price of most commodities, including oil, fell. Gold prices rose and the yield on 10-year US Treasury notes fell substantially as demand grew for safe-haven assets. Reflecting the market’s nervous mood, the CBOE Volatility Index rose to 16.22, its highest level in weeks.
Data released this week signals a resilient, but far from robust, US economy. On the plus side, retail sales rose 0.3%, slightly more than the anticipated 0.2%. After the unusually cold and snowy winter, sales are expected to pick up further in the spring, as warmer weather combines with healthier household finances and a possible increase in consumer demand.
Volkswagen (VW), Europe’s largest automaker, reported a 58% drop in its net earnings for 2013 and issued a cautious outlook for 2014 as a result of sluggish global car demand and emerging market currency risks. Volkswagen’s sales rose 2.2% overall, driven by healthy sales of Porsche sports cars and strong growth in China.
Fannie Mae and Freddie Mac are back in the spotlight. After having fully repaid their $187.5 billion bailout to the US government, Fannie and Freddie could send almost $180 billion in profits to taxpayers over the next decade if the terms of their bailout remain unchanged, according to the US budget office. However, a bipartisan congressional proposal to wind down the mortgage giants is being considered. Shares of both companies fell sharply on the news.
Looking ahead to next week, we will receive the U.S. Federal Reserve’s latest policy decision on Mar. 19 and Oracle will report its quarterly earnings on Tuesday.
Our 10 ETFs in the Spotlight slipped for the week with 6 of them still showing gains YTD.
2. ETFs in the Spotlight
In case you missed the announcement and description of this section, you can read it here again.
It features 10 broadly diversified ETFs from my HighVolume list as posted every Monday. Furthermore, they are screened for the lowest MaxDD% number meaning they have been showing better resistance to temporary sell offs than all others over the past year.
In other words, none of them ever triggered their 7.5% sell stop level during this time period, which included a variety of severe market pullbacks but no move into outright bear market territory.
Here are the 10 candidates:
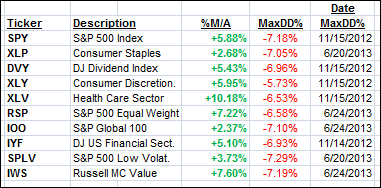
All of them are in “buy” mode meaning their prices are above their respective long term trend lines by the percentage indicated (%M/A).
Year to date, here’s how the above candidates have fared so far:
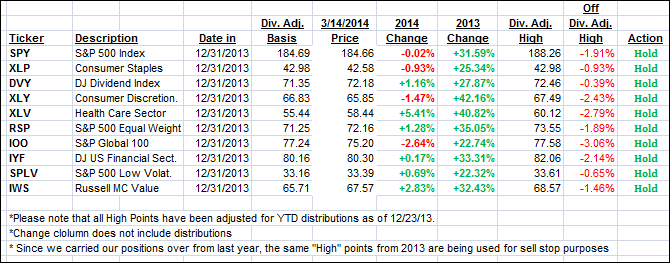
To be clear, the first table above shows the position of the various ETFs in relation to their respective long term trend lines (%M/A), while the second one tracks their trailing sell stops in the “Off High” column.
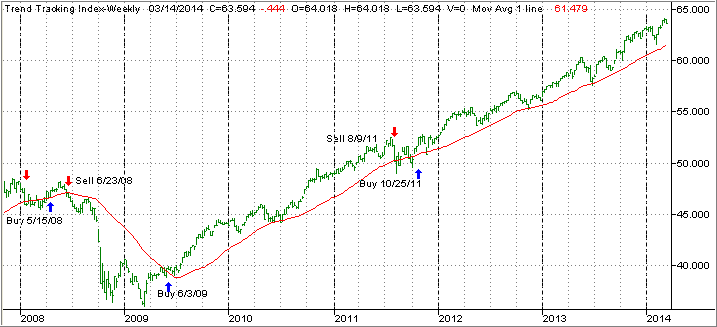
3. Domestic Trend Tracking Indexes (TTIs)
Our Trend Tracking Indexes (TTIs) headed south as well with the International one taking a big hit over the past five trading days:
Domestic TTI: +3.34% (last Friday +4.55%)
International TTI: +3.10% (last Friday +6.35%)
Have a great week.
Ulli…
Disclosure: I am obliged to inform you that I, as well as advisory clients of mine, own some of these listed ETFs. Furthermore, they do not represent a specific investment recommendation for you, they merely show which ETFs from the universe I track are falling within the guidelines specified.
————————————————————-
READER Q & A FOR THE WEEK
All Reader Q & A’s are listed at our web site!
Check it out at:
http://www.successful-investment.com/q&a.php
A note from reader John:
Q: Ulli: I have been in all cash for a while but looking for some equity exposure. Any suggestions?
A: John: While I can’t give specific recommendations, I can suggest one way of carefully easing into the market. Given current high market levels and if you have a conservative bias, I recommend my incremental buying strategy, which is explained in detail in my video on my blog. It’s not the one at the top right. Scroll down a bit and look for the one titled “How to know your investment risk.”
———————————————————-
WOULD YOU LIKE TO HAVE YOUR INVESTMENTS PROFESSIONALLY MANAGED?
Do you have the time to follow our investment plans yourself? If you are a busy professional who would like to have his portfolio managed using our methodology, please contact me directly or get more details at:
https://theetfbully.com/personal-investment-management/
———————————————————
Back issues of the ETF/No Load Fund Tracker are available on the web at:
https://theetfbully.com/newsletter-archives/