Weekly StatSheet For The ETF/No Load Fund Tracker Newsletter – Updated Through 06/05/2014

Ulli ETF StatSheet Contact

ETF/Mutual Fund Data updated through Thursday, June 5, 2014

Table of Content082312

If you are not familiar with some of the terminology used, please see the Glossary of Terms.


1. DOMESTIC EQUITY MUTUAL FUNDS/ETFs: BUY — since 10/25/2011

TTI

Our main directional indicator, the Domestic Trend Tracking Index (TTI), broke through its long-term trend line generating a Sell for this area effective 8/9/2011. Over the recent past, we’ve seen the TTI hovering slightly below and above this dividing line between bullish and bearish territory. The clear break to the upside occurred on 10/24/11 and, effective 10/25/11, a new Buy signal for domestic equities went into effect.

As of today, our TTI (green line in above chart) is positioned above its long term trend line (red) by +3.57%.

To avoid a potential whip-saw, a Sell signal to move out of all domestic equity positions will be generated once we have clearly pierced the red line to the downside. Be sure to tune in for the latest updates.

Read More

ECB Cuts Rates To -0.10%; Amazon Has Something Stirring

Ulli Market Commentary Contact

Thur pic

[Chart courtesy of MarketWatch.com]

1. Moving The Markets

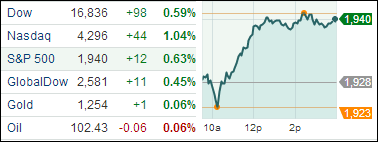
Up, up and away the markets continued to climb today reaching record higher ground. The S&P 500 gained 0.63% with the Dow not far behind posting 0.59% gains, but, of course, the Nasdaq stole the show gaining 1.04% on the day. The day’s gains were broad, with all ten S&P 500 sectors ending higher, led by the industrials sector.

Over the past three weeks, I have noted off and on that investors are anticipating that the European Central Bank will cut interest rates. Well, today it finally happened. The ECB dropped rates to record lows (-0.10%) in an effort to fight the risk of deflation of the Euro currency. The ECB also launched a series of monetary expansion type measures to pump money into the sluggish euro zone economy. This was not full-fledged quantitative easing, although President Mario Draghi said they will take more action if necessary.

In the tech world, Amazon.com (AMZN) saw a sharp jump in its stock today of 5.5% after it released a mysterious Youtube and website mini teaser about a potential upcoming “launch event” in Seattle that will be hosted by the CEO Jeff Bezos. There have been rumors speculating what the new product will be, most hinting at a smart phone. If that is the case, it will be Amazon’s first endeavor into the smart phone competitive landscape.

Our 10 ETFs in the Spotlight jumped with the indexes; 9 of them made new highs today and remain on the plus side YTD.

Read More

06-05-2014

Ulli Newsletter Archives Contact

The ETF/No Load Fund Tracker

Monthly Review—May 31, 2014

US Equities Mostly Higher In May; Europe Continues To Report Robust Gains

US equities broadly gained in May with all three leading indexes finishing higher for the month with the Dow Jones Industrial Average (DJIA) and the S&P 500 (SPX) hitting new highs.

The blue-chip Dow ended May up 2.1 percent for the month. The benchmark S&P added 2.1 percent to finish at 1,923.57.

The NASDAQ composite index picked up 3.1 percent in May to end at 4,242.62. That was the tech-heavy index’s first monthly gain since February.

Both the DJIA and the NASDAQ turned positive for the year in May.

The US economy continued to heal after logging in disappointing GDP numbers in the first quarter. The Federal Reserve’s favorite gauge for inflation – the Personal Consumption Expenditure Price – surged 1.6 percent in the 12 months through April from 1.1 percent in March, posting the biggest gain since November 2012. Higher PCEP indicates firming up of consumer demand and bodes well for the economy as consumption makes up for about 70 percent of GDP.

The Chicago-area Institute for Supply Management’s business barometer unexpectedly jumped to 65.5 from 63 in April. The May reading was a seven-month high and well above economists forecast for a monthly print of 61. Readings above 50 indicate expansion from the previous month.

Separately, the National Association for Realtors said a gauge for pending home sales rose 0.4 percent in April, marking the second consecutive gain since the slump that started last summer.

Data released by the Commerce Department showed US single-family home sales jumped 6.4 percent to an annual rate of 433,000 in April. That was higher than the 429,000 units most economists had projected and compared with the upwardly revised 407,000 reading reported for March.

Minutes from the Fed’s April meeting showed officials discussed several approaches about tightening of monetary policy going forward while acknowledging the need to improve guidance on interest rates.

The Institute for Supply Management’s manufacturing index rose to 55.4 in May from 54.9 in April. The factory output gauge rose at the fastest pace this year and was well above the initial “flash” print of 53.2.

On the downside, consumer spending fell in April as Americans spent less on utilities and cut back on car purchases. The decline was led by a 3 percent drop in spending on natural gas as the weather warmed up and nullified March’s upwardly revised 1 percent gain.

Across the Atlantic, European stocks continued to advance in May despite inflation in the 18-member euro area deteriorating during the month. The Stoxx Europe 600 index finished at 344.24, capping its monthly gain at 1.9 percent. The benchmark index has added about 5 percent since January and hit a six-year high during the month.

Annual inflation rate in Spain fell to 0.2 percent in May from 0.3 percent in April, while Italy’s inflation rate dropped to 0.4 percent from 0.5 percent. Inflation in Germany fell sharply last month, stoking speculation the European Central Bank will ease policies further when they meet on June 5. EU-harmonized annual inflation rate slumped to 0.6 percent last month from 1.1 percent in April in Europe’s largest economy.

Data released by Eurostat showed unemployment rate in the euro area fell to 11.7 percent in April from 11.8 percent in March. April’s jobless level beat forecasts of an 11.8 percent reading.

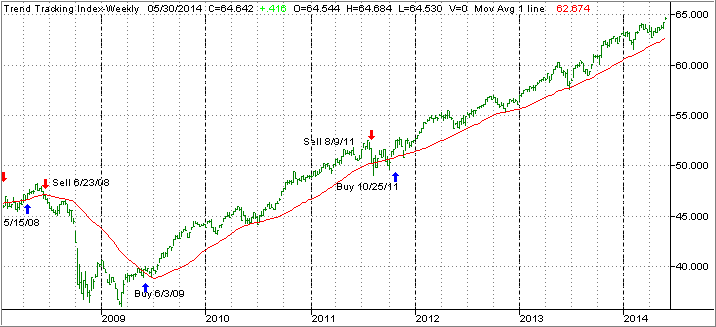
Technically speaking, our Domestic Trend Tracking Index (TTI) remains firmly entrenched in its long-term bullish pattern and actually made new highs during May as the chart below shows:
TTI0530

Market pullbacks were well contained and of short duration before the major trend reestablished itself pushing the benchmark indexes along with our TTI higher and into unchartered territory. Despite the daily onslaught of wild and opposing market predictions in the financial media, it’s best to continue the path of staying with our positions until a trend change advises us otherwise.

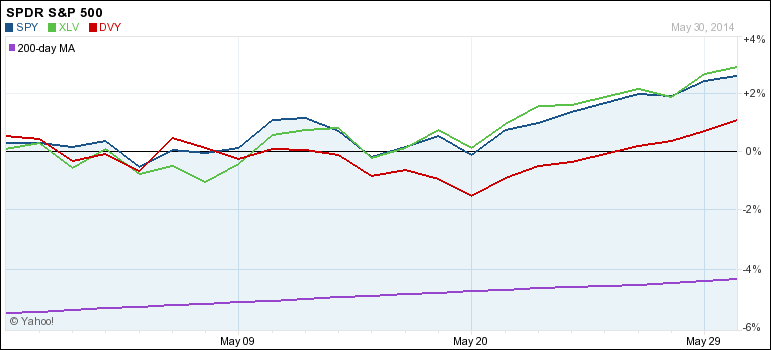
Our main holdings showed far less volatility as in the month before as you can see in the 30-day chart:
MonthlyChart

The past 30 days gave us a pretty smooth ride in that the trading ranges of the various indexes were less broad, which means we never came close to having any sell stops triggered.

The S&P 500 successfully not only conquered its 1,900 milestone marker on May 23rd  but has also managed to stay above it ever since. With earnings season being over, I think a new driver is needed to propel these markets higher; otherwise we might get stuck in a trading range again.

Of course, a pullback with unknown magnitude from these lofty levels is always a possibility, so I will be watching our sell stops closely and head for the exit doors, should the need arise.

You Can’t Keep A Good Stock Index Down

Ulli Market Commentary Contact

Wed pic

[Chart courtesy of MarketWatch.com]

1. Moving The Markets

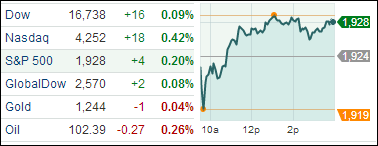
Well, stocks came roaring back today after a solemn Tuesday. The S&P 500 once again closed in record territoryas the chart above shows. The service sector was a leading gainer, as we received a report that showed U.S. service firms grew more quickly as production, hiring and new orders increased. All are interpreted as signs that the economy is accelerating after dipping at the start of the year.

Among the day’s biggest gainers were U.S. solar companies after the United States slapped new import duties on solar panels and other related products from China in a preliminary determination. First Solar (FSLR) rose 3.9% to $65.39.

While markets keep trending up, looking at some other economic numbers might keep our heads a bit more in check. The U.S. trade deficit ($47.2 bil) widened to its highest in almost two years in April as imported goods set a record; U.S. productivity declined even more rapidly than believed in the first quarter as extreme winter weather made businesses far less efficient. The path to forge ahead shall continue to be an uphill battle, needless to say, with the hope being that the GDP growth number hovers around that 2.2% mark.

Our 10 ETFs in the Spotlight improved with 5 of them making new highs today while 9 of them remain on the plus side YTD.

Read More

Equities End Winning Streak; Gold Closes Higher

Ulli Market Commentary Contact

Tue pic

[Chart courtesy of MarketWatch.com]

1. Moving The Markets

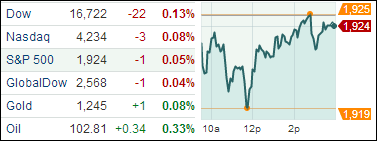
Stocks pulled back a tad, snapping a record breaking streak since last Friday. All major indexes gave back some of their recent gains. Although we saw a drop today, markets have been trending up over the past two weeks.

M&A activity regained their share of headlines, especially the recent Hillshire-Jimmy Dean-Tyson Foods-Pilgrim’s Pride bidding war. Today, Pilgrim’s Pride upped their bid for Hillshire by topping Tyson’s bid of $50/share by $10 to $60/share. Hillshire’s stock reacted positively gaining 9.5% to $58.65, while Pilgrim’s shares fell 2.2% to $25.34.

Well, I was bashing gold yesterday and, of course, as irony would have it the precious metal rose for the first time in six days today. Gold is a common safe haven that often moves in the opposite direction of general stock market trends and that was the case today it seemed as markets dropped. One good day doesn’t cover up the long term trend, which analysts still predict to be an uphill battle, especially given the uncertainties of Thursday’s ECB policy meeting and a big decline in interest rates in the futures market.

Our 10 ETFs in the Spotlight stayed pretty much even; however, 1 of them made a new high today while 9 of them remain on the plus side YTD.

Read More

Apple Fails To Impress; S&P And Dow Continue Marching Forward

Ulli Market Commentary Contact

Mon pic

[Chart courtesy of MarketWatch.com]

1. Moving The Markets

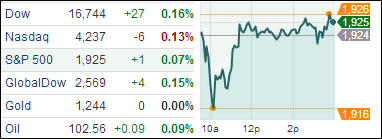
The S&P 500 and Dow both kept moving forward to new record highs today, while the Nasdaq limped to the finish line to close in the red. The S&P 500 realized its 15th record close of 2014, and the Dow posted its 6th record close of the year.

There was a folly in the Manufacturing Index released by the Institute for Supply Management that caused a slight shock in the Dow. The index reported an unexpected drop to 53.2 in May, but actually had improved to 55.4, up from 54.9. The correction shortly thereafter eased sudden concerns about the economy and the Dow climbed back up accordingly.

While the S&P and Dow kept trending upwards, things were not so fruitful for the Nasdaq today. Big names like Amazon (AMZN), Biogen (BIIB), Google (GOOG) and Tesla (TSLA) all were a drag on the index. Even Apple (AAPL), after unveiling new operating systems for their computers, phones and tablets, couldn’t impress investors enough to post gains on the day. The stock fell $4.35 to $628.65.

Meanwhile, gold prices still continues to trend downwards, dropping 0.2% to $1,243/oz. The metal has been slowly moving away from its 2014 high of almost $1,400/oz. and has not shown any apparent signs of regaining momentum.

Our 10 ETFs in the Spotlight went predominantly sideways; however, 4 of them made new highs today while 9 of them remain on the plus side YTD.

Read More