One Man’s Opinion: Is The Weak Labor Market Weighing On Inflation?

Ulli Market Review Contact

92835431The March US nonfarm payrolls number was slightly disappointing as economists had forecast a higher reading although revised estimates for February came in better than expected.

However, Randall Kroszner, a professor of economics at the Chicago University’s Booth School and a former Federal Reserve governor, thinks the latest number is pretty much right on target since the job creation rate has been about 200,000 per month for about the last 12 months. There has been an uptick in the work-week after the tick-down in the previous two months, which indicates things are pretty much on track for the Fed’s forecast, he noted.

Asked if the weak wage growth-rate is a matter of concern since it indicates the hiring rate is yet to pick up, Randy said the economy is creating a reasonable number of jobs though it may not be as strong as the Fed would like to see. However, the decline in nominal and real income growth will keep the wage pressure down, allowing the Fed to keep rates low for longer, he observed.

Read More

New ETFs On The Block: First Trust RBA Quality Income ETF (QINC)

Ulli Income ETFs Contact

105487691The dividend ETF space has managed to generate considerable interest among investors in recent months. Responding to investor demand, issuers have launched a raft of new funds while lining up quite a few more in an attempt to give a new spin to the age old dividend investing strategy.

First Trust, the Il-based leading global issuer of exchange-traded funds, is the newest entrant to the high-yield dividend ETF fray. The First Trust RBA Quality Income ETF (QINC) tracks the Richard Bernstein Advisors Quality Income Index, giving investors exposure to income producing stocks. The underlying equity index has been developed by Richard Bernstein Advisors, an independent advisory founded by former Merrill Lynch Chief Investment Strategist Richard Bernstein.

The index aims to maintain attractive current income while controlling risks associated with investing in higher-yielding equities. RBA believes high dividend-yield stocks should be viewed with caution as lower stock prices may simply reflect investor anticipation of impending dividend cuts or omissions. The risks associated with high-dividend stocks are simply higher since they may lead to selection of stocks whose dividends are either discontinued or reduced going forward.

Read More

04-04-2014

Ulli Newsletter Archives Contact

ETF/No Load Fund Tracker Newsletter For April 4, 2014

ETF/No Load Fund Tracker StatSheet

————————————————————-

THE LINK TO OUR CURRENT ETF/MUTUAL FUND STATSHEET IS:

https://theetfbully.com/2014/04/weekly-statsheet-for-the-etfno-load-fund-tracker-newsletter-updated-through-04032014/

————————————————————

Market Commentary

Friday, April 4, 2014

STOCKS POSITIVE OVERALL FOR THE WEEK ON OPTIMISTIC U.S. ECONOMIC DATA

Fri pic

[Chart courtesy of MarketWatch.com]

1. Moving The Markets

Stocks rose as a suite of economic data raised optimism about the health of the economy.  Headlining the focus was the March employment report, which showed job growth of 192,000 for the month.  Combined with upward revisions to hiring in January and February, and an increase in the average hours worked, labor market trends are consistent with other indicators that signal the economy is regaining its footing after a volatile first quarter.  The end of March marked the fifth consecutive quarterly advance for the stock market, with the S&P 500 delivering a total return of 1.8% in the first three months of the year.

Elsewhere, the largest S&P 500 sector, technology, proved to be a significant drag on the major averages amid weakness in large names. Apple (AAPL) Google (GOOG), Microsoft (MSFT), and Visa (V) lost between 1.3% and 4.7% with Google seeing the largest decline of the bunch. Smaller momentum names registered even larger losses with FireEye (FEYE), Splunk (SPLK), and Yelp (YELP) down between 5.6% and 8.2%. The three names extended their weekly losses to 20.7%, 12.0%, and 14.1%, respectively.

On the upside, utilities (+0.6%) posted a solid gain with lower yields giving a boost to the rate-sensitive sector.

Gold rose the most in three weeks. Gold has rebounded this year after plunging almost 30% last year as the dollar appreciated and the U.S. economy showed signs of strengthening without inflation. In energy trading, the price of oil rose 85 cents, or 0.8%, to $101.14 a barrel.

Our 10 ETFs in the Spotlight rode the roller coaster with the indexes but 9 of them are remaining on the plus side YTD.

2. ETFs in the Spotlight

In case you missed the announcement and description of this section, you can read it here again.

It features 10 broadly diversified ETFs from my HighVolume list as posted every Monday. Furthermore, they are screened for the lowest MaxDD% number meaning they have been showing better resistance to temporary sell offs than all others over the past year.

In other words, none of them ever triggered their 7.5% sell stop level during this time period, which included a variety of severe market pullbacks but no move into outright bear market territory.

Here are the 10 candidates:

MaxDD

All of them are in “buy” mode meaning their prices are above their respective long term trend lines by the percentage indicated (%M/A).

Year to date, here’s how the above candidates have fared so far:

YTD

To be clear, the first table above shows the position of the various ETFs in relation to their respective long term trend lines (%M/A), while the second one tracks their trailing sell stops in the “Off High” column.

3. Domestic Trend Tracking Indexes (TTIs)

Our Trend Tracking Indexes (TTIs) only changed slightly from last Friday’s close due to today’s sell off, which wiped out most of the gains:

Domestic TTI: +2.31% (last Friday +2.48%)

International TTI: +3.74% (last Friday +3.37%)

Have a great week.

Ulli…

Disclosure: I am obliged to inform you that I, as well as advisory clients of mine, own some of these listed ETFs. Furthermore, they do not represent a specific investment recommendation for you, they merely show which ETFs from the universe I track are falling within the guidelines specified.

————————————————————-

READER Q & A FOR THE WEEK

All Reader Q & A’s are listed at our web site!
Check it out at:

http://www.successful-investment.com/q&a.php

A note from reader Ken:

Q: Ulli: I follow you via Twitter and noticed that you publish Friday’s newsletter edition around 4 pm PST. About an hour later you publish an update, but I can’t seem to figure out what has been updated. Could you explain?

A: Ken: Sure, when I publish the newsletter, I don’t have all weekending values available by 4 pm. The update I post later in the day makes a correction to the Trend Tracking Indexes (TTIs) when the weekly moving averages are being adjusted. These data points become available later on, hence the update.

———————————————————-

WOULD YOU LIKE TO HAVE YOUR INVESTMENTS PROFESSIONALLY MANAGED?

Do you have the time to follow our investment plans yourself? If you are a busy professional who would like to have his portfolio managed using our methodology, please contact me directly or get more details at:

https://theetfbully.com/personal-investment-management/

———————————————————

Back issues of the ETF/No Load Fund Tracker are available on the web at:

https://theetfbully.com/newsletter-archives/

ETF/No Load Fund Tracker Newsletter For April 4, 2014

Ulli ETF Tracker Contact

ETF/No Load Fund Tracker StatSheet

————————————————————-

THE LINK TO OUR CURRENT ETF/MUTUAL FUND STATSHEET IS:

https://theetfbully.com/2014/04/weekly-statsheet-for-the-etfno-load-fund-tracker-newsletter-updated-through-04032014/

————————————————————

Market Commentary

Friday, April 4, 2014

STOCKS POSITIVE OVERALL FOR THE WEEK ON OPTIMISTIC U.S. ECONOMIC DATA

Fri pic

[Chart courtesy of MarketWatch.com]

1. Moving The Markets

Stocks rose as a suite of economic data raised optimism about the health of the economy.  Headlining the focus was the March employment report, which showed job growth of 192,000 for the month.  Combined with upward revisions to hiring in January and February, and an increase in the average hours worked, labor market trends are consistent with other indicators that signal the economy is regaining its footing after a volatile first quarter.  The end of March marked the fifth consecutive quarterly advance for the stock market, with the S&P 500 delivering a total return of 1.8% in the first three months of the year.

Elsewhere, the largest S&P 500 sector, technology, proved to be a significant drag on the major averages amid weakness in large names. Apple (AAPL) Google (GOOG), Microsoft (MSFT), and Visa (V) lost between 1.3% and 4.7% with Google seeing the largest decline of the bunch. Smaller momentum names registered even larger losses with FireEye (FEYE), Splunk (SPLK), and Yelp (YELP) down between 5.6% and 8.2%. The three names extended their weekly losses to 20.7%, 12.0%, and 14.1%, respectively.

On the upside, utilities (+0.6%) posted a solid gain with lower yields giving a boost to the rate-sensitive sector.

Gold rose the most in three weeks. Gold has rebounded this year after plunging almost 30% last year as the dollar appreciated and the U.S. economy showed signs of strengthening without inflation. In energy trading, the price of oil rose 85 cents, or 0.8%, to $101.14 a barrel.

Our 10 ETFs in the Spotlight rode the roller coaster with the indexes but 9 of them are remaining on the plus side YTD.

Read More

04-05-2014

Ulli Newsletter Archives Contact

The ETF/No Load Fund Tracker

Monthly Review—March 31, 2014

US Equities Log Mixed Results In March; Europe Rallies To A Seven-Month High

US stock indexes logged in a mixed performance in March with the benchmark S&P 500 ending both the month and the first quarter of 2014 with modest gains despite geopolitical uncertainties and the continued reduction in Federal Reserve asset purchases.

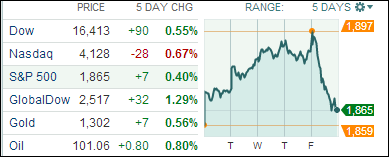
The S&P 500 closed at 1,872.34, up 0.7 percent for the month. This was the fifth straight quarterly rise for the benchmark index and at 1.3 percent, the smallest three-month advance since the fourth quarter of 2012.

The Dow Jones Industrial Average finished at 16,457.66, marking a gain of 0.8 percent for March. The blue-chip index, however, shed 0.7 percent for the quarter.

The NASDAQ Composite index ended at 4,308.11, down 2.5 percent for the month. That was the index’s worst performance since October 2012.

The tech-heavy index, however, managed to notch a 0.5 percent gain for the quarter.

The US economy showed signs of revival in March, shrugging off the winter chills that had slowed down recovery considerably in the first two months of the year.

The labor market continued to heal with hiring by the US private sector picking up in March. Data released by Automatic Data Processing Inc showed US companies increased payrolls by 191,000 last month. The payroll processor also revised its February reading to 178,000 from an earlier estimate of 139,000.

US non-manufacturing and service sector growth gained pace in March, according to data released by the Institute for Supply Management. The non-manufacturing index rose to 53.1% in March from 51.6% in the previous month, slightly falling short of the 53.3% reading economists had called for.

Readings above 50% signal expansion – the higher the reading, the faster the expansion.

Personal income rose for a second consecutive month in February. At 0.3 percent, February’s income growth matched January’s pace and exceeded the 0.2 percent clip forecast by economists.

Personal spending grew 0.3 percent from a downwardly revised 0.2 percent in January, matching expectations. The Commerce Department revised fourth-quarter GDP growth upwards to 2.6 percent from an initial reading of 2.4 percent.

On the downside, the US trade deficit in February rose to a five-month high mainly due to falling exports and rising imports. The Trade gap widened to a seasonally-adjusted $42.3 billion from $39.3 billion in January.

Data released by the Labor Department showed new jobless claims rose by 16,000 to a seasonally-adjusted 326,000 in the week ending March 29. Most economists surveyed projected an increase of 10,000 claims.

At a press conference on March 19, Federal Reserve Chairwoman Janet Yellen caught the markets by surprise when she said the central bank could raise interest rates in about six months after ending its bond purchase program. That would mean policy tightening as early as the first half of 2015.

However, speaking at a community development conference in Chicago on March 31, Yellen said the US economy would require loose monetary policies for “some time” as the “scars” from the 2008 market collapse are yet to heal, indicating the Fed will remain accommodative  for a long, long time.

Across the pond, European stocks tracked US equities in March. The pan-European Stoxx Europe 600 index finished March at 334.31, up 1.8 percent for the quarter.

European Central Bank President Mario Draghi has assured investors repeatedly that the central bank will act if disinflation risks started to affect the region’s price stability. However, ECB Governing Council member and German Bundesbank Chief Jens Weidmann said last Saturday the central bank should not overreact to a temporary fall in prices. The ECB has little control over a one-off drop in energy and food prices that caused the recent weakness in prices, Weidmann argued, giving the impression the central bank don’t believe circumstances warrant policy action at this stage.

In the end, it’s been a good news bad news type of month, which had the major indexes vacillating in both directions.

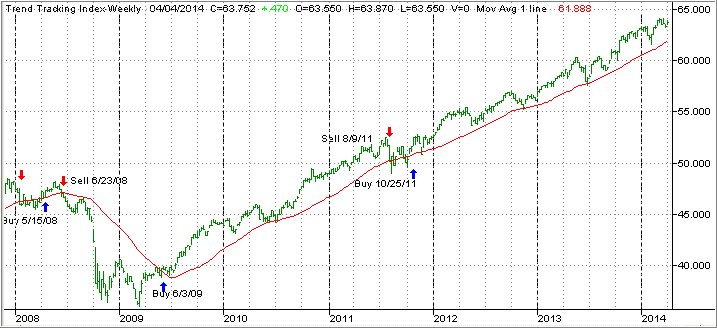
Our main directional indicator, the Domestic Trend Tracking Index (TTI), pulled back from its February highs and settled lower but still stays above its long term trend line:

TTI033114

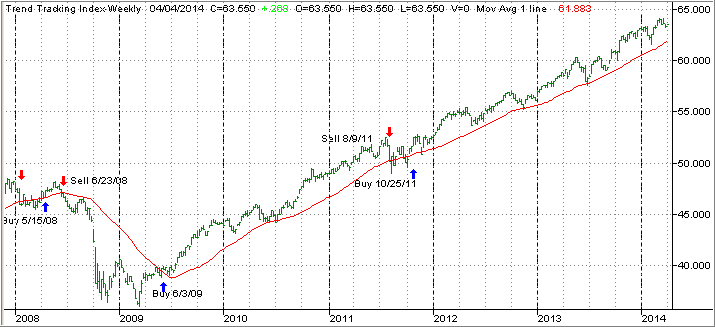
The index itself (green line) now hovers above the trend line (red) by +2.91% (last month +4.34%).

That means we will hold on our current ETFs subject to their trailing stops. Last month’s pullback caused one casualty in that our small holding in pharmaceuticals (PJP) triggered its sell stop and was liquidated.

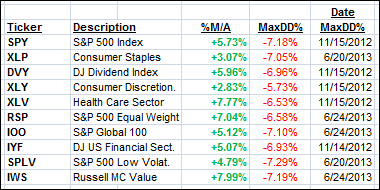
You can see the sometimes violent up and down moves in this monthly chart, which reflects our current main holdings:

March2014

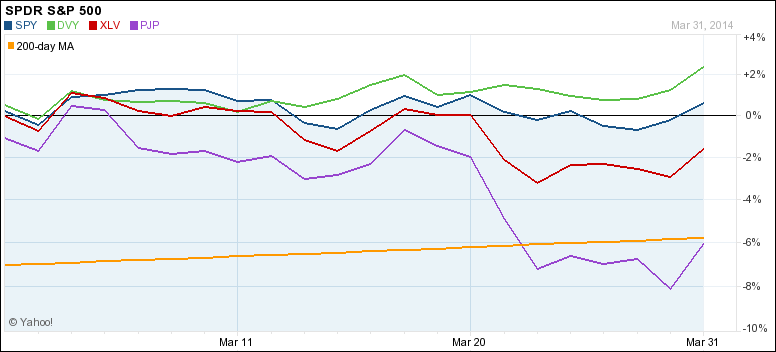
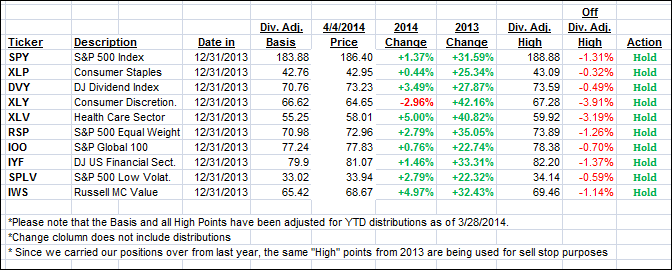
As I commented last month, pharmaceuticals (PJP) and healthcare (XLV) had been on a strong upswing, which came to an end in March with especially PJP hitting the skids. XLV gave back a little but is still our leader on an YTD basis as the Quarterly chart demonstrates:

1stQTR2014

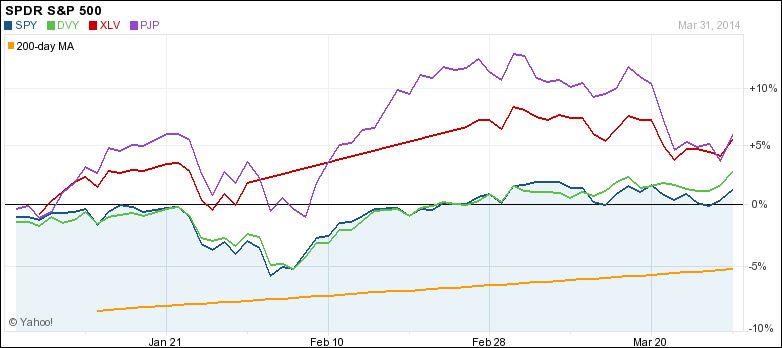
Healthcare has been less volatile than the pharmaceuticals and has rewarded us with some nice returns over the longer run. I will hold on to it, unless its sell stop gets triggered.

The markets seem to have somewhat normalized after strong gains in February, which pretty much made up for the losses in January. It’s interesting to note that, despite the sell offs in 2014, some of our core holdings in SPY, DVY and XLV have held steady and have given us continued market exposure as sell off were followed by rallies with some indexes (SPY) making new lifetime highs.

That’s what’s important; to be exposed with our core holdings to steady and slower moving indexes, which keep us invested until a serious trend reversal occurs. That idea will be my continued motto as we ease into the second quarter of 2014.

Weekly StatSheet For The ETF/No Load Fund Tracker Newsletter – Updated Through 04/03/2014

Ulli ETF StatSheet Contact

ETF/Mutual Fund Data updated through Thursday, April 3, 2014

Table of Content082312

If you are not familiar with some of the terminology used, please see the Glossary of Terms.


1. DOMESTIC EQUITY MUTUAL FUNDS/ETFs: BUY — since 10/25/2011

TTI

Our main directional indicator, the Domestic Trend Tracking Index (TTI), broke through its long-term trend line generating a Sell for this area effective 8/9/2011. Over the recent past, we’ve seen the TTI hovering slightly below and above this dividing line between bullish and bearish territory. The clear break to the upside occurred on 10/24/11 and, effective 10/25/11, a new Buy signal for domestic equities went into effect.

As of today, our TTI (green line in above chart) is positioned above its long term trend line (red) by +3.24%.

To avoid a potential whip-saw, a Sell signal to move out of all domestic equity positions will be generated once we have clearly pierced the red line to the downside. Be sure to tune in for the latest updates.

Read More