ETF/No Load Fund Tracker Newsletter For July 11, 2014
ETF/No Load Fund Tracker StatSheet
————————————————————-
THE LINK TO OUR CURRENT ETF/MUTUAL FUND STATSHEET IS:
https://theetfbully.com/2014/07/weekly-statsheet-for-the-etfno-load-fund-tracker-newsletter-updated-through-07102014/
————————————————————
Market Commentary
Friday, July 11, 2014
GLOBAL ECONOMY CONCERNS & EARNINGS ANTICIPATION LEAVES MARKET LOWER FOR THE WEEK

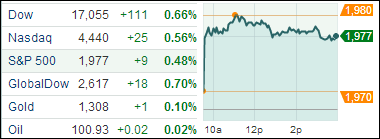
[Chart courtesy of MarketWatch.com]
1. Moving the Markets
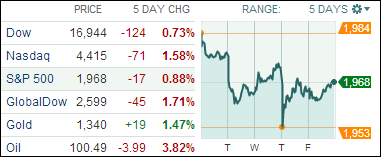
Stocks ended the week lower, pulling back slightly from record highs. The Dow fell from its record high 17,000 mark to end the week down-0.7%. The S&P dropped 0.9%, and the Nasdaq fell 1.35%.
Global economic growth concerns surfaced after disappointing economic readings in China, Japan, and the EU. Caution also rose following news of potential financial problems with a Portuguese bank, reminding investors that the EU is still susceptible to periodic setbacks from the European Debt Crisis. Despite the recent drop in stock prices, markets remain broadly higher on the year, with the S&P 500 still up roughly 7% in 2014, continuing its 5-year bull run.
After what has appeared to be fairly steady US economic growth this year, investors await corporate earnings results for the second quarter. According to FactSet, S&P 500 companies are forecast to report a 4.8% increase in second-quarter earnings per share from a year ago after a 2.1% rise in earnings in the first quarter of 2014. Only a few major companies had released earnings reports by the end of the week, making any overall trend difficult to discern at this early stage.
Let’s stay tuned for next week!
Our 10 ETFs in the Spotlight slipped for the week with none of them making a new high for the day.
2. ETFs in the Spotlight
In case you missed the announcement and description of this section, you can read it here again.
It features 10 broadly diversified ETFs from my HighVolume list as posted every Monday. Furthermore, they are screened for the lowest MaxDD% number meaning they have been showing better resistance to temporary sell offs than all others over the past year.
Here are the 10 candidates:
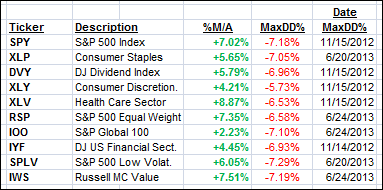
All of them are in “buy” mode, meaning their prices are above their respective long term trend lines by the percentage indicated (%M/A).
Year to date, here’s how the above candidates have fared so far:
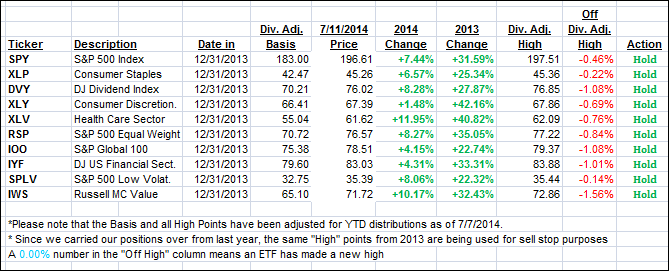
To be clear, the first table above shows the position of the various ETFs in relation to their respective long term trend lines (%M/A), while the second one tracks their trailing sell stops in the “Off High” column. The “Action” column will signal a “Sell” once the -7.5% point is taken out in the “Off High” column.
3. Domestic Trend Tracking Indexes (TTIs)
Our Trend Tracking Indexes (TTIs) retreated from last week’s high and closed as follows:
Domestic TTI: +3.05% (last Friday +4.21%)
International TTI: +3.05% (last Friday +5.20%)
Have a nice weekend.
Ulli…
Disclosure: I am obliged to inform you that I, as well as advisory clients of mine, own some of these listed ETFs. Furthermore, they do not represent a specific investment recommendation for you, they merely show which ETFs from the universe I track are falling within the guidelines specified.
————————————————————-
READER Q & A FOR THE WEEK
All Reader Q & A’s are listed at our web site!
Check it out at:
http://www.successful-investment.com/q&a.php
A note from reader Joe:
Q: Ulli: If the bubble bursts, where do we need to be invested? Or do we need to be in cash?
A: Joe: The first move, once the Domestic Trend Tracking Index (TTI) breaks below its long-term trend line indicating an upcoming bear market, is to the safety of the money market funds, as markets tend to get extremely volatile during a severe correction.
Then we can then evaluate, without being emotionally attached, if there are any asset classes, such as bond ETFs that are rallying despite the equity meltdown. If that’s the case, we may get invested in those areas. If things look uncertain, we will remain safely on the sidelines until the fog clears.
———————————————————-
WOULD YOU LIKE TO HAVE YOUR INVESTMENTS PROFESSIONALLY MANAGED?
Do you have the time to follow our investment plans yourself? If you are a busy professional who would like to have his portfolio managed using our methodology, please contact me directly or get more details at:
https://theetfbully.com/personal-investment-management/
———————————————————
Back issues of the ETF/No Load Fund Tracker are available on the web at:
https://theetfbully.com/newsletter-archives/