ETF/No Load Fund Tracker Newsletter For August 22, 2014
ETF/No Load Fund Tracker StatSheet
————————————————————-
THE LINK TO OUR CURRENT ETF/MUTUAL FUND STATSHEET IS:
https://theetfbully.com/2014/08/weekly-statsheet-for-the-etfno-load-fund-tracker-newsletter-updated-through-08212014/
————————————————————
Market Commentary
Friday, August 22, 2014
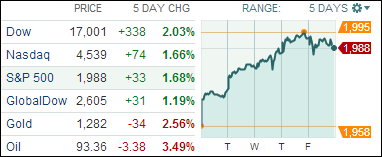
STOCKS SLUMP TO CLOSE OUT AN OTHERWISE PROFITABLE WEEK
[Chart courtesy of MarketWatch.com]
1. Moving the Markets
The Dow Jones lost 0.2%, the S&P 500 also fell 0.2% and the Nasdaq gained 0.1% on the day. Friday’s drag broke the four-day winning streak of the major benchmarks that saw the S&P 500 hit its 28th record close of the year and the Dow move back above the 17,000 mark.
Investors seem to continuously look for any clues on the timing of future interest rate hikes, but Yellen indicated today that the Fed’s decision about when to raise interest rates is particularly challenging and will depend on the speed of the economic recovery.
On the economy, a slow week for economic data showed housing data largely improved. Existing home sales rose 2.4% in July from June, the fourth consecutive increase and now at the highest level in nearly a year. The better-than-expected results were led by the increase in single-family sales.
And in international news, Russia was back in the headlines as we heard today from NATO that it had seen large transfers of advanced weapons and an “alarming build-up” of Russian forces near Ukraine. Trucks carrying what Russia says is humanitarian aid crossed the border into Ukraine, whose government said the move amounted to an invasion because the convoy advanced without its consent. We can only look to next week to see what surprises may arise around this conflict.
2 of our 10 ETFs in the Spotlight managed to gain today while making new highs for the year.
2. ETFs in the Spotlight
In case you missed the announcement and description of this section, you can read it here again.
It features 10 broadly diversified ETFs from my HighVolume list as posted every Monday. Furthermore, they are screened for the lowest MaxDD% number meaning they have been showing better resistance to temporary sell offs than all others over the past year.
Here are the 10 candidates:
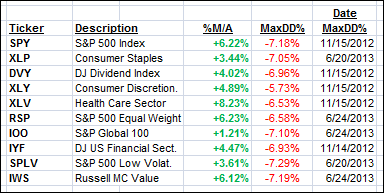
All of them are currently in “buy” mode, meaning their prices are above their respective long term trend lines by the percentage indicated (%M/A).
Year to date, here’s how the above candidates have fared so far:
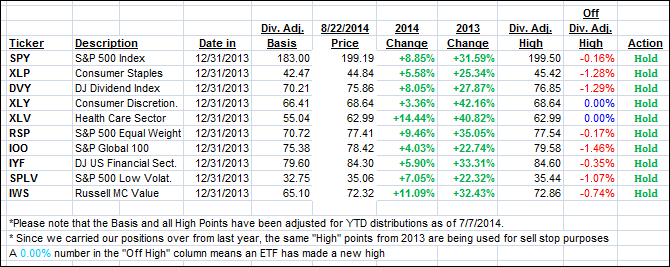
To be clear, the first table above shows the position of the various ETFs in relation to their respective long term trend lines (%M/A), while the second one tracks their trailing sell stops in the “Off High” column. The “Action” column will signal a “Sell” once the -7.5% point is taken out in the “Off High” column.
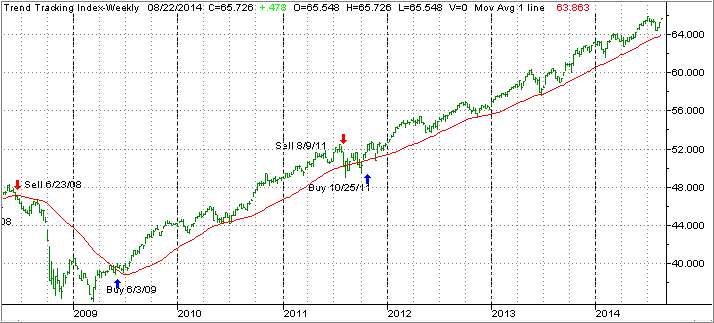
3. Domestic Trend Tracking Indexes (TTIs)
Our Trend Tracking Indexes (TTIs) stayed with the uptrend and closed higher for the week:
Domestic TTI: +2.87% (last Friday +2.29%)
International TTI: +2.15% (last Friday +1.30%)
Have a nice weekend.
Ulli…
Disclosure: I am obliged to inform you that I, as well as advisory clients of mine, own some of these listed ETFs. Furthermore, they do not represent a specific investment recommendation for you, they merely show which ETFs from the universe I track are falling within the guidelines specified.
————————————————————-
READER Q & A FOR THE WEEK
All Reader Q & A’s are listed at our web site!
Check it out at:
http://www.successful-investment.com/q&a.php
Reader Mark:
Q: Ulli: Thank you for a great web site. Just one question. Is the best time to buy or add additional positions into the Domestic and International funds is when your TTI green line gets close to the red moving averages? When is the best time to enter a position?
Thanks in advance for your reply.
A: Mark: Yes, ideally, you would add or establish new positions when the TTI green line is in close proximity to its red trend line.
However, that is not always practical, since it may take months for this to happen while we are in a bull market, and you’d be missing out on upside potential. A better way is to determine your risk tolerance, and then invest incrementally in the markets regardless of where the TTI stands. If you combine this with my recommended sell stop discipline, you’ll know exactly the risk you are taking with your portfolio at anytime.
Click on the below link to watch my video on this topic:
https://www.youtube.com/watch?v=9bMzdkYY-hk
———————————————————-
WOULD YOU LIKE TO HAVE YOUR INVESTMENTS PROFESSIONALLY MANAGED?
Do you have the time to follow our investment plans yourself? If you are a busy professional who would like to have his portfolio managed using our methodology, please contact me directly or get more details at:
https://theetfbully.com/personal-investment-management/
———————————————————
Back issues of the ETF/No Load Fund Tracker are available on the web at:
https://theetfbully.com/newsletter-archives/