
- Moving the market
The markets opened on a positive note following last week’s pullback. The chip sector played a significant role in driving stocks higher, with Nvidia gaining nearly 5% early on, while Broadcom and Micron added 2.9% and 9%, respectively.
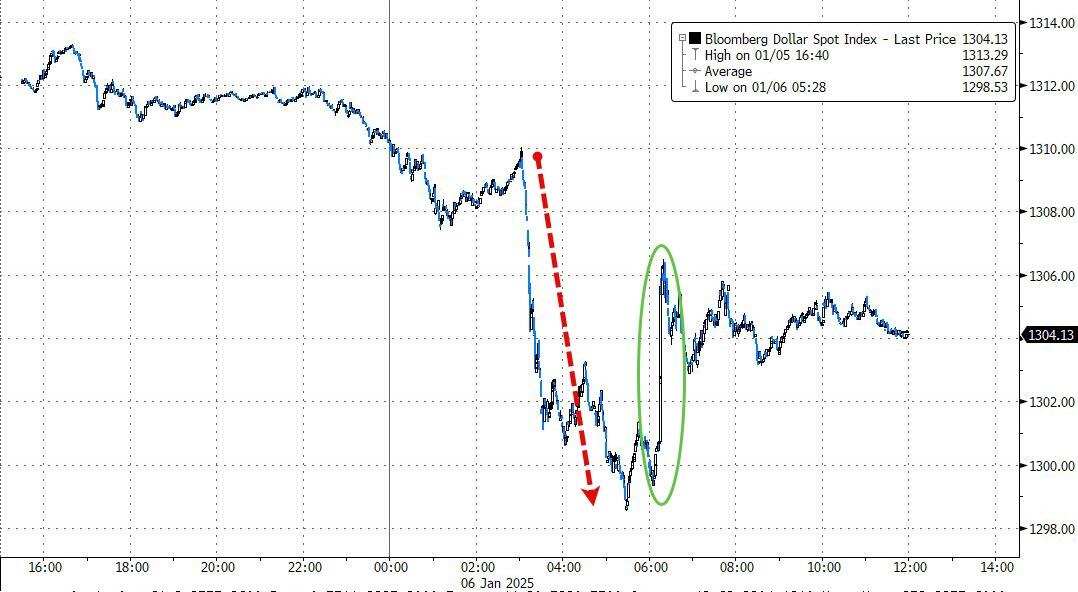
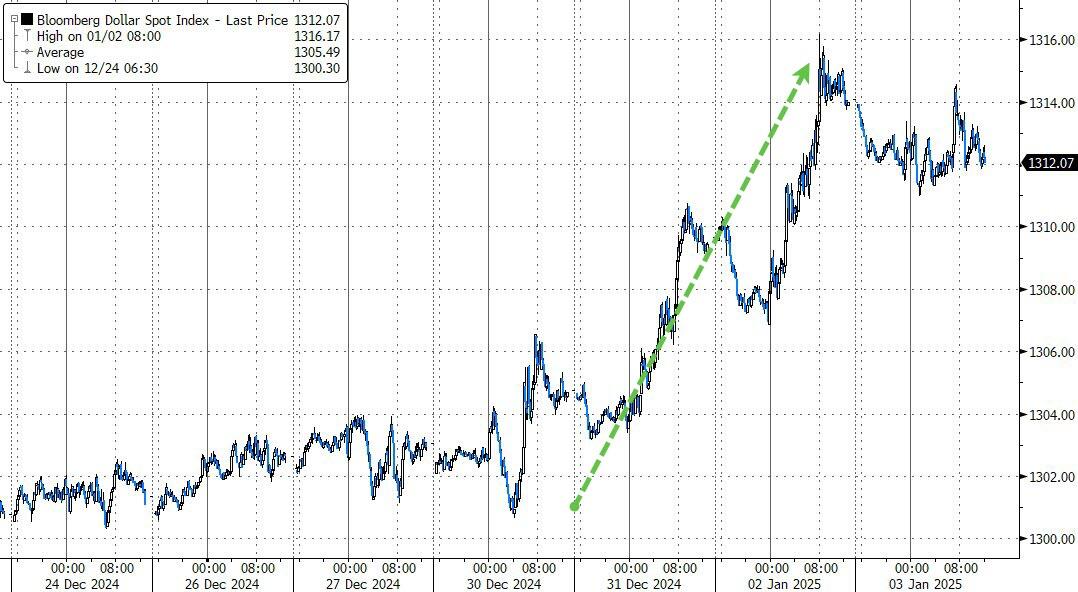
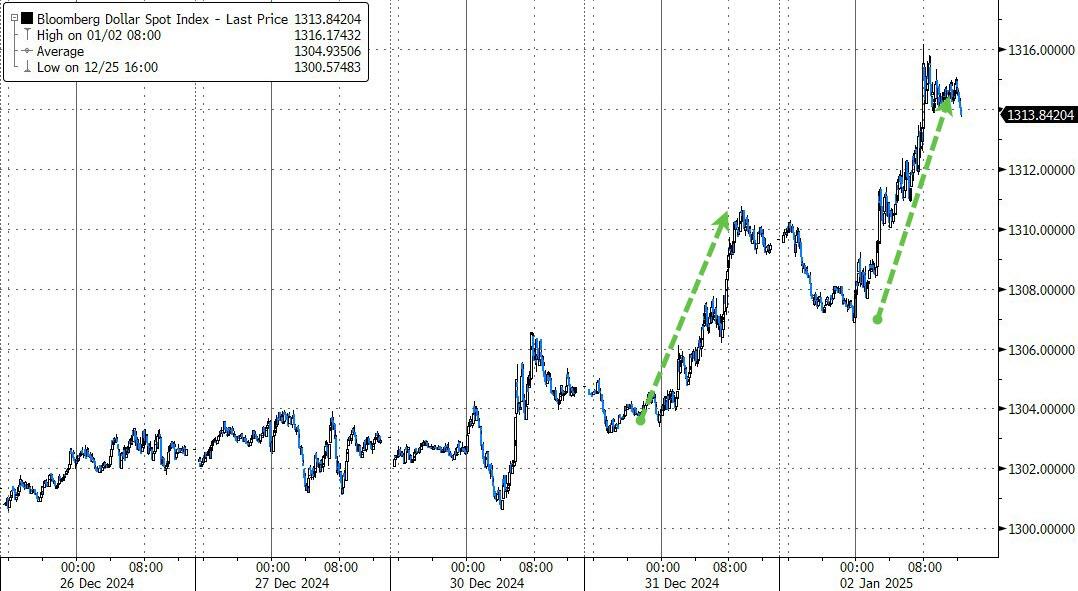
Early bullish sentiment was further supported by a Washington Post report suggesting that Trump’s tariff plan would be “narrower” than expected, targeting only critical imports. This marked a shift from campaign promises of “universal” tariffs in the 10%-20% range. However, this report turned out to be false, and the dollar recovered somewhat from an early sell-off.
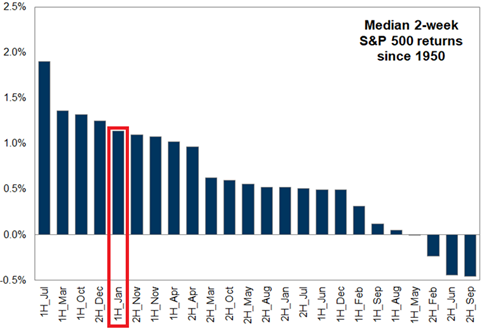
Despite this, automakers advanced as fears of a global trade war eased. Traders are now keen to see how the markets perform during the first five trading days of the year, a period historically seen as an indicator of the year’s overall market direction.
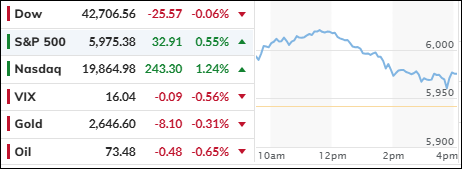
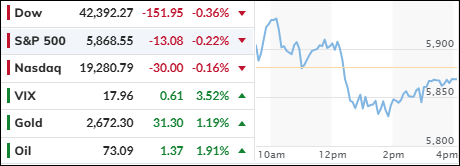
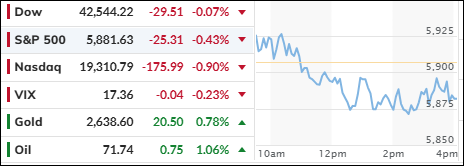
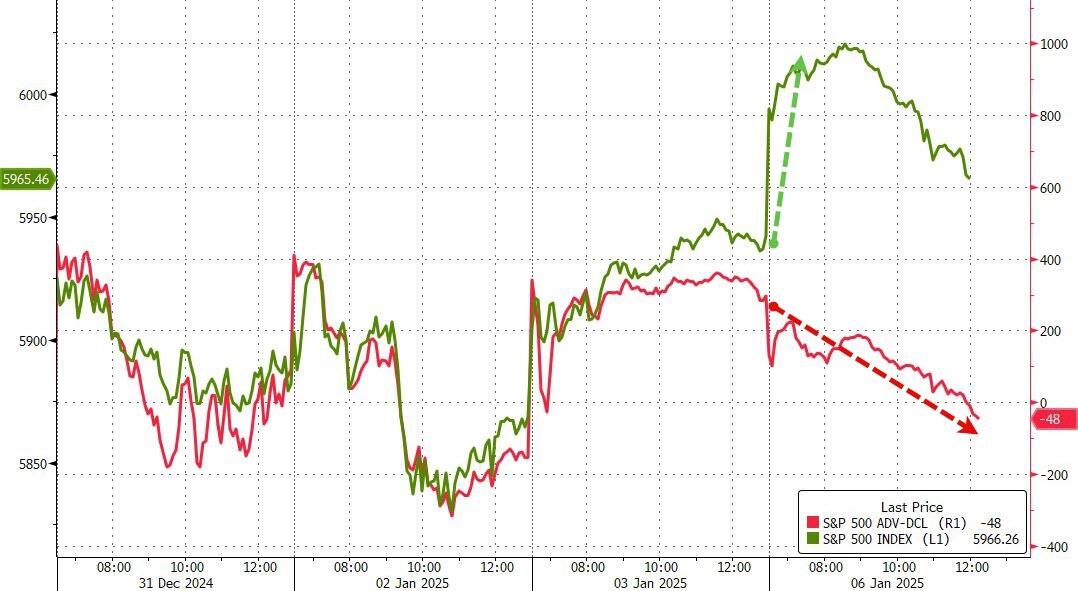
While the Dow lost its early momentum and closed roughly unchanged, the S&P 500 and Nasdaq managed to close in the green. However, the negative breadth, with more declining stocks than advancing ones, indicates underlying weakness, as only a small number of S&P members contributed to the upswing.
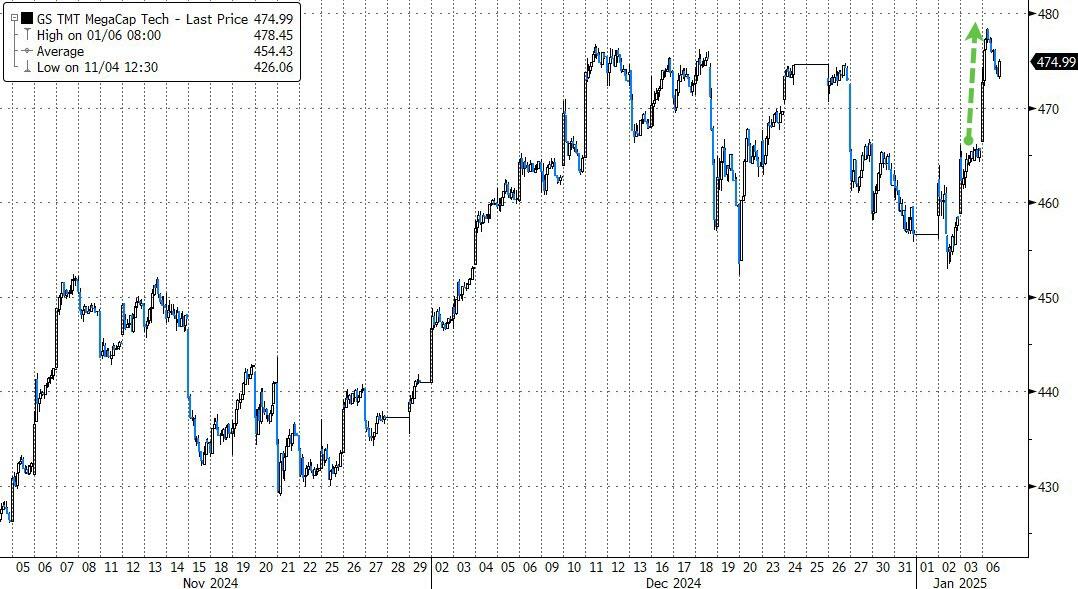
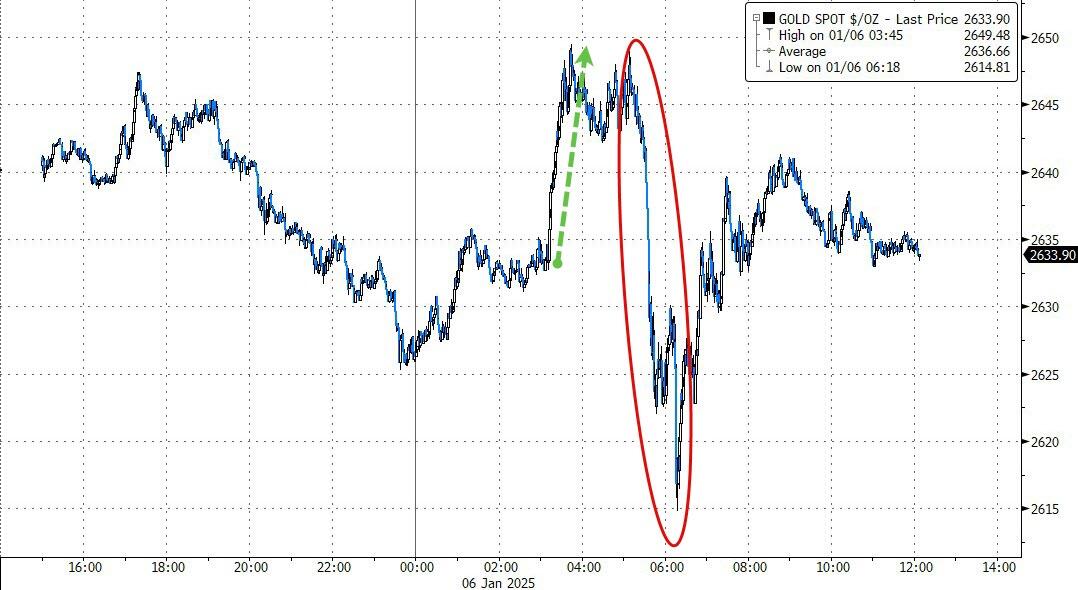
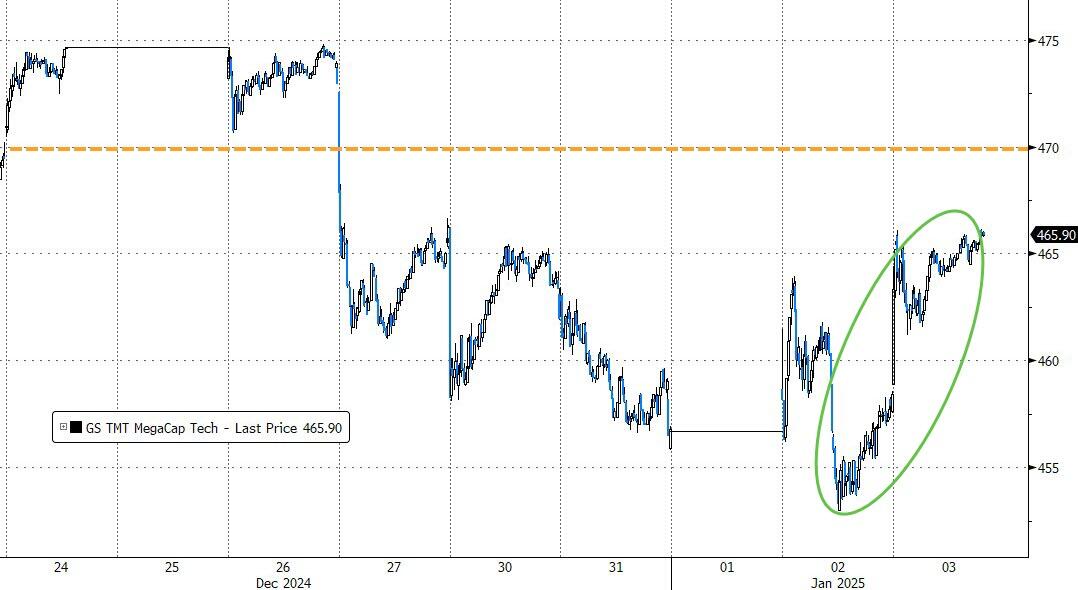
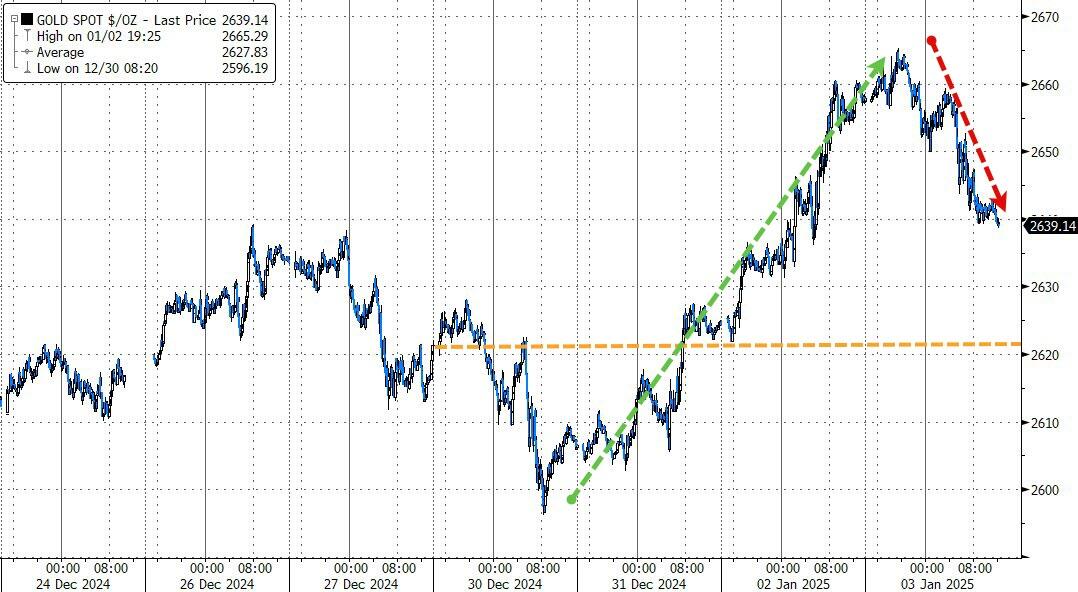
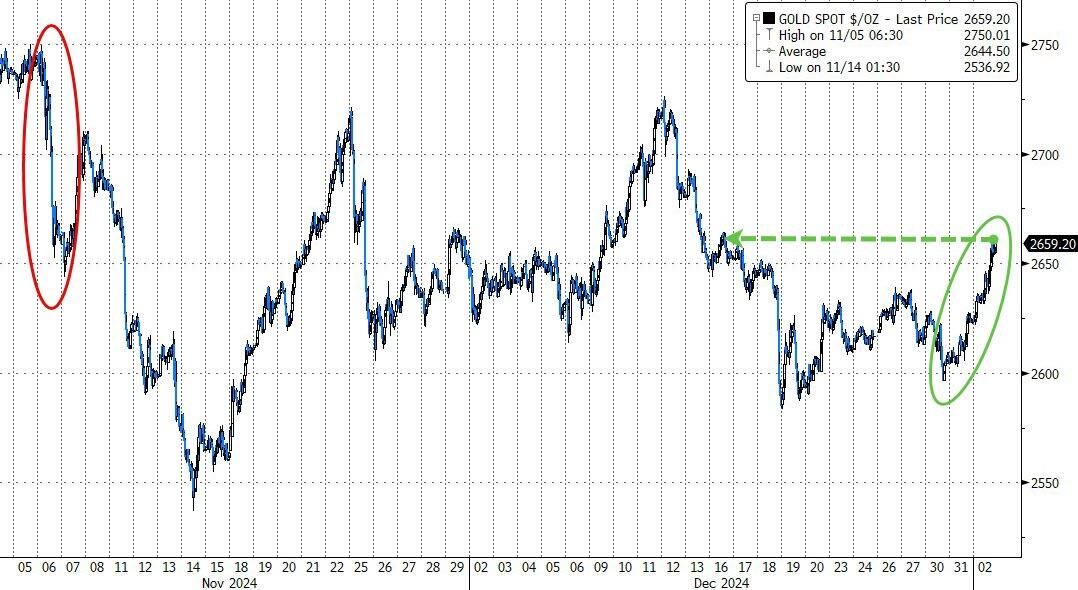
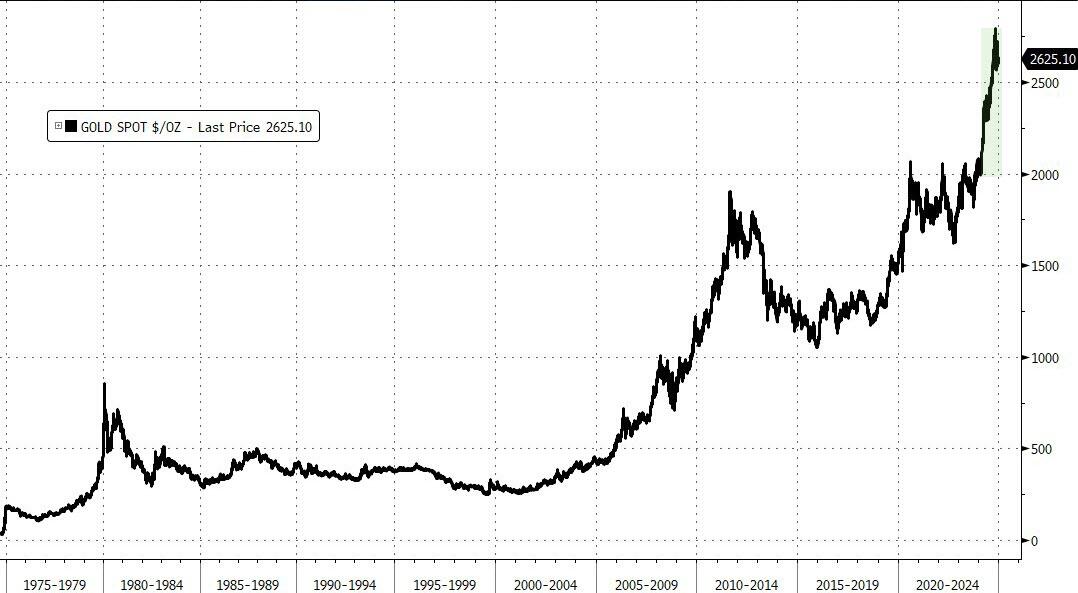
The Mega-Cap tech sector reached new record highs today but faded by the end of the session. Gold struggled to find support after an early drop and failed to close in the green.
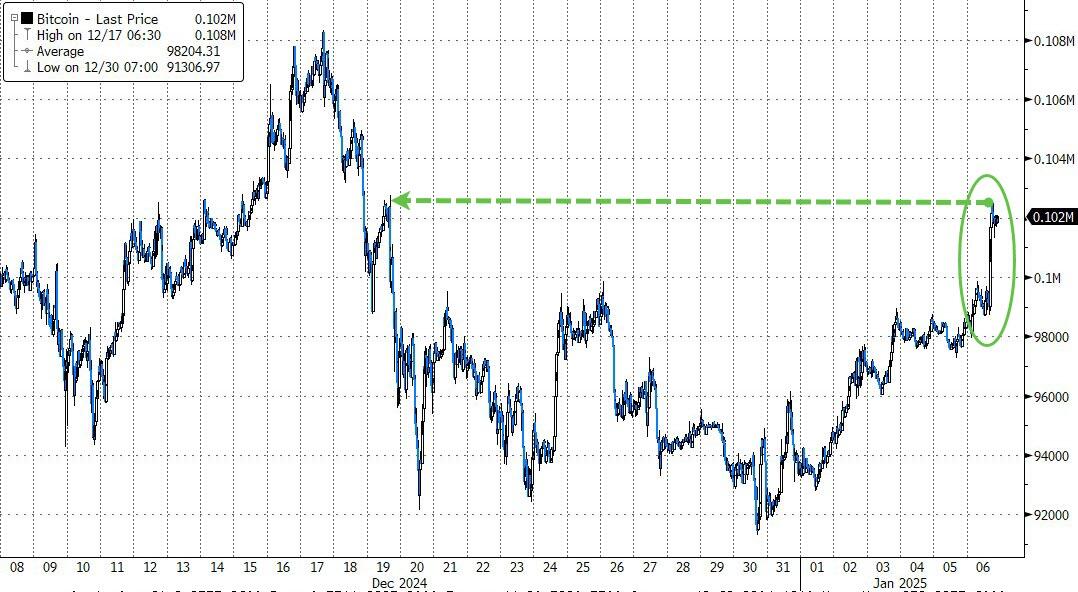
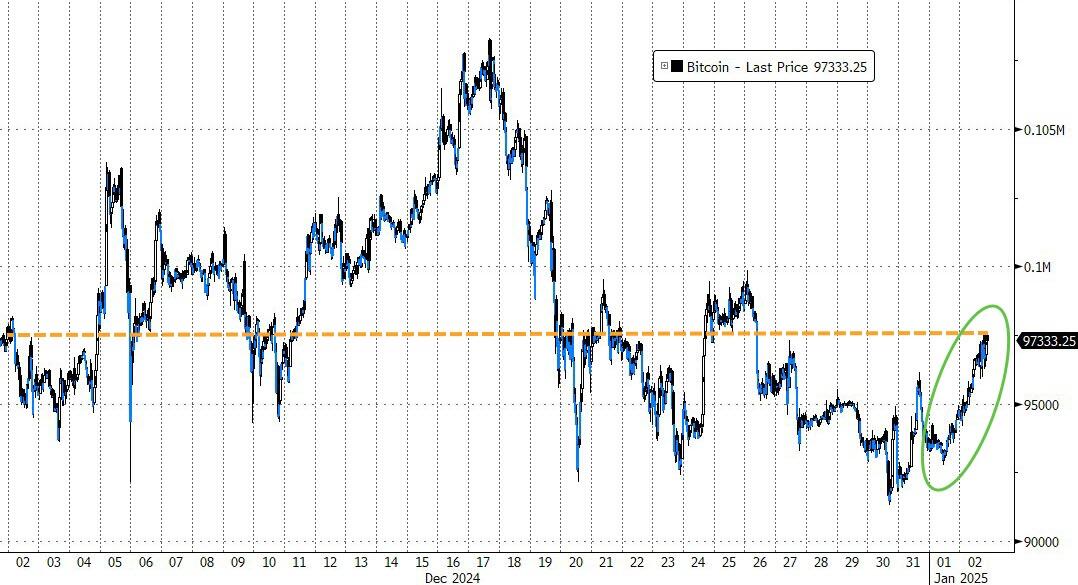
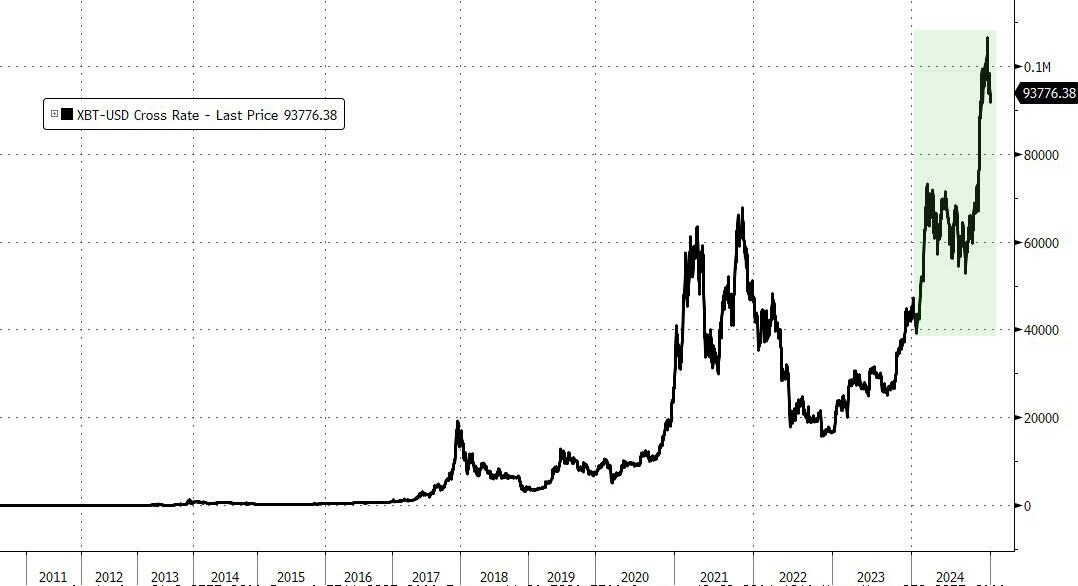
Meanwhile, Bitcoin surged, peaking at $102,000, its highest level in three weeks. With the incoming administration being extremely Bitcoin-friendly, a new all-time high could be on the horizon.
Read More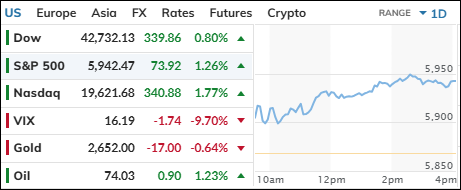
