ETF/No Load Fund Tracker Newsletter For January 16, 2015
ETF/No Load Fund Tracker StatSheet
————————————————————-
THE LINK TO OUR CURRENT ETF/MUTUAL FUND STATSHEET IS:
https://theetfbully.com/2015/01/weekly-statsheet-for-the-etfno-load-fund-tracker-newsletter-updated-through-01152015/
————————————————————
Market Commentary
Friday, January 16, 2015
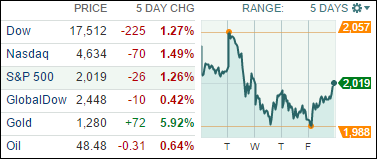
STOCKS BREAK FIVE-DAY LOSING STREAK TO END THE WEEK
[Chart courtesy of MarketWatch.com]
1. Moving the Markets
Stocks broke out of a slump today as we saw the Dow gain almost 200 points. While the comeback was well received, it was not enough to keep all three major indexes out of negative territory for the week.
In economic news, retail sales in December fell 0.9% from November, which was worse than expected, although most of the decline was due to falling gasoline prices. However, results excluding gas prices still declined slightly, contrary to expectations for a modest increase. Compared with the year prior, retail sales are up 4.1%.
Fourth-quarter earnings season is picking up into the busiest period. So far results have been good, and analysts believe solid earnings growth should continue into 2015 on the back of strengthened consumer attitudes and employment growth.
Coming up next week, markets are closed for Martin Luther King Jr. Day on Monday, and it is a rather slow week for economic data. Housing activity will likely be in focus with the release of housing starts, the FHFA house price index, and existing home sales. Perhaps most of the focus will be on Europe, as the European Central Bank is widely anticipated to announce additional monetary easing in the form of bond purchases on Thursday.
For a change, all of our 10 ETFs in the Spotlight headed north joining the major indexes; Healthcare (XLV) took the top spot with a gain of +1.88% for the day. 4 of the 10 ETFs listed are now on the plus side YTD as section 2 below shows.
2. ETFs in the Spotlight
In case you missed the announcement and description of this section, you can read it here again.
It features 10 broadly diversified ETFs from my HighVolume list as posted every Monday. Furthermore, they are screened for the lowest MaxDD% number meaning they have been showing better resistance to temporary sell offs than all others over the past year.
Here are the 10 candidates:
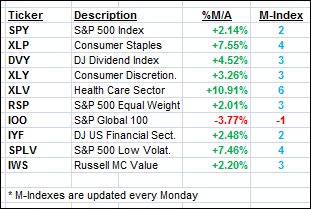
The above table simply demonstrates the magnitude with which some of the ETFs are fluctuating in regards to their positions above or below their respective individual trend lines (%M/A). A break below, represented by a negative number, shows weakness, while a break above, represented by a positive percentage, shows strength.
For more ETF/Mutual fund choices, be sure to reference Thursday’s StatSheet.
Year to date, here’s how the above candidates have fared so far:
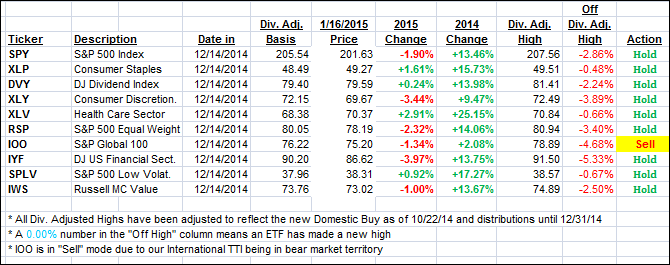
Again, the first table above shows the position of the various ETFs in relation to their respective long term trend lines (%M/A), while the second one tracks their trailing sell stops in the “Off High” column. The “Action” column will signal a “Sell” once the -7.5% point has been taken out in the “Off High” column.
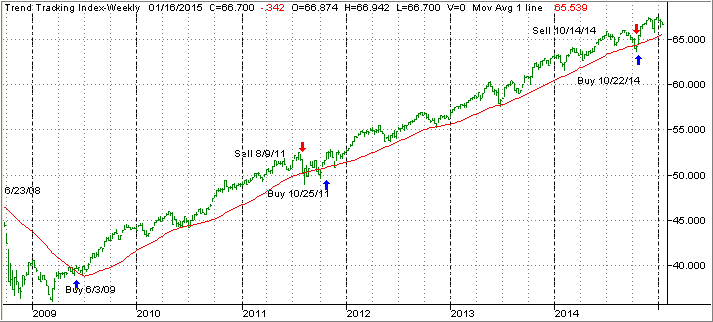
3. Trend Tracking Indexes (TTIs)
For the week, our Trend Tracking Indexes (TTIs) seemed to have barely changed but when viewed on a daily basis we saw quite some volatility which, in the end, was neutralized due to today’s rebound.
Here’s how we ended this week:
Domestic TTI: +2.20% (last Friday +2.43%)—Buy signal since 10/22/2014
International TTI: -1.93% (last Friday -2.19%)—New Sell signal effective 12/15/14
Have a nice weekend.
Ulli…
Disclosure: I am obliged to inform you that I, as well as advisory clients of mine, own some of these listed ETFs. Furthermore, they do not represent a specific investment recommendation for you, they merely show which ETFs from the universe I track are falling within the guidelines specified.
————————————————————-
READER Q & A FOR THE WEEK
All Reader Q & A’s are listed at our web site!
Check it out at:
http://www.successful-investment.com/q&a.php
Reader Chris:
Q: Ulli: I have a question re: the ETF XLV. The XLV is one of your listed Top 10 Spotlight funds and quite a good one for the last several years. I read that it has a low Beta, which I like. My question is with the recent shift in power in the US Senate and Congress toward the GOP, if someday Obamacare does get repealed (or even just the threat of it), could this once considered relatively low risk – low beta XLV then become much more volatile with probable downside to its price?
Thanks and best regards.
A: Chris: Yes, XLV has been a great performer, which we have held for a long time. During the recent October market debacle, I ended up selling and repurchasing it after the whipsaw signal we experienced.
Sure, there is a possibility that XLV will suffer if Obamacare gets repealed. Should that happen, I will follow the same approach that I always do, namely let market activity determine my course of action, just as mentioned above.
There is no sense in worrying what might or might not happen, simply let the trends be your guide and apply your trailing sell stops when necessary. In the meantime, I expect to get some more mileage out of this holding.
———————————————————-
WOULD YOU LIKE TO HAVE YOUR INVESTMENTS PROFESSIONALLY MANAGED?
Do you have the time to follow our investment plans yourself? If you are a busy professional who would like to have his portfolio managed using our methodology, please contact me directly or get more details at:
https://theetfbully.com/personal-investment-management/
———————————————————
Back issues of the ETF/No Load Fund Tracker are available on the web at:
https://theetfbully.com/newsletter-archives/