Stocks Rise After Flip-Flopping, But Tech Giants Face Valuation Challenge

Ulli Market Commentary Contact

[Chart courtesy of MarketWatch.com]

  1. Moving the markets

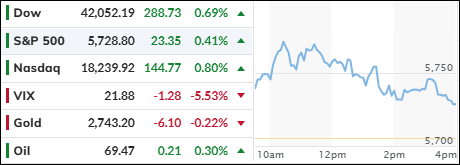
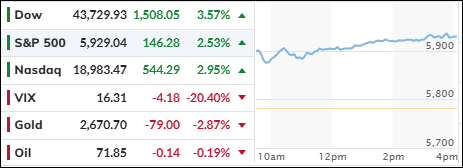
Stocks finally decided to go up on Tuesday, after changing their minds a few times, as investors paid attention to the latest earnings reports and bond yields.

The 10-year yield stayed away from the scary 5% mark, which was a relief for everyone. Coca-Cola made more money than expected, and its stock jumped more than 3%. Spotify also did well, and its stock soared 9% after the music streaming giant impressed everyone with its third-quarter results.

Some big tech names like Alphabet and Microsoft will announce their earnings after the market closes. Others like Amazon and Meta will do so later this week.

But one analyst thinks that even if these tech giants beat expectations, they are still overvalued and overhyped. He said that their prices are too high for what they offer, and that this situation will not end well for anyone. He sounded like a party pooper. We don’t know if he is right or wrong. We’ll have to wait and see what happens.

For now, the bulls managed to push the market higher, thanks to a clever move that squeezed the shorts out of the game. The major indexes ended the day in green, which was a nice change.

About 23% of S&P 500 companies have reported their earnings so far, and 77% of them have done better than the low expectations.

Bond yields were mixed, as the 30-year went back below 5%. The dollar bounced back from yesterday’s fall, while gold was unchanged in the U.S. but hit a new high in Japan. Crude oil got a spanking before tonight’s data, which dragged down the energy sector as well.

Bloomberg said that gold’s big rally since Hamas attacked Israel was linked to oil prices, which means some traders are worried about stagflation.

Central Banks’ balance sheets are supposed to predict the direction of stock markets. If they grow, it’s good for stocks. If they shrink, it’s bad for stocks. According to this chart, they are shrinking right now.

Does that mean the bear market is about to worsen?

Read More

Treasury Yields Play Hide And Seek With 5%, Stocks End Lower

Ulli Market Commentary Contact

[Chart courtesy of MarketWatch.com]

  1. Moving the markets

Monday was another wild ride for the stock market, as Treasury yields played peek-a-boo with the 5% mark. The 10-year note briefly crossed that threshold, only to retreat when hedge fund honcho Bill Ackman revealed that he had cashed out his bond shorts (with a nice profit) and warned that the economy was cooling off faster than expected.

That sent the bond yield plunging to 4.846%, the biggest intraday swing since the March meltdown. Stocks tried to cheer up, but only the Nasdaq managed to end in the green, while the rest of the market stayed in the red.

Interest rates have been on a tear lately, with the 10-year breaking above 5% for the first time since July 2007. Fed chair Powell’s hawkish remarks added fuel to the fire, as investors worried that monetary policy could tighten further and hurt equities. 5% is a big deal for Wall Street, as it signals that investors are losing faith in the Fed’s ability to cut rates soon. I wouldn’t be surprised if the 10-year yield keeps climbing higher.

In other news:

  • Tech giants are gearing up to report their earnings this week, hoping to impress traders and lift the market mood.
  • NVDA threw some shade at Intel by announcing its own PC chips.
  • The dollar took a dive and gave back half of its recent gains.
  • Crude oil gave up some ground, while gold flirted with $2,000 but closed lower.

Financial conditions are getting tighter, but we don’t know how bad it will get. Will earnings season save the day for stocks, or is it just a pipe dream?

Read More

ETFs On The Cutline – Updated Through 10/20/2023

Ulli ETFs on the Cutline Contact

Do you want to know which ETFs are hot and which ones are not? Then you need my High-Volume ETF Cutline report. It tells you how close or far each of the 311 ETFs I follow is from its long-term trend line (39-week SMA). These are the ETFs that trade more than $5 million a day, so they are not some obscure funds that nobody cares about.

The report is split into two parts: The winners that are above their trend line (%M/A), and the losers that are below it. The yellow line is the line of shame that separates them. You can see how many ETFs are in each group and how they have changed since the last report (69 vs. 51 current).

Take a peek:

The HV ETF Master Cutline Report

If you are confused by some of the terms we use, don’t panic. I have a helpful Glossary of Terms for you.

If you want to learn more about the Cutline method and how it can make you rich (or at least less poor), read my original post here.

ETF Tracker Newsletter For October 20, 2023

Ulli ETF Tracker Contact

ETF Tracker StatSheet          

You can view the latest version here.

BOND YIELDS RISE TO 5%, STOCKS DROP TO NEW LOWS

[Chart courtesy of MarketWatch.com]

  1. Moving the markets

Stocks got another slap in the face Friday, as traders freaked out over the 10-year Treasury yield flirting with 5%, a level that spells trouble for the economy and the stock market.

Higher yields mean higher borrowing costs for consumers and businesses, and more competition for stocks from bonds. The 10-year yield hit 5% for the first time since 2007 on Thursday and closed at 4.922% today. That’s like seeing your ex at a party with someone new.

The stock market is giving the side-eye to the bond market and doesn’t like what it sees. Yields are rising, even though inflation is officially not that bad. This is the main reason why stocks are weak and may get weaker.

The S&P 500, after bouncing back from its third-quarter slump, failed to break above its 50-day moving average, which functioned as a glass ceiling. It reversed course and fell below its 200-day moving average today by a hair, a sign of long-term weakness. If this continues, we may see stocks go down the drain.

Regional banks also suffered in the session, with the regional banking ETF (KRE) dropping almost 2%. Adding insult to injury, Fed Chair Powell said yesterday that inflation is still too high, and the economy may need to slow down to tame it. Powell also said he thinks rates are not too high now.

We saw some crazy moves in bond yields this week, with the 2-year yield rising only slightly while the 30-year yield soared. This means that we are moving from an inverted yield curve, which usually comes before recessions, to a steepening yield curve, which means that the recession may be closer than we think. History may not repeat itself, but it often rhymes.

Also, financial conditions are getting tighter, as this chart shows, and this may drag down the economy.

None of this was good for stocks, and the major indexes plunged and closed at their lowest levels for the week. The Nasdaq took the biggest hit, losing 3%.

There were no signs of life from the short-squeeze crowd, and their hopes were dashed in October. Crude oil rallied all week but gave back some gains today.

Gold was the star of the week, surging and almost reaching its $2k level. Are investors finally waking up to the fact that in times of stress, uncertainty, debt and deficits, precious metals are the ultimate safe haven?

Read More

Weekly StatSheet For The ETF Tracker Newsletter – Updated Through 10/19/2023

Ulli ETF StatSheet Contact

ETF Data updated through Thursday, October 19, 2023

How to use this StatSheet:

  1. Out of the 1,800+ ETFs out there, I only pick the ones that trade over $5 million per day (HV ETFs), so you don’t get stuck with a lemon that nobody wants to buy or sell.
  1. Trend Tracking Indexes (TTIs)

These are the main indicators that tell you when to buy or sell Domestic and International ETFs (section 1 and 2). They do that by comparing their position to their long-term M/A (Moving Average). If they cross above, and stay there, it’s a green light to buy. If they fall below, and keep going, it’s a red light to sell. And to make sure you don’t lose your shirt if things go south, I also use a 12% trailing stop loss on all positions in these categories.

  1. All other investment areas don’t have a TTI and should be traded based on the position of each ETF relative to its own trend line (%M/A). That’s why I call them “Selective Buy.” In other words, if an ETF goes above its own trend line, you can buy it. But don’t forget to use a trailing sell stop of 12%, or less if you’re feeling nervous.

If some of these words sound like Greek to you, please check out the Glossary of Terms and new subscriber information in section 9.

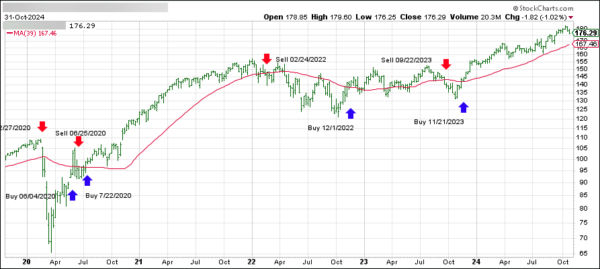
  1. DOMESTIC EQUITY ETFs: SELL— since 09/22/2023

Click on chart to enlarge

This is our main compass, the Domestic Trend Tracking Index (TTI-green line in the above chart). It has now broken below its long-term trend line (red) by -4.47% and has moved into “Sell” mode effectively 9/22/2023.

Read More

Market Loses Hope After Powell’s Speech: Inflation And Interest Rates Bite

Ulli Market Commentary Contact

[Chart courtesy of MarketWatch.com]

  1. Moving the markets

The stock market had a bad day on Thursday, thanks to Fed chair Powell’s party-pooper speech. He said that inflation was still too high for comfort, and that the economy might have to slow down a bit to cool it off. He basically said:

We’re doing a great job at creating jobs and keeping prices stable. But, by the way, inflation is still too high.

That was enough to scare away the investors who were hoping for some dovish signals from the Fed. The market reversed course and wiped out the gains from the midday rally. The major indexes ended up in the red, with some of them hitting new lows for the year.

Meanwhile, the bond market was also feeling the heat. The 10-year Treasury yield climbed to almost 5%, a level not seen since 2007. That raised doubts about how the Fed would handle the rising interest rates and their impact on the economy.

The economic data was mixed, as usual. On one hand, initial jobless claims were below 200,000, showing that the labor market was still strong. On the other hand, continuing claims rose to their highest level since July, suggesting that some workers were having trouble finding new jobs.

The earnings season also had its ups and downs. Tesla shares tanked more than 9% after the electric car maker missed Wall Street’s expectations on both earnings and revenue. Netflix shares soared more than 14% after the streaming service beat analysts’ estimates on both earnings and subscribers.

The oil market was on fire, literally and figuratively. Crude oil prices surged to new highs, as supply disruptions and geopolitical tensions kept the market on edge.

Gold and silver also gained, as investors sought safe havens from the market turmoil. The US dollar slipped, as confidence in the US economy waned. And the US Leading Indicator dropped for the 18th consecutive month. Ouch indeed!

So, what does all this mean for the market outlook? Well, as this chart shows, it’s not pretty. The market is caught between a rock and a hard place: inflation and interest rates on one side, and economic growth and earnings on the other.

The Fed and global events are adding to the uncertainty and volatility. The market is clearly in a bearish mood, but can it turn around? Or will it keep sliding down? That’s the million-dollar question.

Continue reading…

2. “Buy” Cycle (12/1/22 to 9/21/2023)

The current Domestic Buy cycle began on December 1, 2022, and concluded on September 21, 2023, at which time we liquidated our holdings in “broadly diversified domestic ETFs and mutual funds”.

Our International TTI has now dipped firmly below its long-term trend line, thereby signaling the end of its current Buy cycle effective 10/3/23.

We have kept some selected sector funds. To make informed investment decisions based on your risk tolerance, you can refer to my Thursday StatSheet and Saturday’s “ETFs on the Cutline” report.

Considering the current turbulent times, it is prudent for conservative investors to remain in money market funds—not bond funds—on the sidelines.

3. Trend Tracking Indexes (TTIs)

The market was optimistic that Fed chair Powell would signal a softer stance on interest rates in his speech at the Economic Club. This led to a brief surge in the middle of the day, but it quickly faded when Powell said that inflation was still too high. His words burst the market’s bubble and sent the major indexes plunging into the red.

Our TTI’s also took a hit and are now firmly in the bearish zone.

This is how we closed 10/19/2023:

Domestic TTI: -4.47% below its M/A (prior close –3.24%)—Sell signal effective 9/22/2023.

International TTI: -2.11% below its M/A (prior close -1.37%)—Sell signal effective 10/3/2023.

All linked charts above are courtesy of Bloomberg via ZeroHedge.