
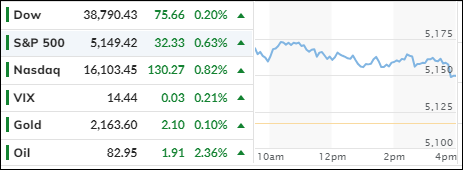
[Chart courtesy of MarketWatch.com]
- Moving the markets
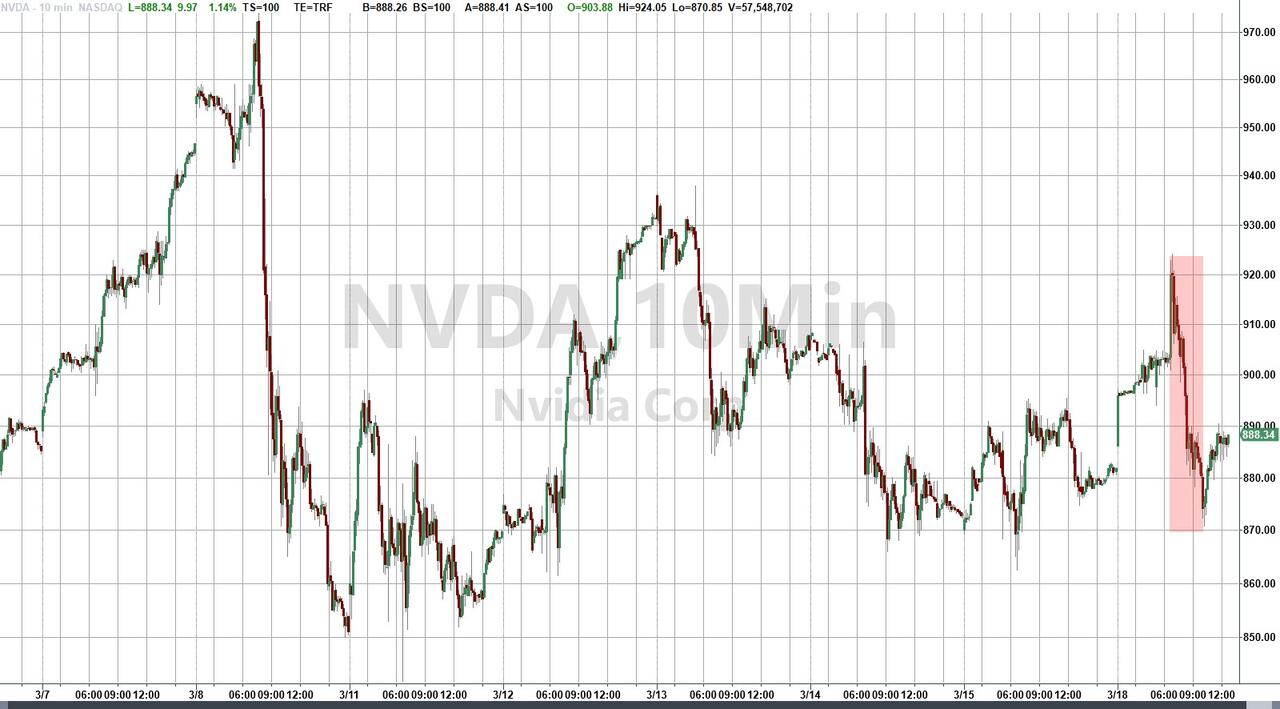
On a manic Monday, the stock market got a jolt of energy, with Nvidia leading the charge like a caffeinated squirrel. As Wall Street’s eyes are glued to an upcoming AI extravaganza and the Fed’s crystal ball for future money moves, Nvidia’s shares did a little happy dance, jumping over 4% in anticipation of their GTC Conference. Here, they’re set to unveil their AI wizardry, and the crowd goes wild, with analysts throwing price targets around like confetti—one even sees a whopping 34% pot of gold at the end of the Nvidia rainbow.
Meanwhile, Alphabet’s shares boogied up 7%, their best performance in a year, on whispers of Apple cozying up to Google for some AI magic in iPhones. This tech tango comes after a fortnight of the S&P 500 and Nasdaq playing hard to get, while the Dow has been nursing a three-week hangover.
The Fed’s Open Market Committee is about to roll the dice in their March meeting. The two-day financial fiesta starts Tuesday, with the grand reveal on Wednesday. February’s hotter-than-a-jalapeño inflation numbers have left investors sweating, wondering if the Fed will play it cool or keep the interest rate heat on high.
As for the Fed funds futures, they’re betting a 99% chance that the interest rate party won’t stop this week. But the June rate cut rumors have cooled off to a lukewarm 55%.
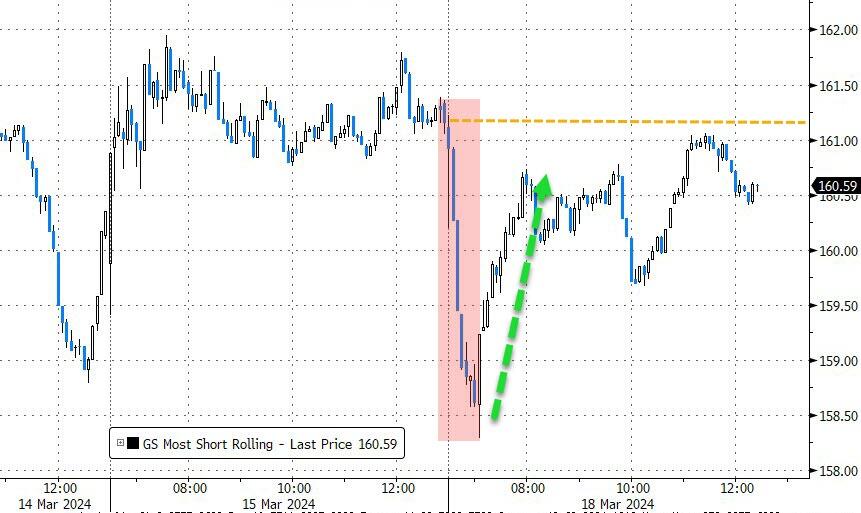
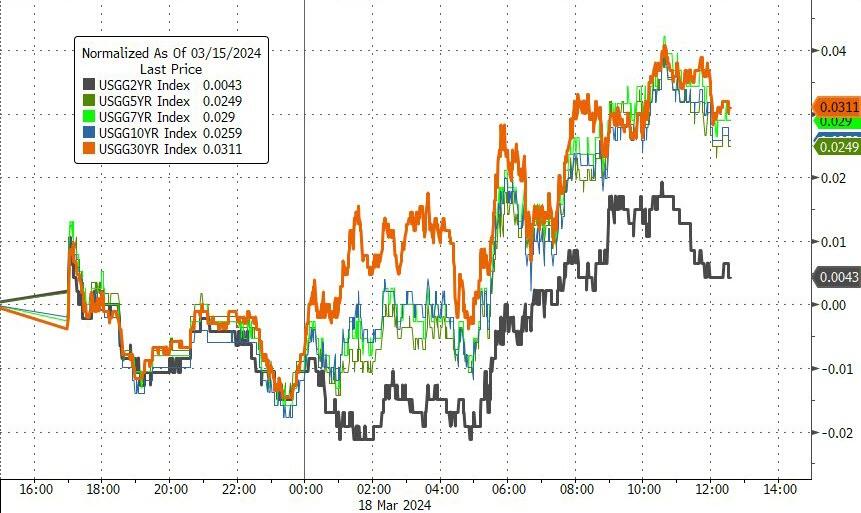
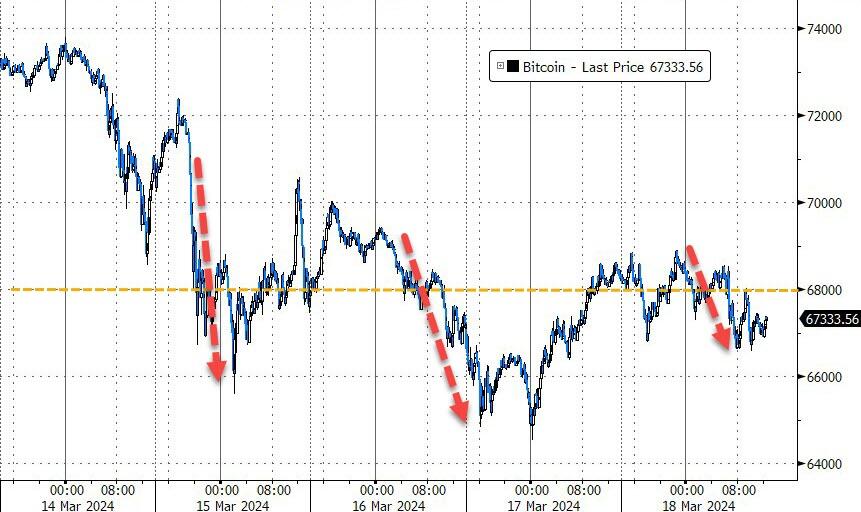
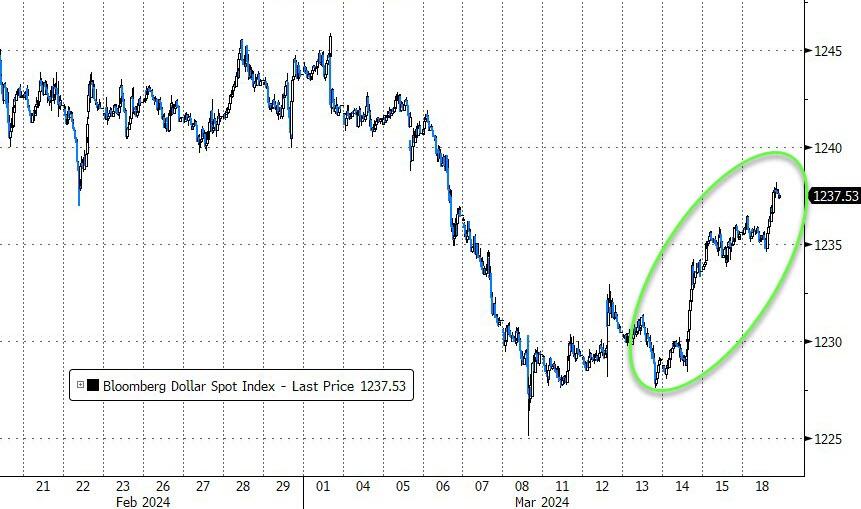
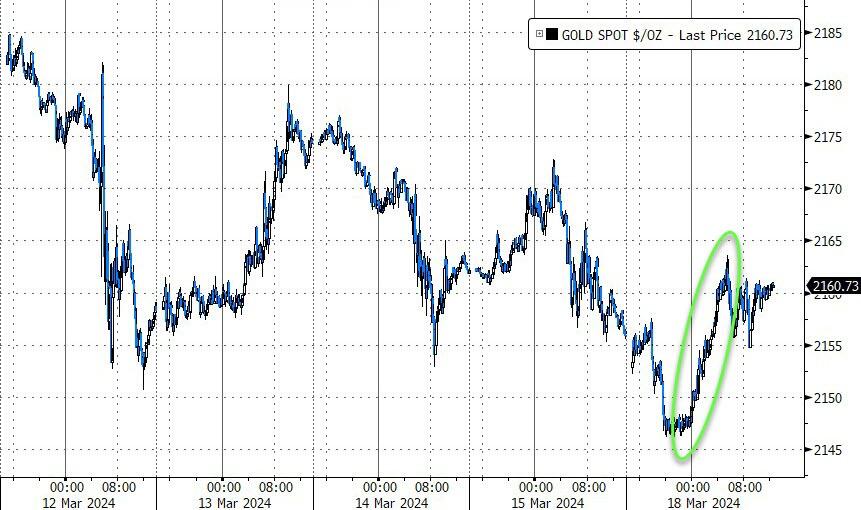
In a plot twist, the most shorted stocks took a nosedive but then rocketed like they had FOMO, only to run out of steam by closing time. Treasury yields strutted higher, Bitcoin lost its groove below $68k, the dollar flexed its muscles, and gold just chilled.
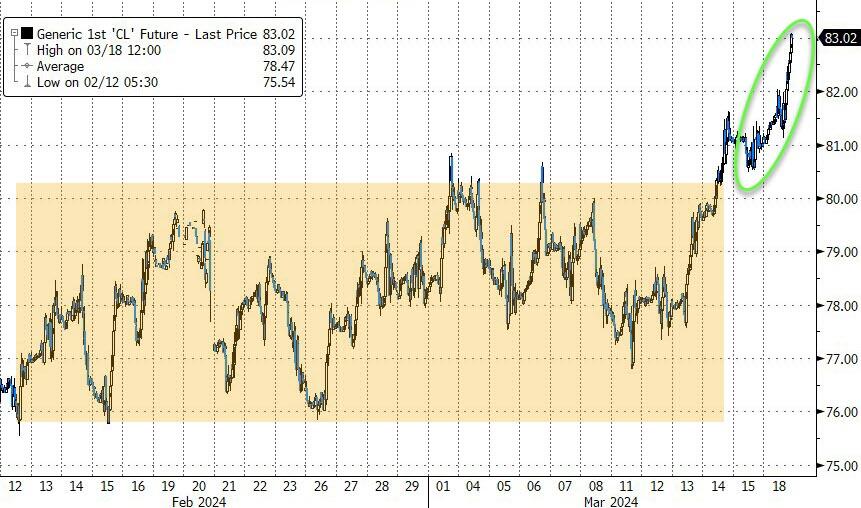
Oil prices, on the other hand, turned up the heat on hopes of China’s growth spurt, Russia’s refinery drama, and Iraq’s pinky promise to stick to OPEC+’s production diet.
So, as traders don their fortune-teller hats for the Fed’s next move, one can’t help but wonder:
Will Powell cave to peer pressure and slash rates, or will he keep playing hardball?
2. Current “Buy” Cycles (effective 11/21/2023)
Our Trend Tracking Indexes (TTIs) have both crossed their trend lines with enough strength to trigger new “Buy” signals. That means, Tuesday, 11/21/2023, was the official date for these signals.
If you want to follow our strategy, you should first decide how much you want to invest based on your risk tolerance (percentage of allocation). Then, you should check my Thursday StatSheet and Saturday’s “ETFs on the Cutline” report for suitable ETFs to buy.
3. Trend Tracking Indexes (TTIs)
From the opening bell, optimism was evident as the major stock indexes consistently rose throughout the trading session.
Our TTIs showed mixed results; the domestic TTI experienced a slight decline, whereas the international TTI saw a small increase.
This is how we closed 3/18/2024:
Domestic TTI: +9.21% above its M/A (prior close +9.36%)—Buy signal effective 11/21/2023.
International TTI: +9.38% above its M/A (prior close +9.05%)—Buy signal effective 11/21/2023.
All linked charts above are courtesy of Bloomberg via ZeroHedge.
———————————————————-
WOULD YOU LIKE TO HAVE YOUR INVESTMENTS PROFESSIONALLY MANAGED?
Do you have the time to follow our investment plans yourself? If you are a busy professional who would like to have his portfolio managed using our methodology, please contact me directly to get more details.
—————————————————————-
Contact Ulli