New ETFs On The Block: Cambria Sovereign High Yield Bond ETF (SOVB)

Ulli Bond ETFs, Country ETFs Contact

91551519

With ten-year US Treasury yielding less than two percent, many investors – particularly the baby boomers and the retirees, are thirsty for higher returns from their fixed-income portfolios.

Unfortunately, with many developed economies turning to negative interest rates as a standard monetary policy tool, earning higher compensation for owning sovereign debt is becoming increasingly difficult.

Los Angeles based Cambria Investment Management, managed by alternative investment manager Meben Faber, recently launched its first fixed-income ETF to help meet investors’ craving for higher yields.

Read More

ETF/No Load Fund Tracker Newsletter For March 18, 2016

Ulli ETF Tracker Contact

ETF/No Load Fund Tracker StatSheet

————————————————————-

https://theetfbully.com/2016/03/weekly-statsheet-for-the-etfno-load-fund-tracker-newsletter-updated-through-03172016/

————————————————————

Market Commentary

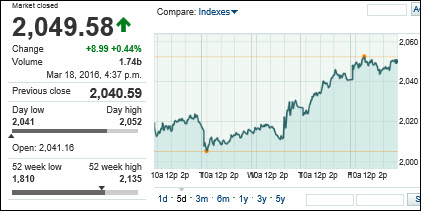
DOW POSTS SIX DAY STREAK; MARKETS ON A ROLL TO CLOSE THE WEEK

Fri pic 

[Chart courtesy of MarketWatch.com]

1. Moving the Markets

Stocks jumped Friday as Wall Street continued its recent rally with the Dow rising for a sixth straight day as it pushed further into positive territory for the year. The rally also boosted the S&P 500 back into the black for 2016 after briefly turning positive Thursday.

An improvement in oil prices has helped boost financial markets as benchmark U.S. crude jumped above $41 in early trading before pulling back. West Texas intermediate was trading flat at $40.20 a barrel after closing Thursday above $40 for the first time since early December. Oil is now up more than 50% since plunging to a 13-year low of $26.21 on Feb. 11.

Of course, the main driver for this week’s continuation to the upside has been the Fed’s decision not to normalize rates at this time but chose instead to cave in to Wall Street’s desire of an accommodating policy. To my way of thinking this will put the Fed into a tight corner when, not if, the next financial crisis develops and a lowering of rates, such as in 2008, will no longer be a rescue option. If your thinking is that these elevated market levels in no way represent underlying economic fundamentals, you are absolutely correct.

Be that as it may, we’re slowly inching towards a new potential Domestic Buy signal. You can review the exact numbers in section 3 below.

Read More

Weekly StatSheet For The ETF/No Load Fund Tracker Newsletter – Updated Through 03/17/2016

Ulli Market Commentary Contact

ETF/Mutual Fund Data updated through Thursday, March 17, 2016

TOC010716

If you are not familiar with some of the terminology used, please see the Glossary of Terms.


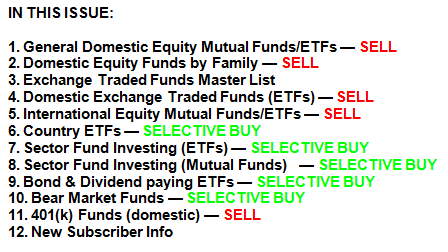
1. DOMESTIC EQUITY MUTUAL FUNDS/ETFs: SELL — since 11/13/2015

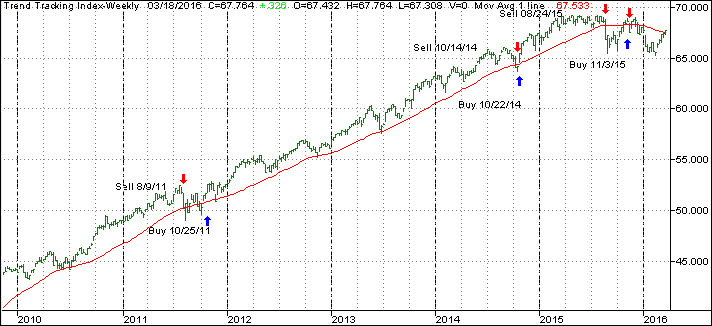
TTI

Our main directional indicator, the Domestic Trend Tracking Index (TTI-green line in above chart) has recently crawled above its long term trend line (red) and finally generated a new “Buy” signal effective 11/3/15. The market subsequently dropped, and we exited again on 11/13/15. As of today, the TTI has just crawled above its trend line by +0.29%. This is move is not enough to generate a new Buy signal. Stay tuned for daily updates and any changes to our position.

Read More

Crude Oil Drives Indexes

Ulli Market Commentary Contact

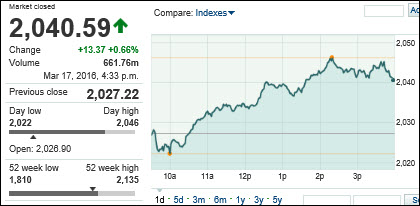
Thur pic

[Chart courtesy of MarketWatch.com]

1. Moving the Markets

Another rally in crude oil prices boosted energy, while residual goodwill after a dovish Federal Reserve meeting powered broader markets higher. Early in the day, the Dow Jones industrial average crossed into positive territory for the first time this year and stayed there, capping a remarkable comeback from Wall Street’s worst ever start to a year. The buying wave continued and, this afternoon, the S&P 500 index also crossed into positive territory for the first time this year.

Adding to the enthusiasm was the news that the Fed lowered its plan to two more quarter-point hikes this year, down from the four it had predicted previously. The new plan was more aligned with Wall Street analysts’ expectations. On the other hand, it’s a sad day to realize that the Fed considers economic conditions so deplorable that they’re fearful to even implement a meager 0.25% interest rate hike in an effort to finally get on track in normalizing rates.

Shares of Williams Sonoma (WSM) slid today after the company released disappointing sales and earnings figures for the holiday season. The wholesale retailer suffered a drop in both same-store and e-commerce sales at their key client Pottery Barn. Shares dropped 6.26%.

In corporate and economic news: Applications for unemployment benefits rose slightly last week, the Labor Department reported, but they remain at levels consistent with a healthy job market. Weekly jobless claims rose by 7,000 to a seasonally adjusted 265,000.

Read More

Fed Moves Markets—Domestic TTI Touches Its Trend Line

Ulli Market Commentary Contact

Wed pic

[Chart courtesy of MarketWatch.com]

1. Moving the Markets

U.S. stocks rallied modestly after the Federal Reserve left interest rates unchanged and signaled more gradual increases.Wall Street had expected the Fed to keep rates unchanged, but wanted clues as to the timing of the Fed’s next rate increase. The Fed lowered its plan to possibly two more hikes this year, down from four, for a total increase of 50 basis points, which is much more aligned with Wall Street analysts’ expectations.

Stocks have been in rally mode since mid-February, driven in part by corporate buy-backs, rebounding oil prices and a belief that the Fed may not be as aggressive with rate hikes as originally believed following early-year financial market turbulence and slowing growth abroad.

The recent oil price rally raised hopes among producers that the worst may be over when it comes to the slump that has persisted for 14 months now. Personally, I don’t think we’ve seen the lows for the year yet.

As a result, after months of torturous declines, energy stocks have been making a comeback as oil prices rallied from an oversold condition not unlike the stock market. The 40 energy stocks in the Standard & Poor’s 500, including Exxon Mobil (XOM), exploration company Range Resources (RRC) and pipeline company Kinder Morgan(KMI), have put $209 billion back into the pockets of investors since oil prices hit rock bottom on Jan. 20. Let’s see how long this rebound can last in the face of overproduction, slowing global demand and storage facilities that are close to reaching their limit.

With today’s rebound, our Domestic Trend Tracking Index (TTI) touched its long-term trend line. Please see section 3 below for details.

Read More

Waiting For The Fed

Ulli Market Commentary Contact

Tue pic

[Chart courtesy of MarketWatch.com]

1. Moving the Markets

Stocks ended at par today as Wall Street reacted to a resumed slide in oil prices and braced for the Federal Reserve’s decision Wednesday on interest rates.

A major driver of the recent stock market rally has been a sharp rebound in oil prices. But U.S.-produced crude has reversed course the past two trading sessions and has resumed its fall amid fresh worries about oversupply, which has weighed on market sentiment. A barrel of West Texas Intermediate crude closed down 2.3%, to $36.45.

Investors were also digesting the decision of the Bank of Japan not to slash interest rates further, after surprising markets back in January when it cut rates into negative territory for the first time. The BOJ left rates unchanged and didn’t boost its stimulus measures currently in place.

In pharmaceutical news today, we heard that shares of Valeant Pharmaceuticals International (VRX) suffered their worst one-day plunge ever, losing more than half their value after the embattled drug maker issued lower earnings and financial forecasts and outlined potential bond defaults that could affect the firm’s borrowing. Ouch!

Read More