Markets Remain In Limbo

Ulli Market Commentary Contact

Mon pic

[Chart courtesy of MarketWatch.com]

1. Moving the Markets

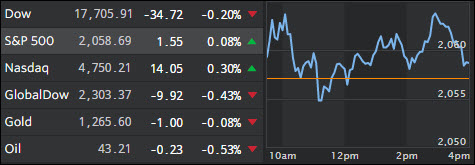
The U.S. stock market, currently riding a two-week losing streak amid signs of fading momentum after a big rally off the market lows back in February, kicked off the new week with mixed results and little signs of breaking out to the upside.

Oil dropped a bit, there was some news on the M&A side and tech stocks remain strong.

While there’s no economic data releases of importance set for release this week, Wall Street will watch the tail-end of the Q1 earnings season, which has been weak, but not as bad as feared, which was simply a function of sharply reduced expectations. With 438 of the 500 S&P companies having already reported, earnings are seen contracting “only” 5.1%, which is far better than the 8% slide forecast at the start of the reporting season.

In M&A news today, we head that Krispy Kreme Doughnuts (KKD), the chain famous for its simple glazed pleasure will be acquired by JAB Beech, a subsidiary of investment firm JAB Holdings Company. The deal is valued at $1.35 billion and JAB Beech will pay $21 a share in cash for Krispy Kreme, which is a 25% premium over the company’s Friday closing stock price of $16.86. The deal will turn Krispy Kreme into a private company and is expected to close in Q3 of this year.

Read More

ETFs/Mutual Funds On The Cutline – Updated Through 05/06/2016

Ulli ETFs on the Cutline Contact

Below are the latest ETF Cutline reports, which show how far above or below their respective long-term trend lines (39 week SMA) my currently tracked ETFs/MFs are positioned.

The first report covers the ETF Master List from Thursday’s StatSheet and includes 381 ETFs, of which currently 263 (last week 300) are hovering in bullish territory.

The second report includes only High Volume ETFs. To clarify, High Volume (HV) ETFs are defined as those with an average daily volume of $10 million or higher. Volume figures can change in a hurry, so be sure to check first before investing.

These ETFs are generated from my selected list of 98 that I use in my advisor practice. It cuts out the “noise,” which simply means it eliminates those ETFs that I would never buy because of their volume limitations. 62 ETFs (last week 81) have managed to remain in bullish territory after the recent market volatility.

The third report covers Mutual Funds on the Cutline. There are currently 290 (last week 367) above the line and 490 below it out of the 780 that I follow.

Take a look:

  1. ETF Master Cutline Report
  2. ETF High Volume Cutline Report
  3. MF Cutline Report

In case you are not familiar with some of the terminology used in the reports, please read the Glossary of Terms.

If you missed the original post about the Cutline approach, you can read it here.

One Man’s Opinion: Is The Broader Dollar Index An Important Fed-Move Indicator?

Ulli Market Review Contact

Man

The US dollar movement is important because every market variable is either positively or inversely correlated to the dollar, said Jurrien Timmer of Fidelity Investments. When the dollar goes down, liquidity conditions ease up, which is usually the risk-on scenario.

If the dollar moves up, it means financial conditions are tightening, or at least that has been the dynamic over the past year or so during the observed trading range, which makes the dollar the key indicator, he noted.

Asked if he is looking at a broader dollar index or only watching major currencies such as the euro and the yen, Jurrien said he follows the broader dollar index and not the DXY, which is half euros.

Read More

New ETFs On The Block: REX Gold Hedged S&P 500 ETF (GHS)

Ulli Gold ETFs Contact

GoldThe heightened volatility in US equity markets due to swings in oil price and global growth concerns have many investors leaning on gold as a hedge against market turmoil and a store for value.

Traditionally, the yellow metal has shown low correlation to both stocks and fixed-income securities, and has enjoyed great demand as a safe haven both during uncertain times and periods of high inflation.

That probably explains why the newcomer REX Shares recently launched the first-of-its-kind exchange-traded funds: REX Gold Hedged S&P 500 ETF (GHS) and REX Gold Hedged FTSE Emerging Markets ETF (GHE). Rex Shares is promoted by Greg King, an ETF industry veteran who rolled out the first ever exchange-traded note while working at Barclays and was head of exchange-traded products in Credit Suisse.

Read More

ETF/No Load Fund Tracker Newsletter For May 6, 2016

Ulli ETF Tracker Contact

ETF/No Load Fund Tracker StatSheet

————————————————————-

https://theetfbully.com/2016/05/weekly-statsheet-for-the-etfno-load-fund-tracker-newsletter-updated-through-05052016/

————————————————————

Market Commentary

MEDIOCRE FINISH TO A CHOPPY WEEK
Fri pic

[Chart courtesy of MarketWatch.com]

1. Moving the Markets

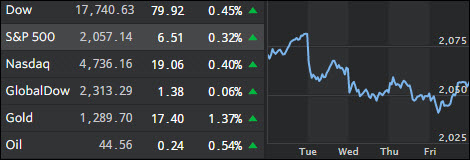
Stocks were lower for the third week in a row as renewed concerns regarding global growth prospects have put pressure on investor sentiment. Additionally, recent domestic economic data has not been as robust as many had expected. Month-to-month economic readings can be choppy, and it’s likely that incoming data will continue to alternate between soft and strong for the time being.

Payroll growth slowed in April as employers added only 160,000 jobs, raising concerns that weak economic growth may finally be crimping the U.S. labor market.

Amazon (AMZN) was back on top today after news was released that the company has doubled the number of air freight cargo planes it is leasing. This, of course, signals meaningful growth is in store for the online retail giant. Atlas Air Worldwide (AAWW) on Thursday said it had signed an agreement with the Seattle internet retailer to operate 20 Boeing 767 for the company for ten years. As a side note, Amazon will acquire up to 20% of the company in the near future.


2. ETFs in the Spotlight

In case you missed the announcement and description of this section, you can read it here again.

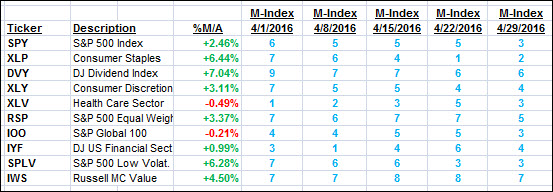
It features 10 broadly diversified ETFs from my HighVolume list as posted every Monday. Furthermore, they are screened for the lowest MaxDD% number meaning they have been showing better resistance to temporary sell offs than all others over the past year.

Here are the 10 candidates:
MaxDD

The above table simply demonstrates the magnitude with which some of the ETFs are fluctuating in regards to their positions above or below their respective individual trend lines (%M/A). A break below, represented by a negative number, shows weakness, while a break above, represented by a positive percentage, shows strength.

For hundreds of ETF/Mutual fund choices, be sure to reference Thursday’s StatSheet.

Year to date, here’s how the above candidates have fared so far:
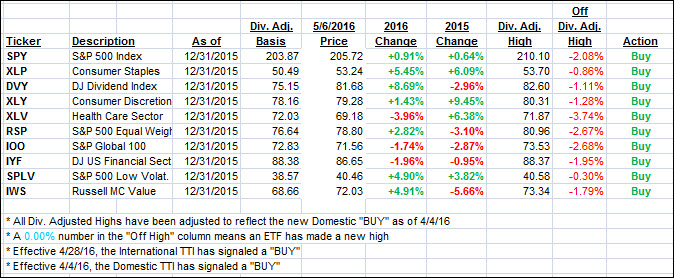
YTD

Again, the first table above shows the position of the various ETFs in relation to their respective long term trend lines (%M/A), while the second one tracks their trailing sell stops in the “Off High” column. The “Action” column will signal a “Sell” once the -7.5% point has been taken out in the “Off High” column.

3. Trend Tracking Indexes (TTIs)

Our Domestic Trend Tracking Index (TTI) slipped this week but remains bullish. The International TTI, on the other hand, went negative as I posted before. While we’re technically still in Buy mode, I suggest you hold off with any purchases as a whip-saw signal may materialize next week if the upward momentum does not pick up.

Here’s how we closed this Friday:

Domestic TTI: +1.11% (last Friday +1.29%)—Buy signal effective 4/4/2016

International TTI: -1.08% (last Friday +0.46%)—Buy signal effective 4/28/2016

Have a great weekend.

Ulli…

Disclosure: I am obliged to inform you that I, as well as advisory clients of mine, own some of these listed ETFs. Furthermore, they do not represent a specific investment recommendation for you, they merely show which ETFs from the universe I track are falling within the guidelines specified.

————————————————————-

READER Q & A FOR THE WEEK

All Reader Q & A’s are listed at our web site!
Check it out at:

https://theetfbully.com/questions-answers/

———————————————————-

WOULD YOU LIKE TO HAVE YOUR INVESTMENTS PROFESSIONALLY MANAGED?

Do you have the time to follow our investment plans yourself? If you are a busy professional who would like to have his portfolio managed using our methodology, please contact me directly or get more details at:

https://theetfbully.com/personal-investment-management/

———————————————————

Back issues of the ETF/No Load Fund Tracker are available on the web at:

https://theetfbully.com/newsletter-archives/

Weekly StatSheet For The ETF/No Load Fund Tracker Newsletter – Updated Through 05/05/2016

Ulli ETF StatSheet Contact

ETF/Mutual Fund Data updated through Thursday, May 5, 2016

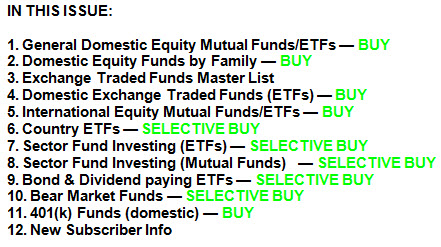
TOC042816

If you are not familiar with some of the terminology used, please see the Glossary of Terms.


1. DOMESTIC EQUITY MUTUAL FUNDS/ETFs: BUY — since 4/4/2016

TTI

Our main directional indicator, the Domestic Trend Tracking Index (TTI-green line in above chart) has recently crossed above its long term trend line (red) by +1.05% generating a new Domestic Buy signal effective 4/4/2016 as posted on the blog.

Read More