
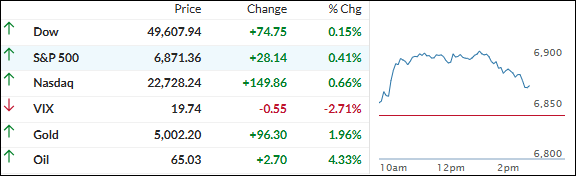
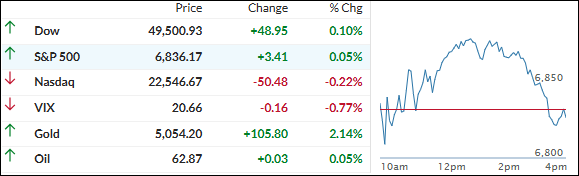
- Moving the market
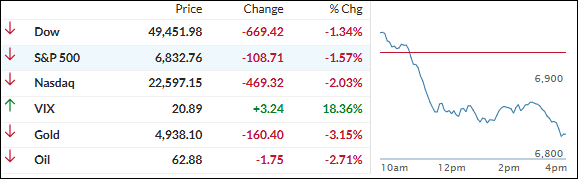
The major indexes jumped right out of the gate and held onto solid gains most of the day, fueled by strength in key tech names, as traders waited for the Fed’s latest minutes and eyed the big PCE inflation report coming Friday.
Nvidia climbed more than 2% after Meta announced it’s going to load up on millions of Nvidia chips for its data-center buildout.
Amazon added 2% too, boosted by filings showing Bill Ackman’s Pershing Square grew its stake by 65% in Q4—making it the fund’s third-largest holding (nice vote of confidence after Amazon snapped a nine-day losing streak).
Oil prices popped as traders digested fresh U.S.-Iran tensions—VP JD Vance said Iran didn’t meet red lines in this week’s nuclear talks and military options are still on the table.
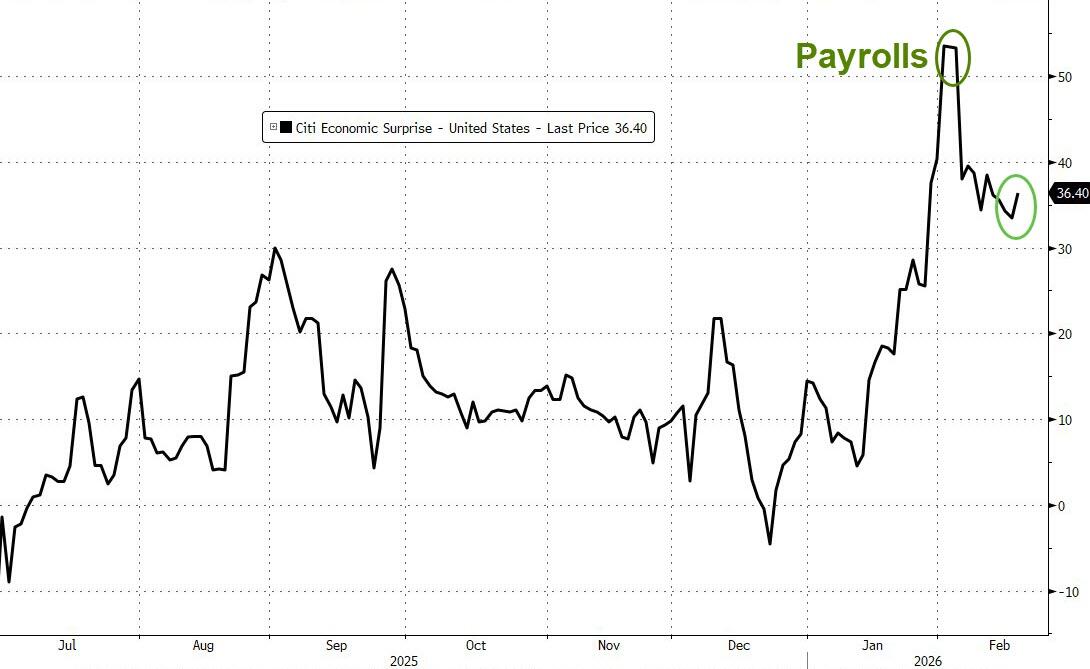
Macro data this morning helped too: durable goods orders beat, housing starts & permits surged more than expected, and industrial production came in strong.
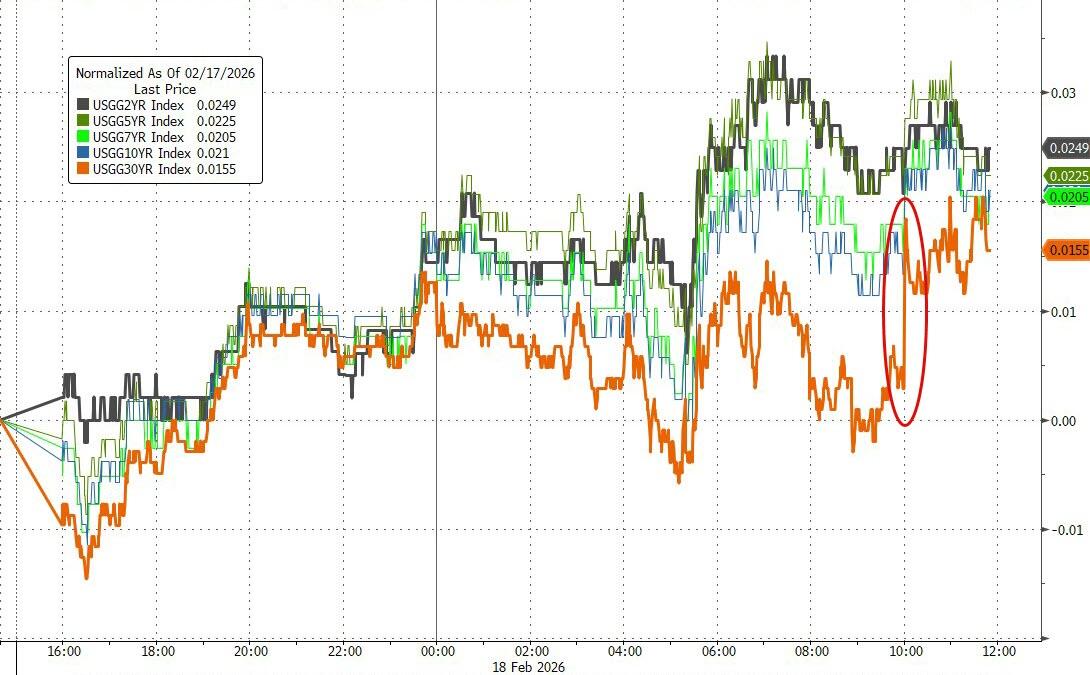
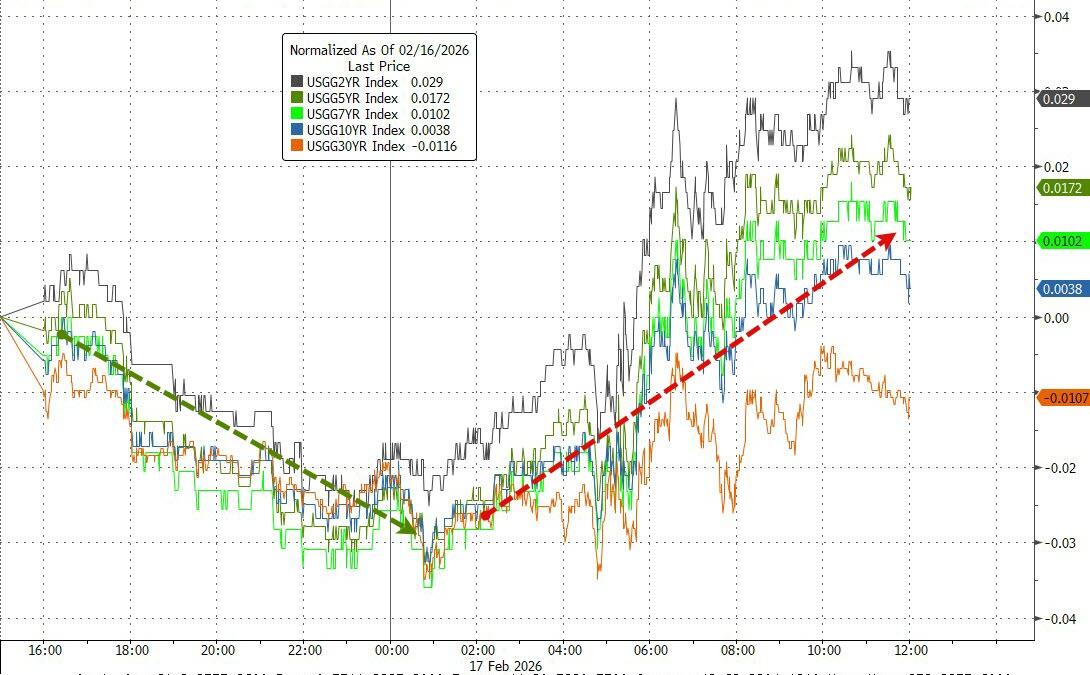
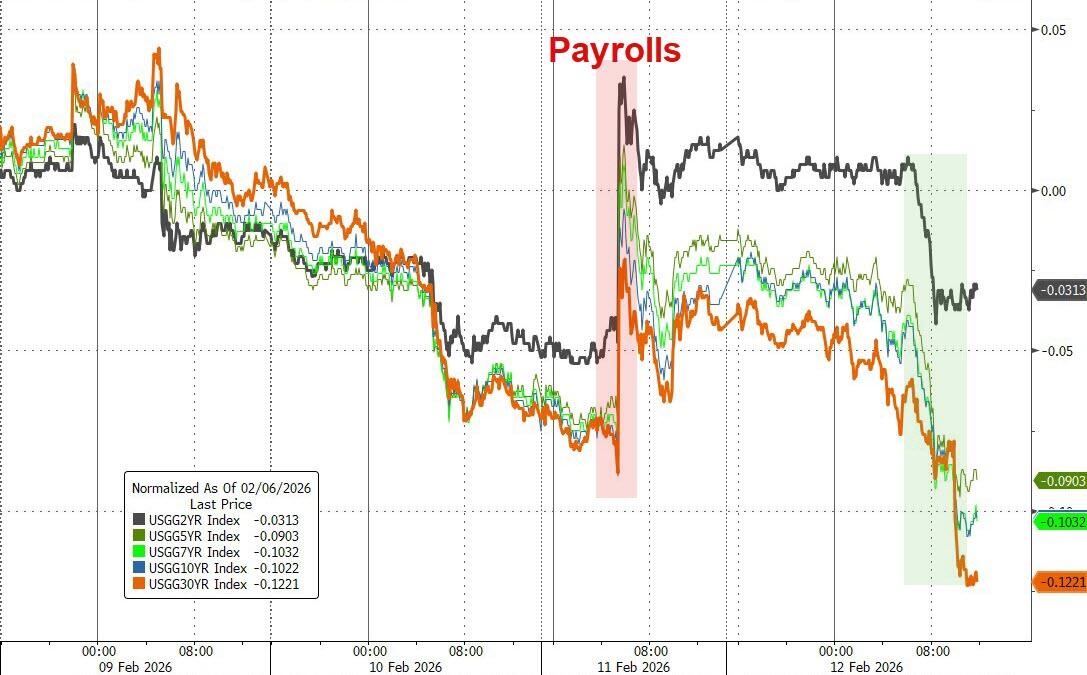
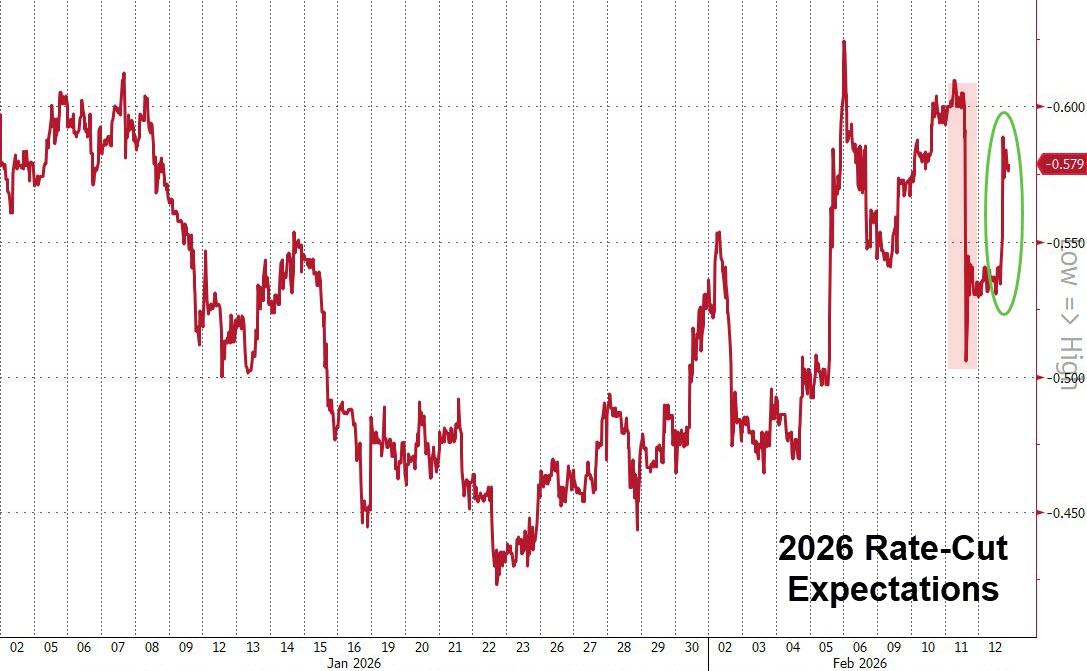
The Fed minutes showed a few members open to rate hikes if needed, which nudged rate-cut expectations lower and gave bond yields a moderate lift.
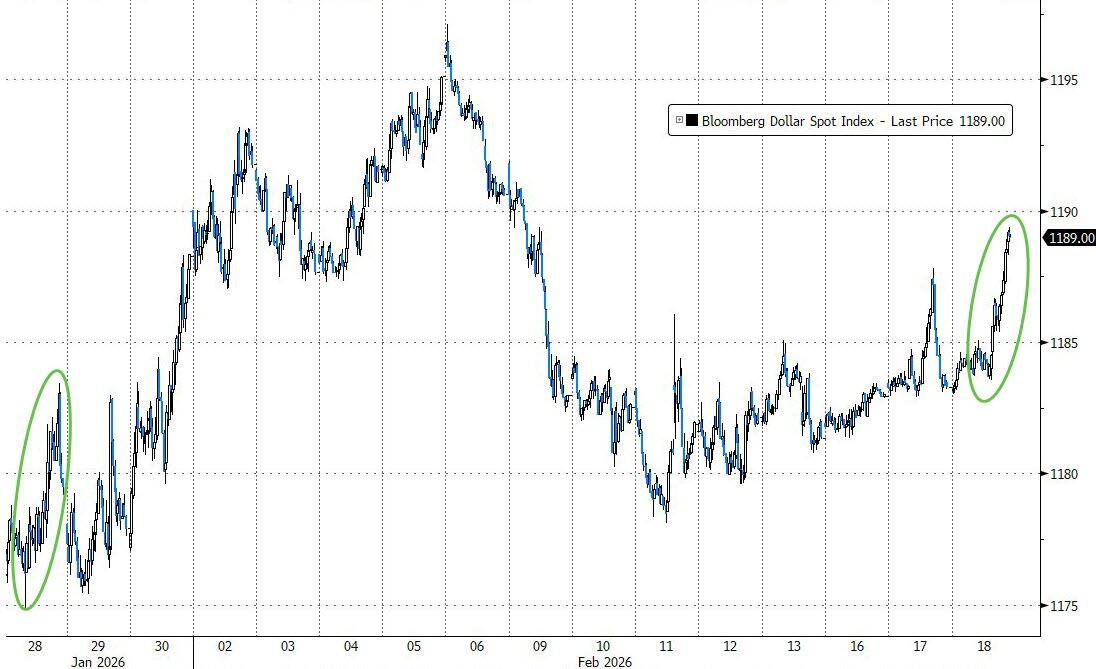
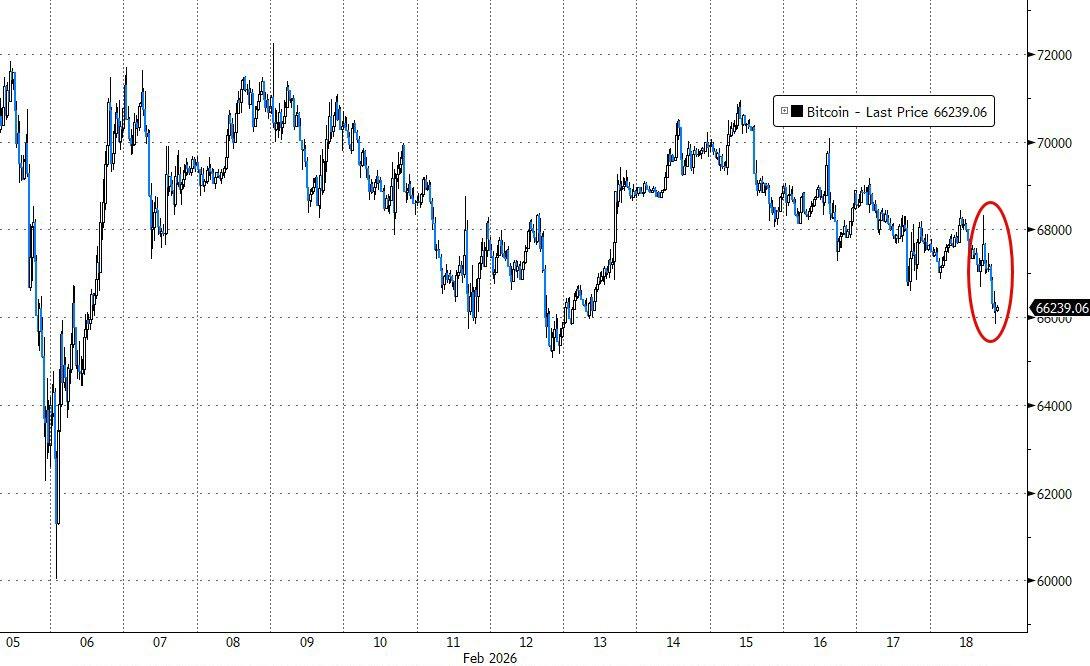
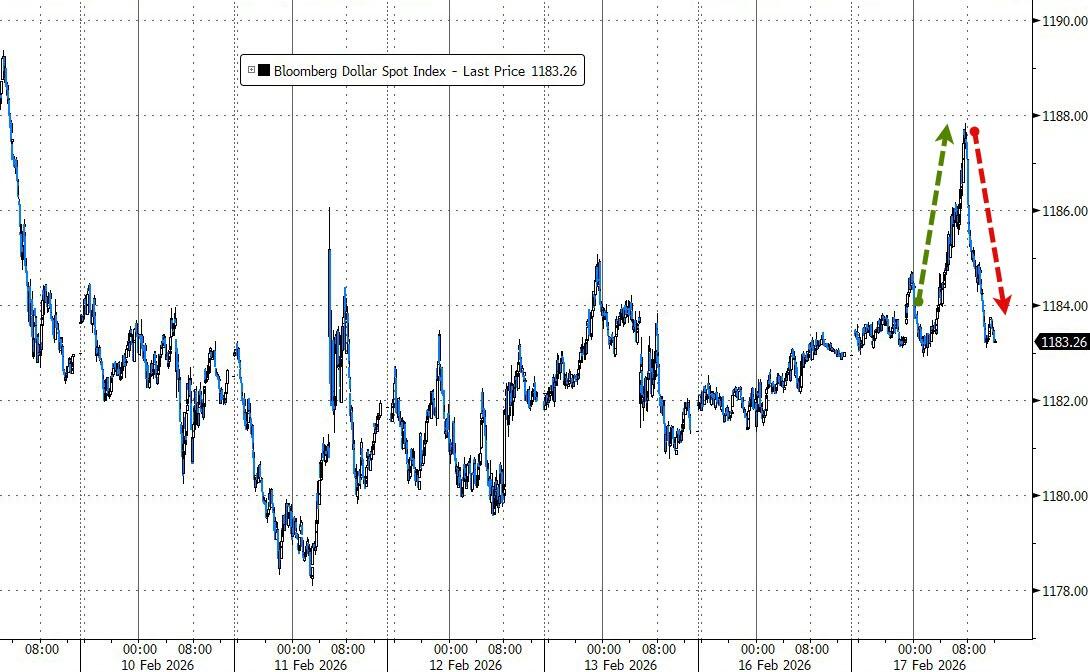
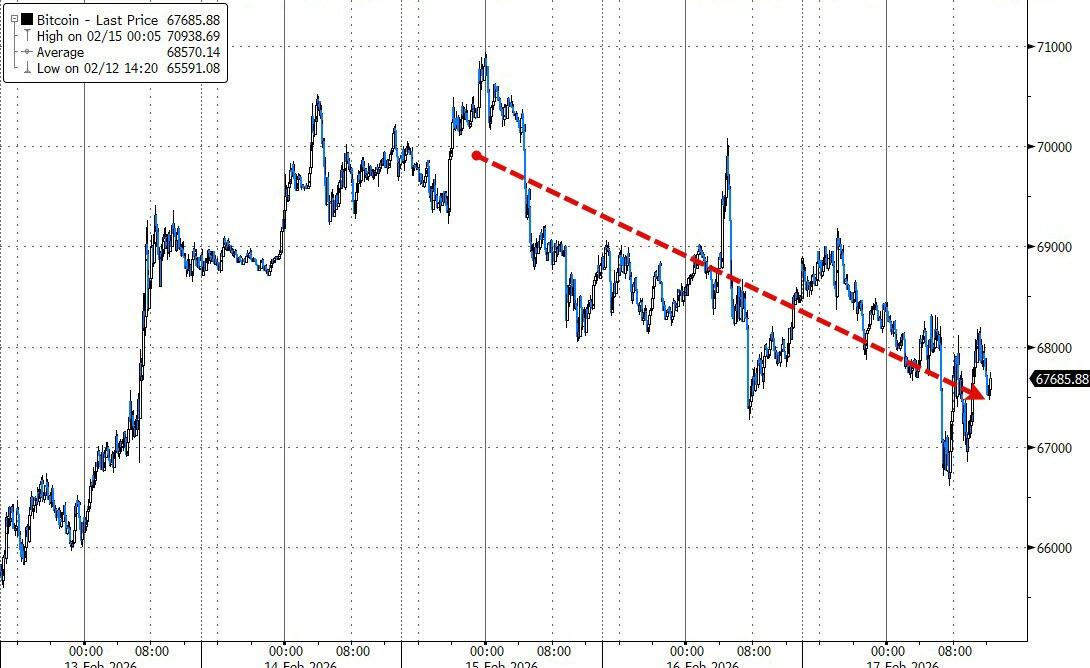
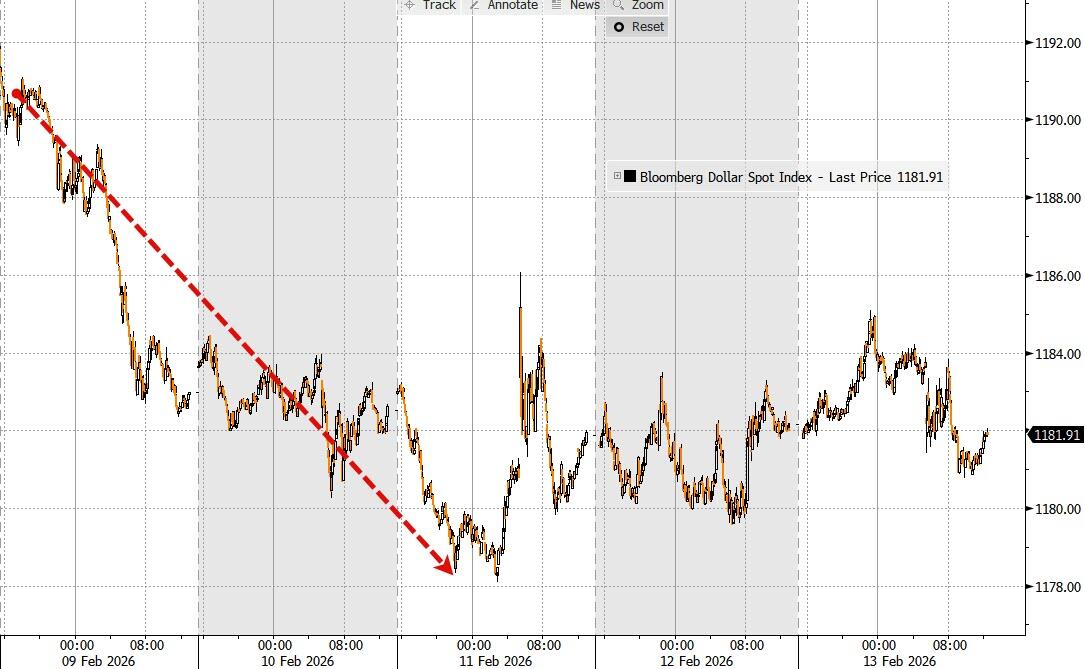
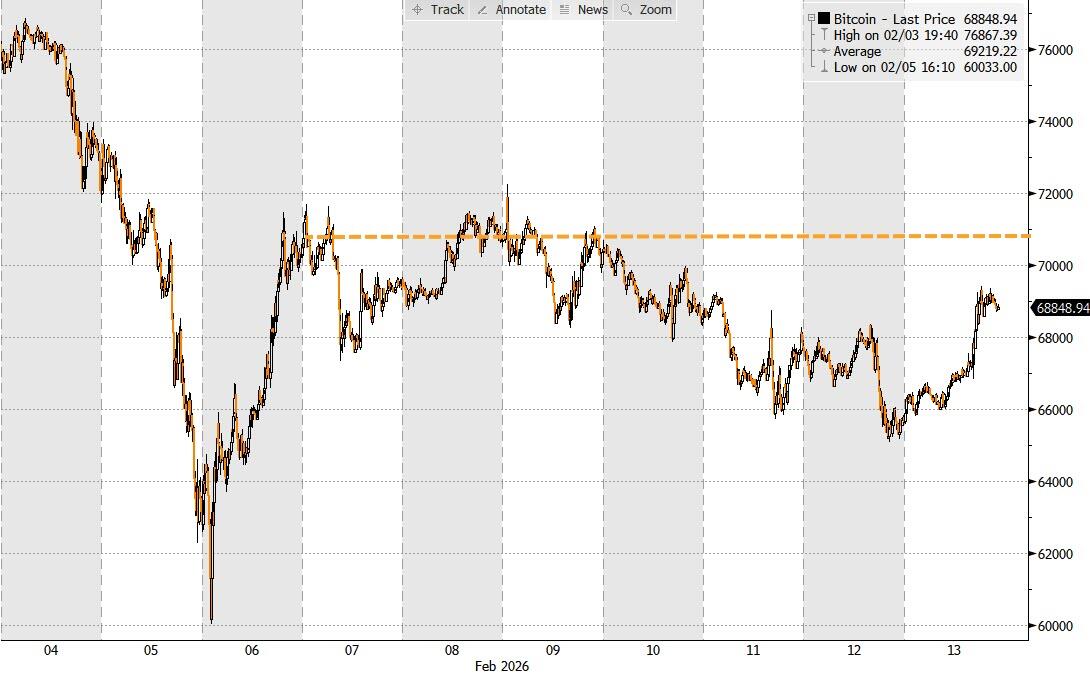
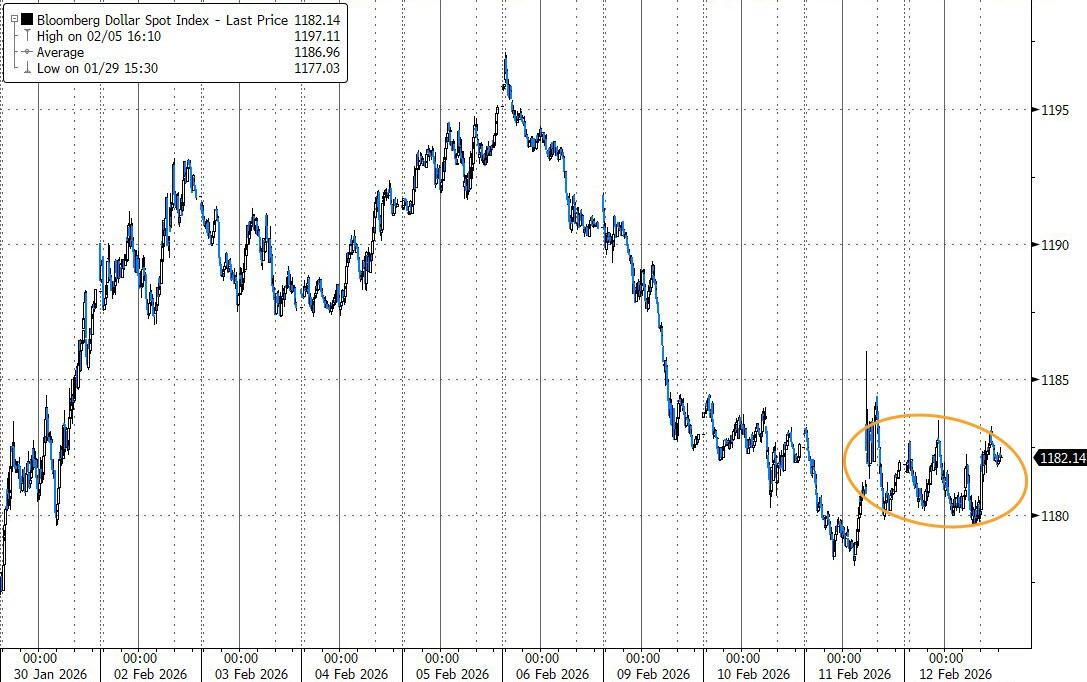
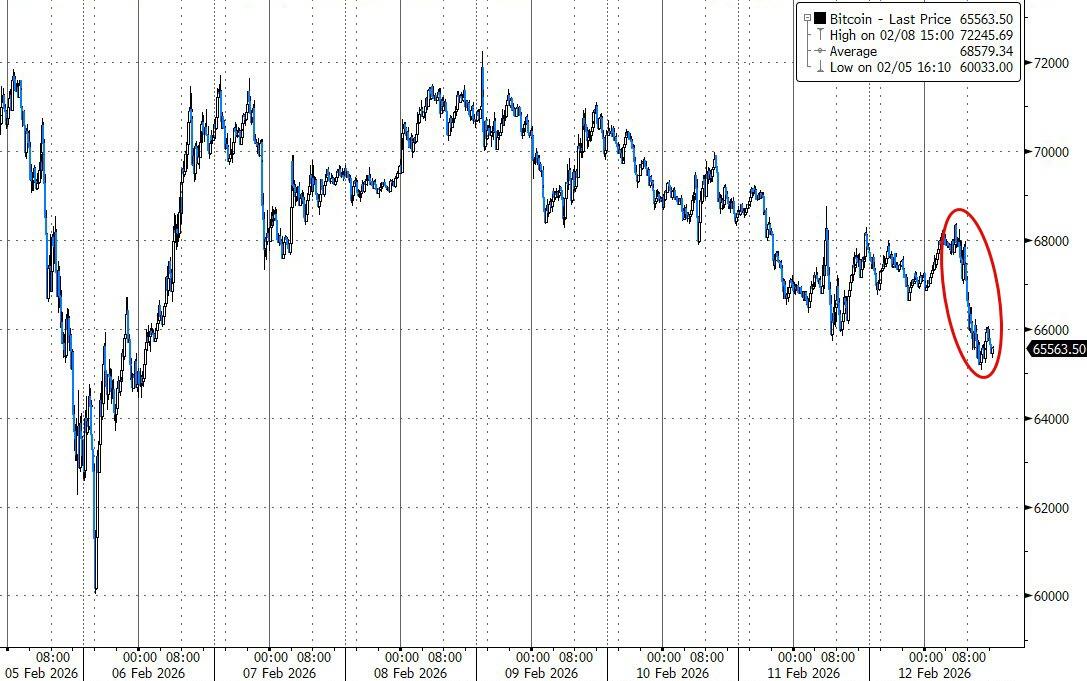
The dollar broke out higher, while Bitcoin mirrored that move early then faded after the release.
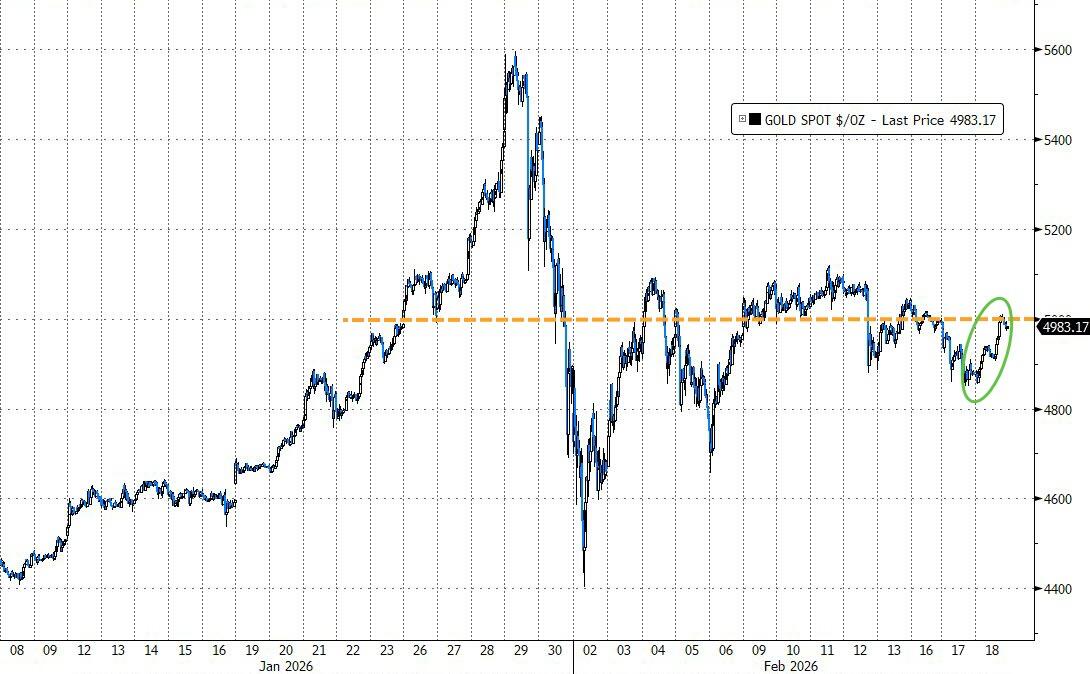
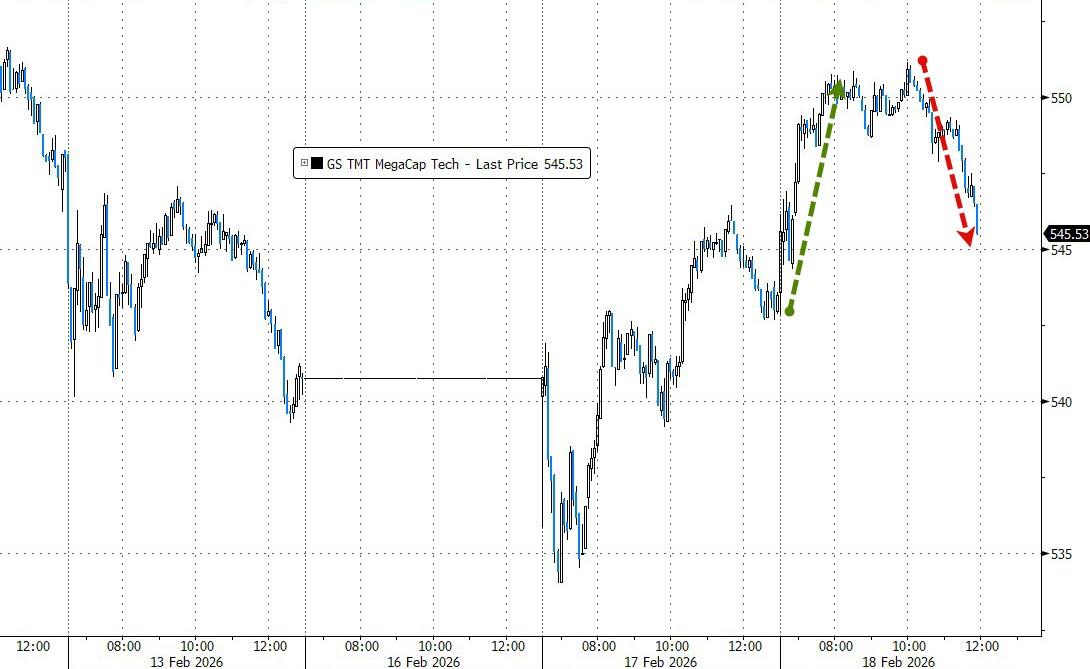
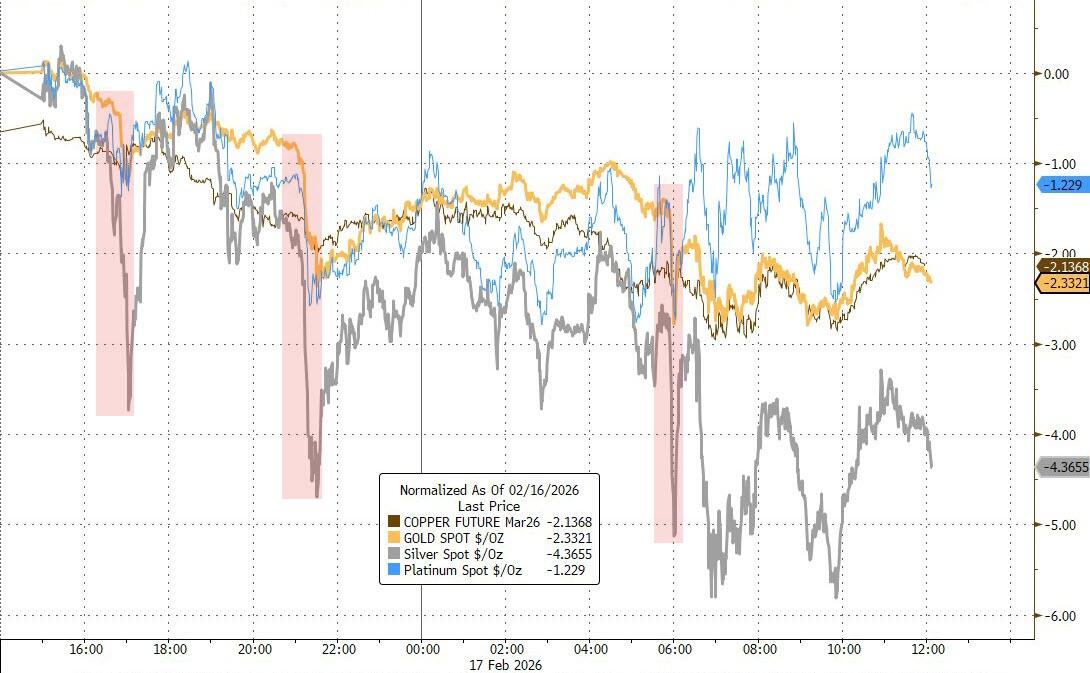
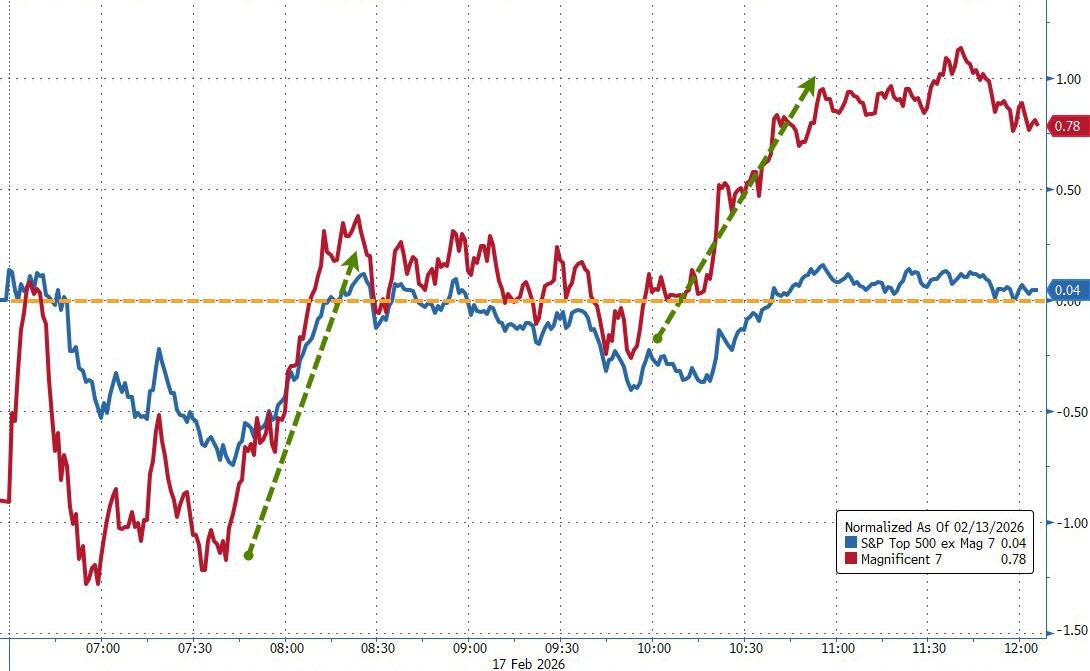
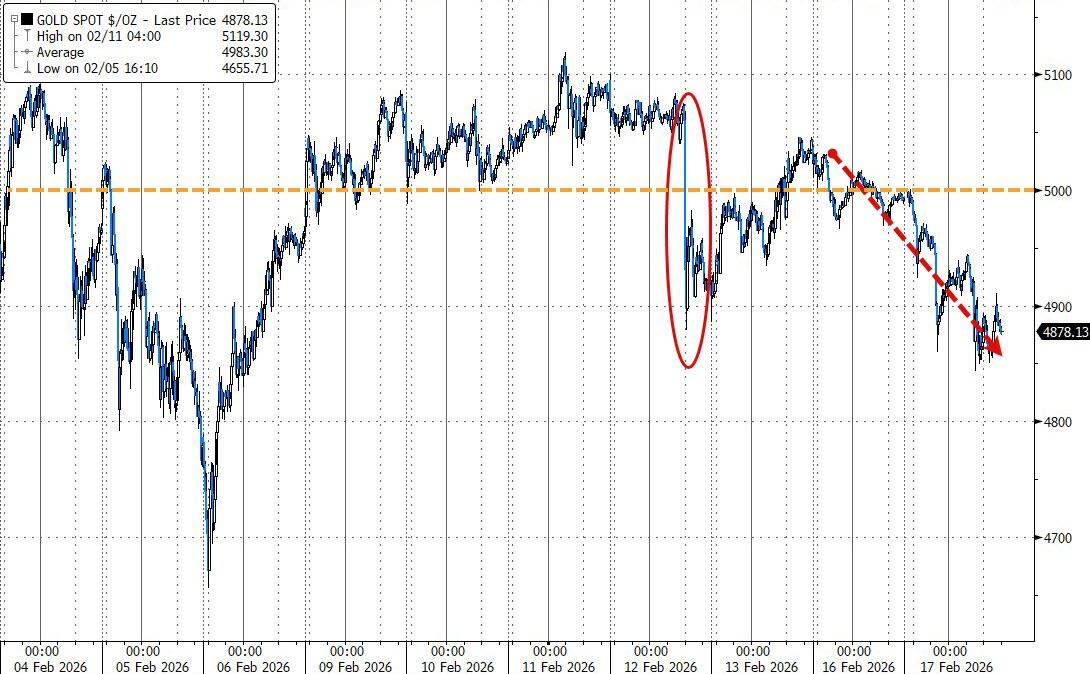
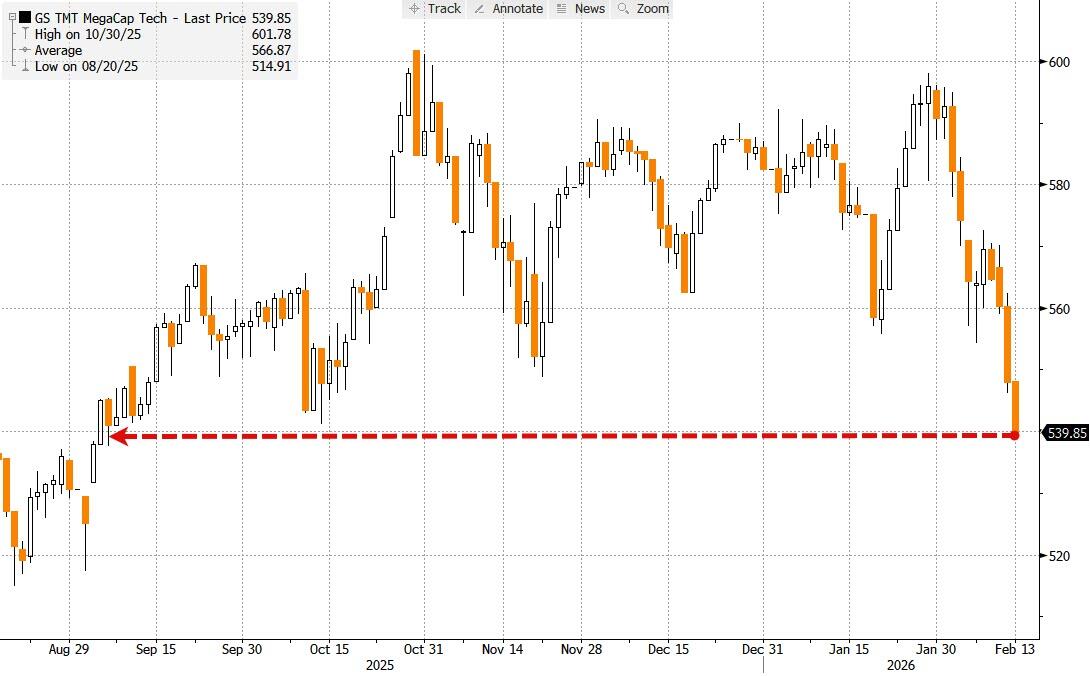
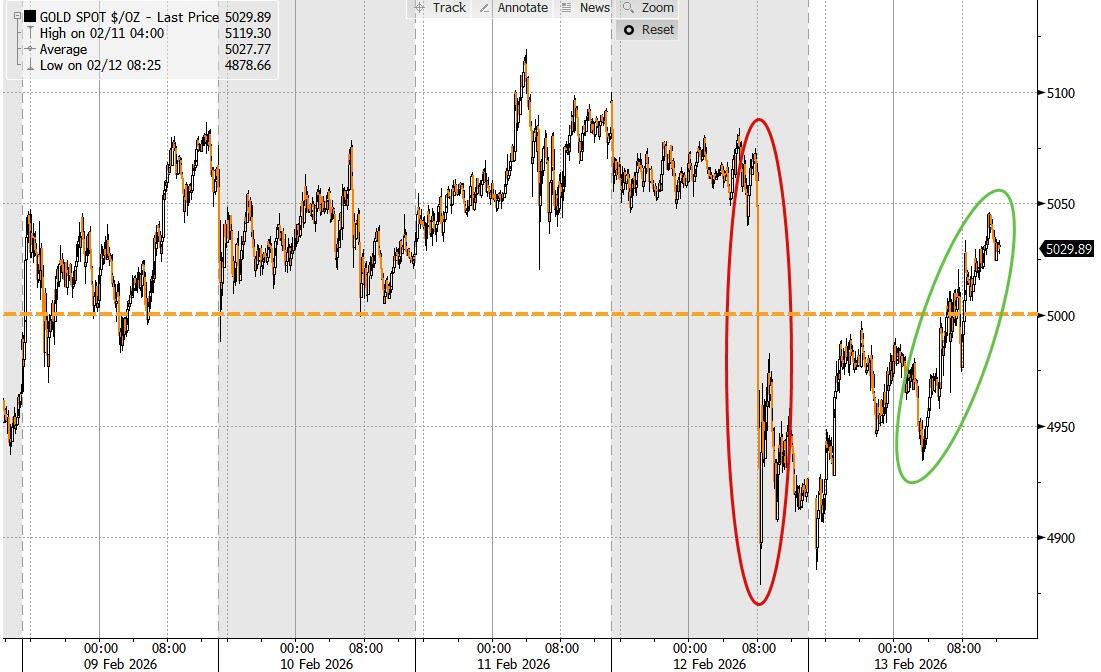
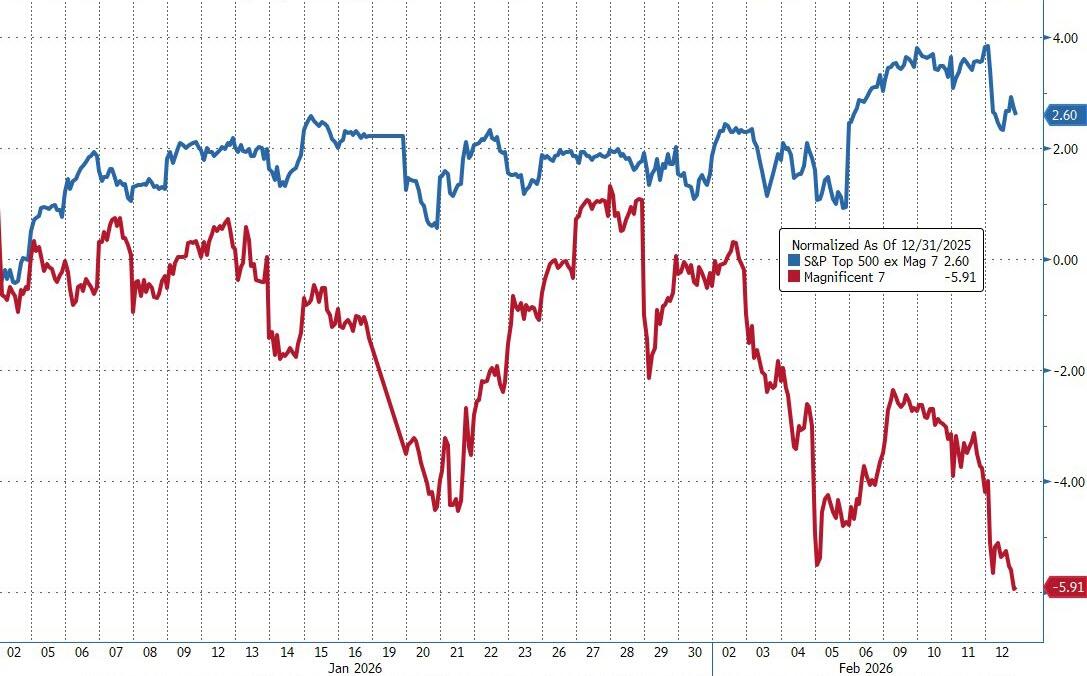
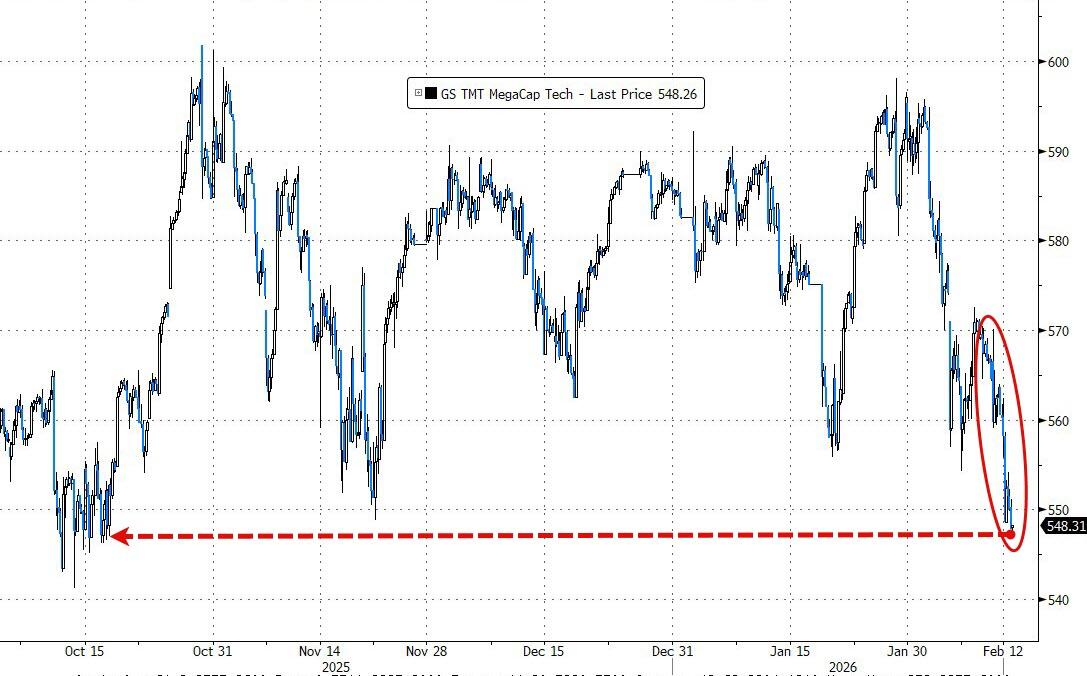
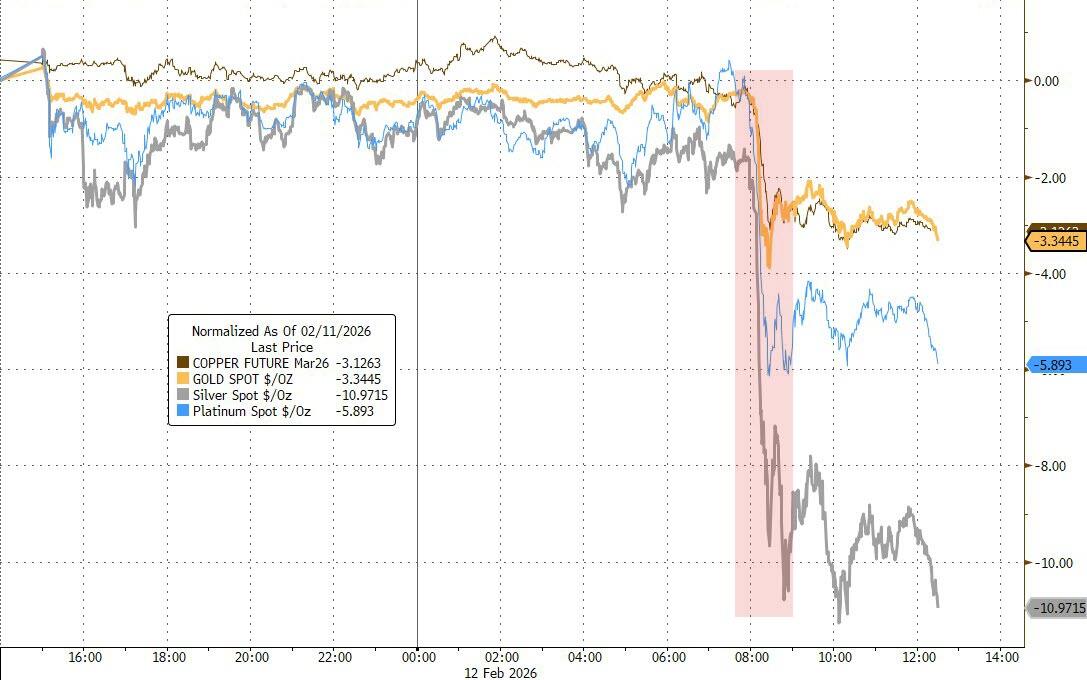
Gold topped $5,000 today and closed up 2%, with silver and copper also posting positive days. Mega-cap tech did its classic pump-and-dump, but the broader market held firm.
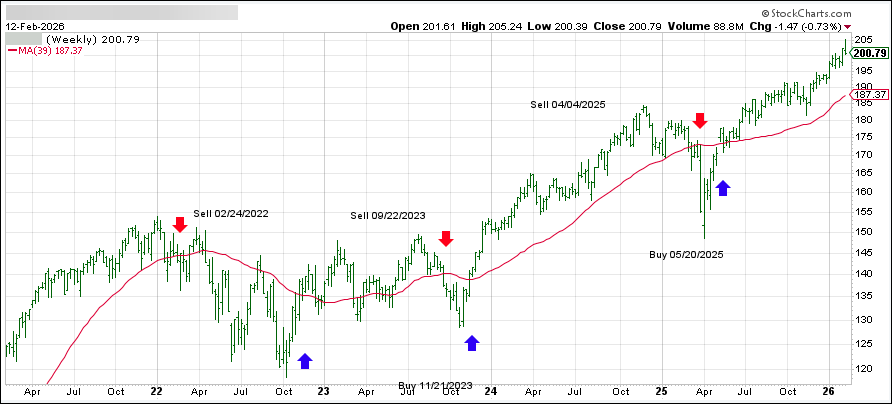
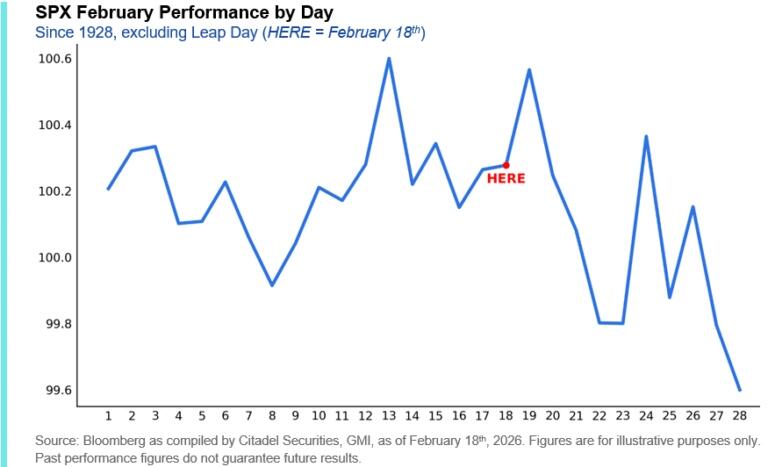
We’re past the halfway point in February now, and history says the back half of the month usually isn’t kind to stocks.
Will it be different this time?
Read More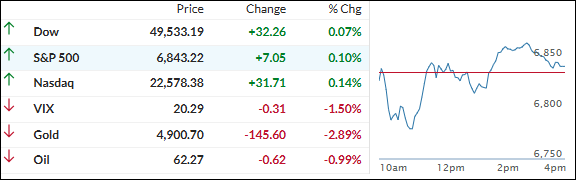
