ETFs On The Cutline – Updated Through 08/19/2016

Ulli ETFs on the Cutline Contact

Below please find the latest High Volume ETF Cutline report, which shows how far above or below their respective long-term trend lines (39 week SMA) my currently tracked ETFs are positioned.

This report covers the HV ETF Master List from Thursday’s StatSheet and includes 366 High Volume ETFs ETFs, defined as those with an average daily volume >$5 million, of which currently 329 (last week 325) are hovering in bullish territory. The yellow line separates those ETFs that are positioned above their trend line from those that have dropped below it.

Take a look:

The HV ETF Master Cutline Report  

In case you are not familiar with some of the terminology used in the reports, please read the Glossary of Terms.

If you missed the original post about the Cutline approach, you can read it here.

ETF Tracker Newsletter For August 19, 2016

Ulli ETF Tracker Contact

ETF Tracker StatSheet

————————————————————-

https://theetfbully.com/2016/08/weekly-statsheet-for-the-etf-tracker-newsletter-updated-through-08182016/

————————————————————

Market Commentary

MARKETS SLIPPING WHILE OIL IS GUSHING HIGHER
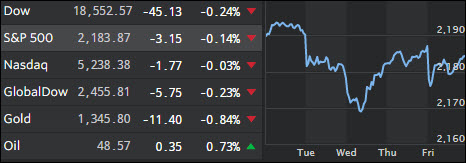
Fri pic

[Chart courtesy of MarketWatch.com]

1. Moving the Markets

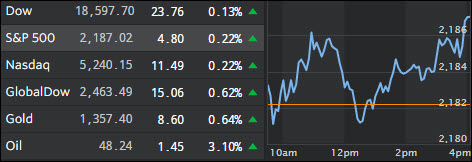
U.S. markets closed lower today to finish the week as traders appeared slightly anxious about the possibility of an earlier-than-expected Federal Reserve interest-rate hike. It seems that comments from senior Fed officials in recent days suggest a bias toward raising benchmark U.S. interest rates. This has subsequently pushed investors to re-examine minutes from the U.S. central bank’s most recent meeting in July and think more stringently about a potential rate hike before year end 2016.

In the world of tech, there were a few headlines today noting that Google’s stock celebrated its 12th anniversary of being on the public exchange.  And, while the stock has gained about 1,780% since its IPO back in 2004 (at $42 a share), there are a few other tech stocks that have performed better during that same time frame that you might not be aware of.

These companies include Priceline (PCLN), Netflix (NFLX), Salesforce.com (CRM), Amazon.com (AMZN) and its Google’s arch rival Apple (AAPL). Analysts remain bullish on the future of the stock though, and anticipating that the stock could be worth $935 a share in 18 months. That would put it 17% higher than the Friday’s closing price of $799.65 per share.

U.S. Crude Oil has been ‘on fire’ this week rising towards once again towards the $50 per barrel mark. While the ‘black gold’ hasn’t passed the $50 per barrel mark recently, it remains a tipping point that could move markets back in the opposite direction.

Read More

Weekly StatSheet For The ETF Tracker Newsletter – Updated Through 08/18/2016

Ulli ETF StatSheet Contact

ETF Data updated through Thursday, August 18, 2016

TOC081816

Methodology/Use of this StatSheet:

  1. From the universe of over 1,800 ETFs, I have selected only those with a trading volume of over $5 million per day (HV ETFs), so that liquidity and a small bid/ask spread are assured.
  2. Trend Tracking Indexes (TTIs)

Buy or Sell decisions for Domestic and International ETFs (section 1 and 2), are made based on the respective TTI and its position either above or below its long-term M/A (Moving Average). A crossing of the trend line from below accompanied by some staying power above constitutes a “Buy” signal. Conversely, a clear break below the line constitutes a “Sell” signal. Additionally, I use a 7.5% trailing stop loss on all positions in these categories to control downside risk.

  1. All other investment arenas do not have a TTI and should be traded based on the position of the individual ETF relative to its own respective trend line (%M/A). That’s why those signals are referred to as a “Selective Buy.” In other words, if an ETF crosses its own trendline to the upside, a “Buy” signal is generated. Since these areas tend to be more volatile, I recommend a wider trailing sell stop of 7.5% -10% depending on your risk tolerance.

If you are unfamiliar with some of the terminology, please see Glossary of Terms and new subscriber information in section 9.


1. DOMESTIC EQUITY ETFs: BUY — since 4/4/2016

TTI

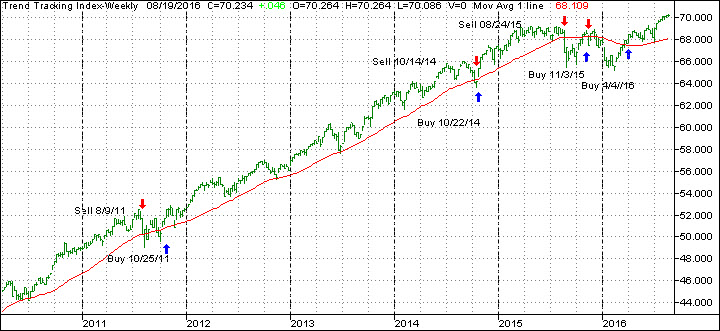
Our main directional indicator, the Domestic Trend Tracking Index (TTI-green line in the above chart) remains above its long-term trend line (red) by +3.18% after having generated a new Domestic Buy signal effective 4/4/2016 as posted.

Read More

US Oil Throws An Assist

Ulli Market Commentary Contact

Thur pic

[Chart courtesy of MarketWatch.com]

1. Moving the Markets

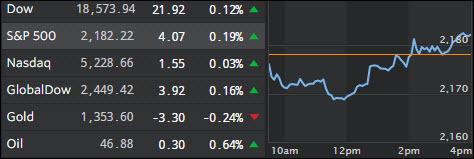
It was a roller coaster kind of day with the markets dropping out of the gate, regaining upside momentum, falling again below the unchanged line before staging a mid-day comeback, which accelerated into the close.

Wall Street is still digesting the possibility of a rate hike in September. It’s the same old story with the Fed keeping markets at bay and under control. Personally, I think there is absolutely no way to justify higher rates based on economic fundamentals with most data points, along with GDP, heading south. However, if the Fed is concerned with the lofty levels of the major averages, they might pull the trigger on a tiny rate hike just to keep the market from moving deeper into bubble territory. I am not sure if that is a consideration, but the fact is the Fed trapped with none of their options looking particularly enticing.

Oil was the lead dog again as it continued its rally for the 6th day on no news of any shortage. On the corporate side, the mother of all hogs (Harley-Davidson) got spanked today (-1.73%) and agreed to a $12 million fine for selling illegal after-market tuners, which caused excessive motorcycle pollution.

Read More

Back On Top Again

Ulli Market Commentary Contact

Wed pic

[Chart courtesy of MarketWatch.com]

1. Moving the Markets

Falling in line with the (as of lately) market topping then dropping phenomena, all three indexes pushed higher again today…barely.  Stocks here in the U.S. stretched into positive territory late in the day after Fed Minutes news suggested that an interest rate hike may still be on the table for calendar year 2016.

In usual fashion, Fed officials still appear to be largely divided on whether the economy is strong enough to warrant a rate hike.  Alleged recent economic strength, most notably the jobs report in July, has added fuel to the growing suspicion that the Fed could move to slow things down. During July, employers added 255,000 predominantly part-time jobs, which are supposed to be a strong showing for the second-straight month.

Though Wall Street might be pleased at the prospect of low interest rates for a longer period, some sectors are hurting. Today, the retail sector suffered another round of blows as home improvement retailer Lowe’s (LOW) posted disappointing earnings and big-box chain Target lowered its outlook, bludgeoning stocks of both companies.

Read More

An Elegant Fall From Grace

Ulli Market Commentary Contact

Tue pic

[Chart courtesy of MarketWatch.com]

1. Moving the Markets

Wow, what a surprise; no new highs! Despite Crude oil taking the lead to the upside, the major indexes lagged and closed lower. You can thank Fed Pres Dudley for jawboning about potential interest rate hikes sometime this year, which took the starch out of yesterday’s rally. Given the continuous flow of unimpressive economic data points, Dudley’s hint towards higher rates seem to me an attempt to keep the markets in check, as odds are very low that any rate hikes are forthcoming anytime soon.

Over the past week, markets have continued to climb to new record highs, then drop the next day and repeat this cycle over and over again. Thus, the headline “an elegant fall from grace…” Perhaps investors took a pause from their recent streak of exuberance today as they await Wednesday’s release of the minutes from the latest Federal Reserve meeting that will offer more clues on the trajectory of U.S. interest rates.

There was an interesting press release today from one of the nation’s largest health insurer’s, Aetna. Word on the street, is that Aetna (potentially) intends to pull out of about 70% of the Obamacare insurance exchanges it participates in. A spokesperson from the company said that they lost roughly $200 mil on individual plans and that they needed a larger amount of healthy plan members to offset the large amount of sick patients that are the heavier users of their services.

Read More