
- Moving the market
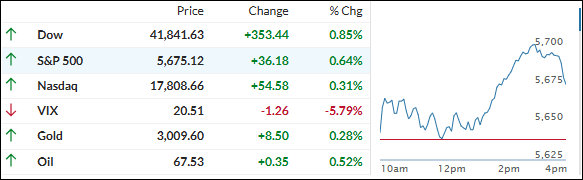
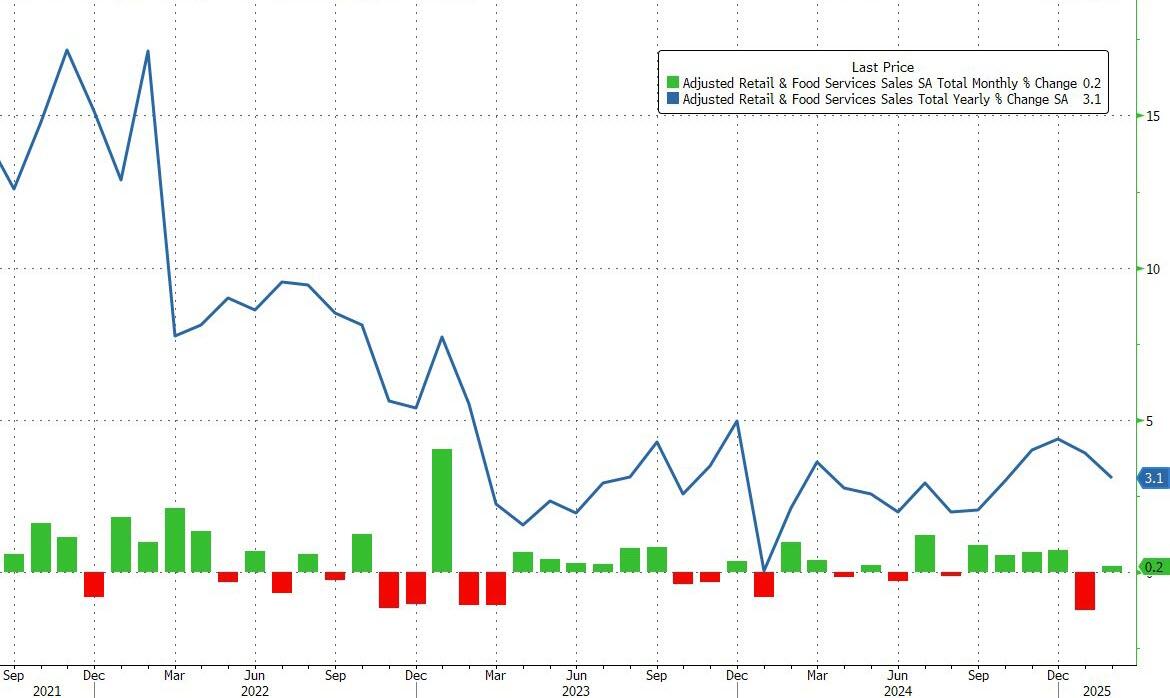
Equities rose early in the session as major indexes attempted to build on Friday’s recovery from correction territory. The latest retail sales report showed a 0.2% increase for February, which, although below the estimated 0.6% rise, relieved traders as the outcome was not worse.
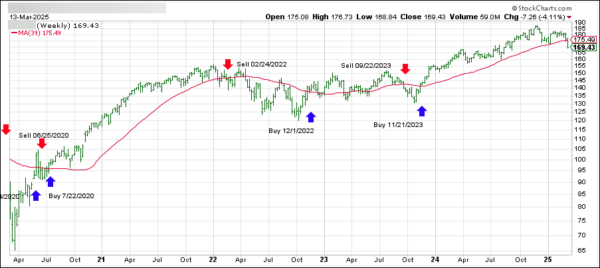
Last Thursday, the S&P 500 entered correction territory, dropping more than 10% from its February high. Dip buyers stepped in on Friday, driving the index 2% higher and helping us delay our “Sell” signal.
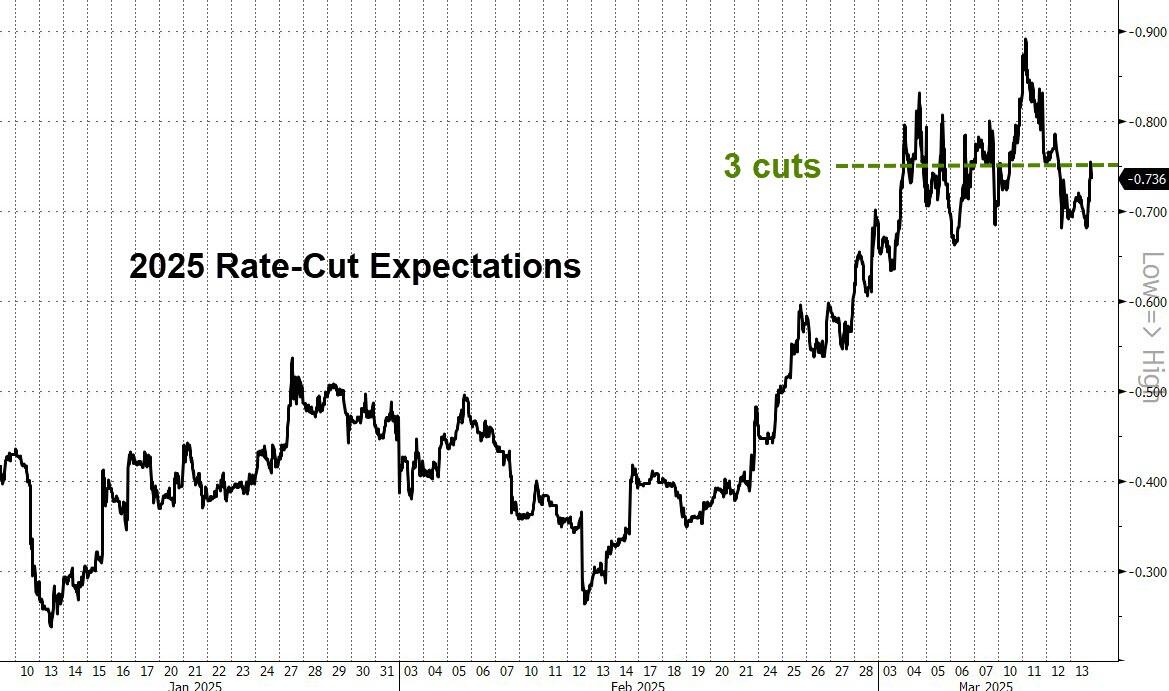
Despite this, anxiety persists as traders struggle to keep up with Trump’s rapidly changing tariff policies and the cost-cutting efforts of the DOGE department, which impact the economy and corporate and consumer confidence.
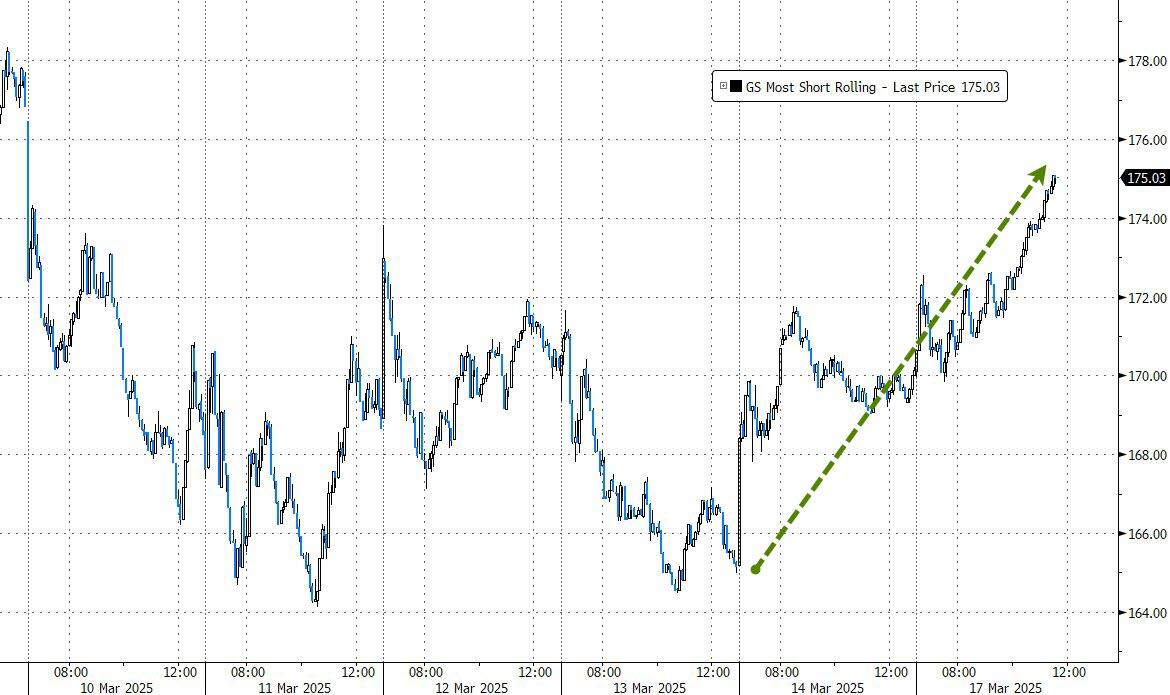
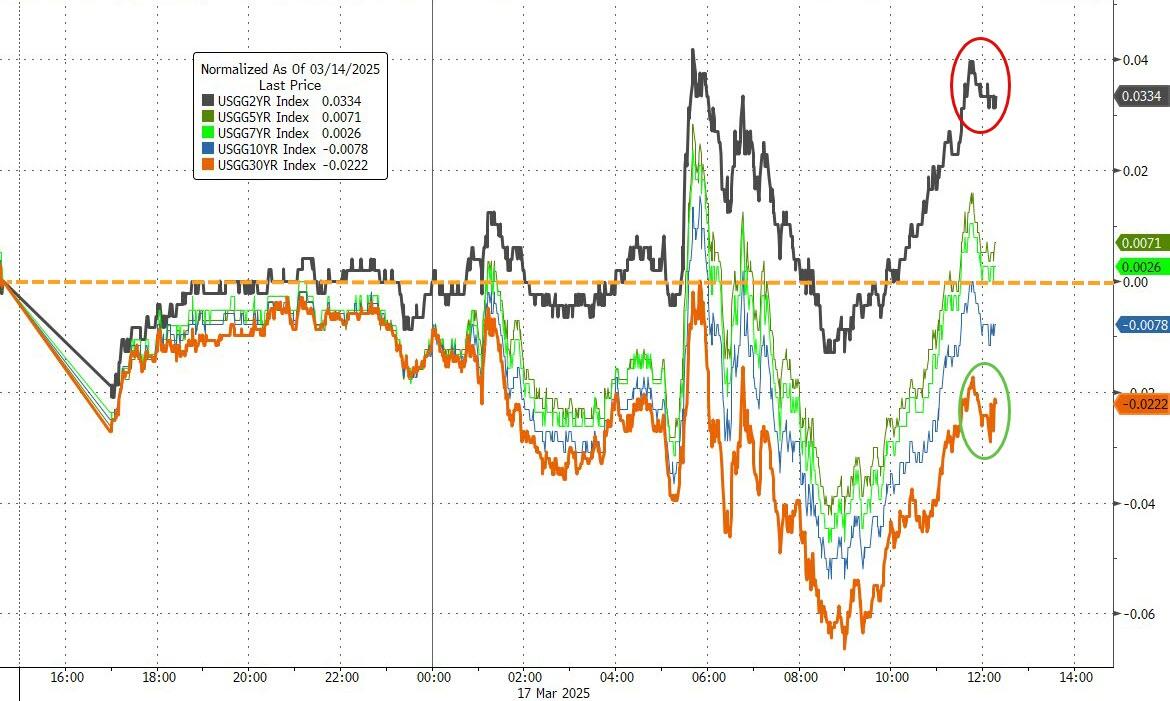
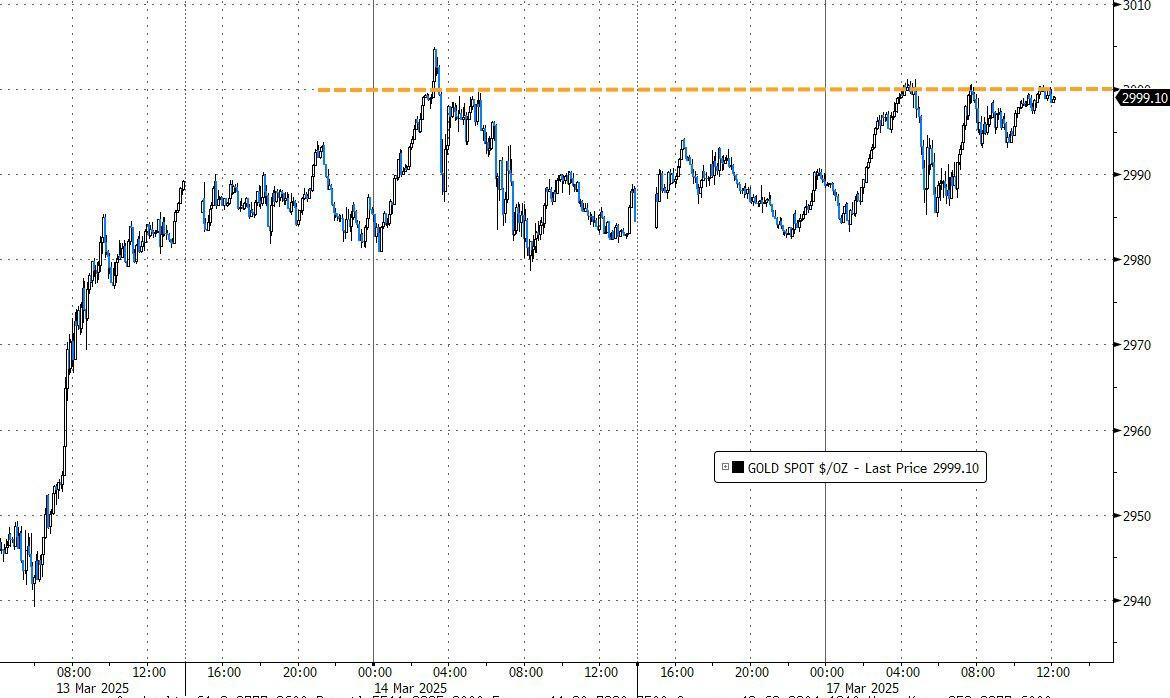
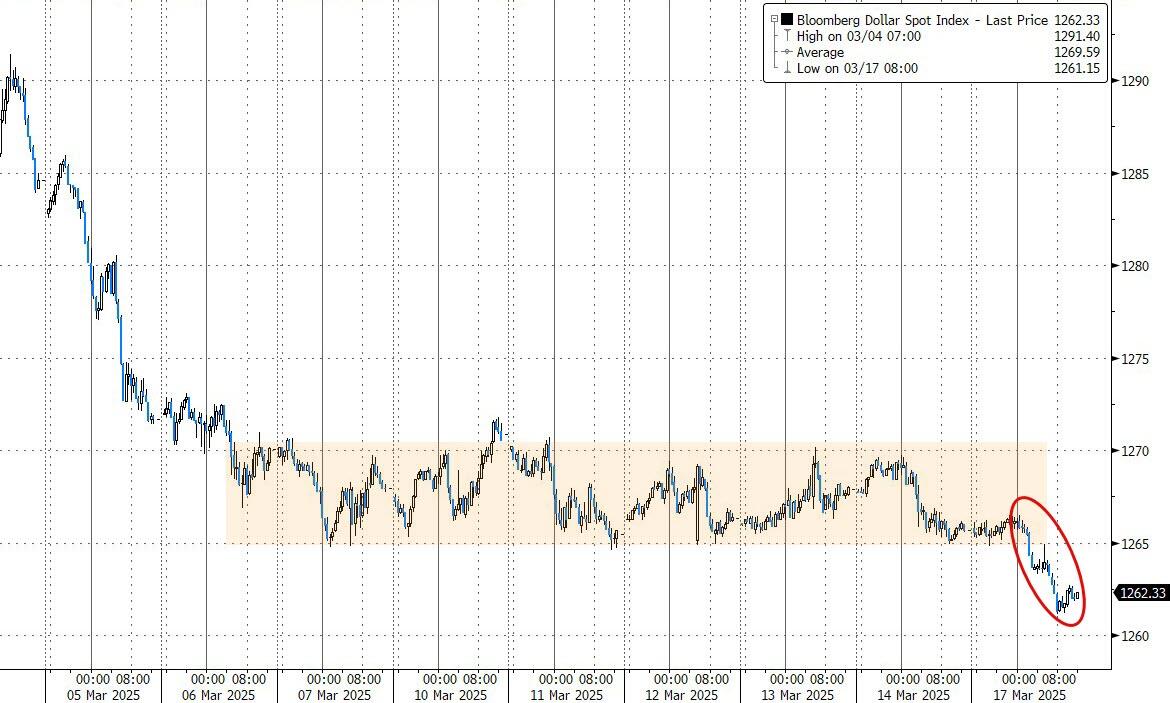
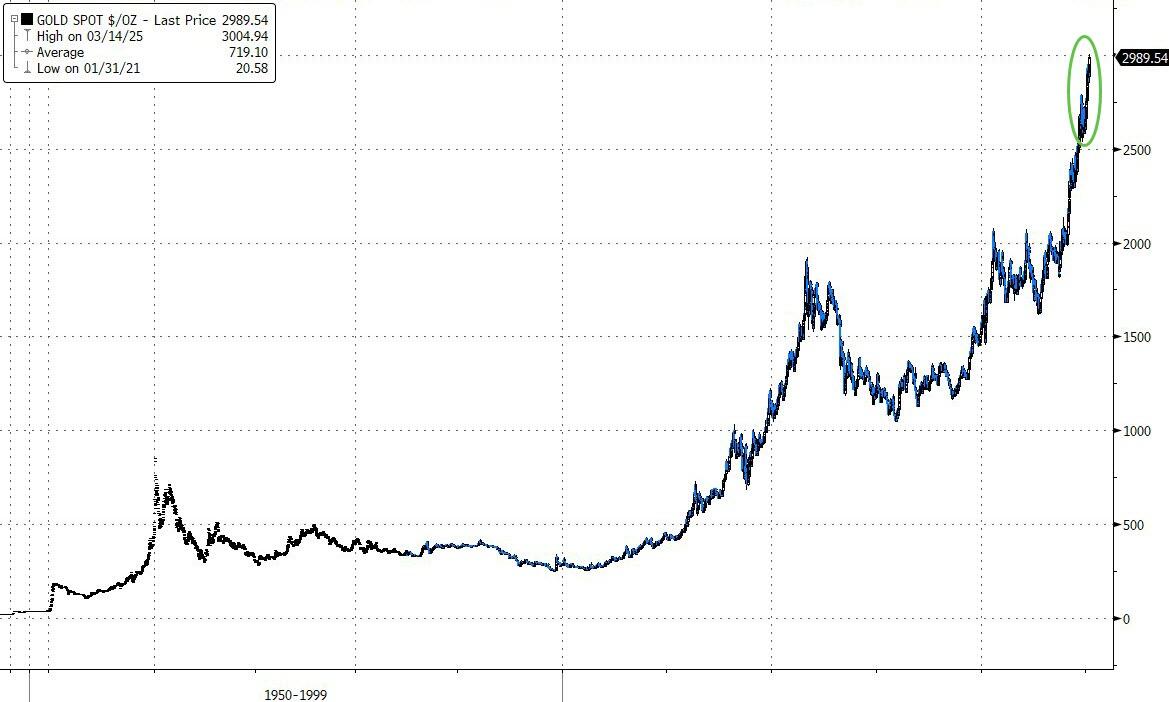
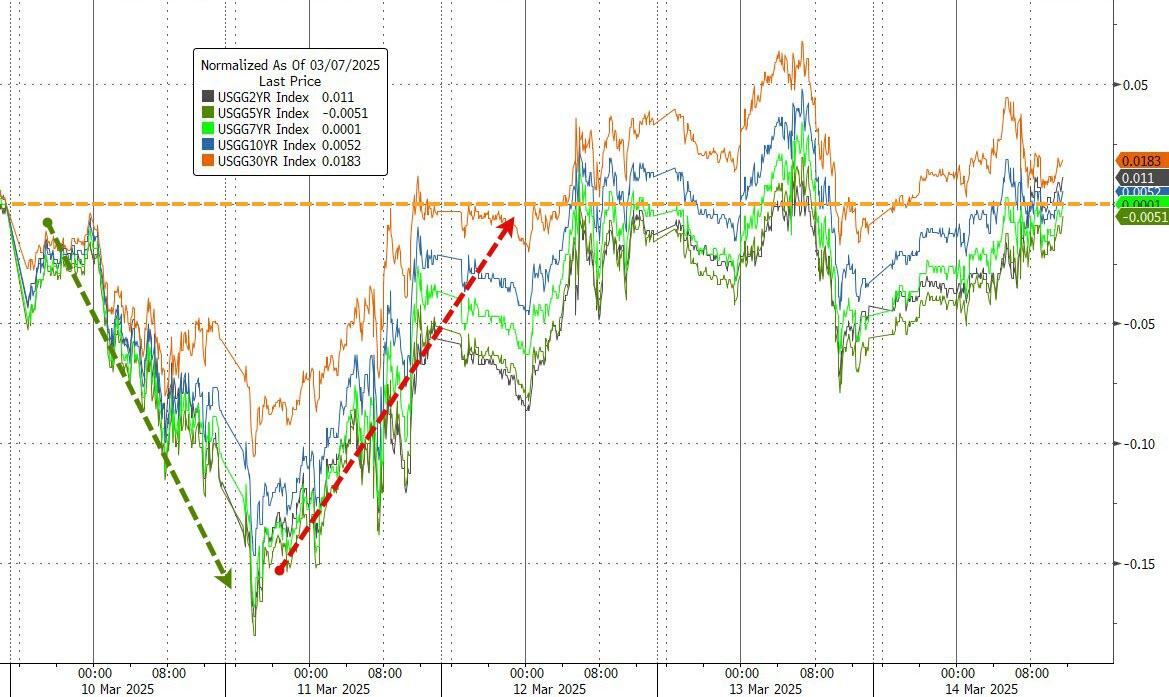
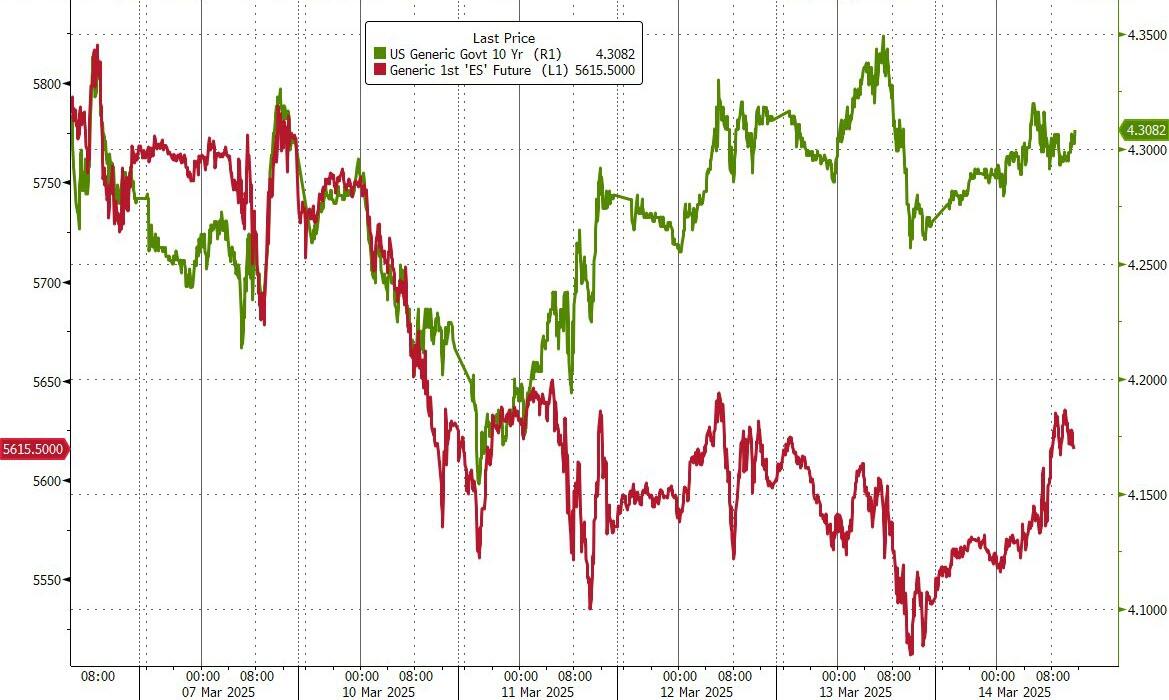
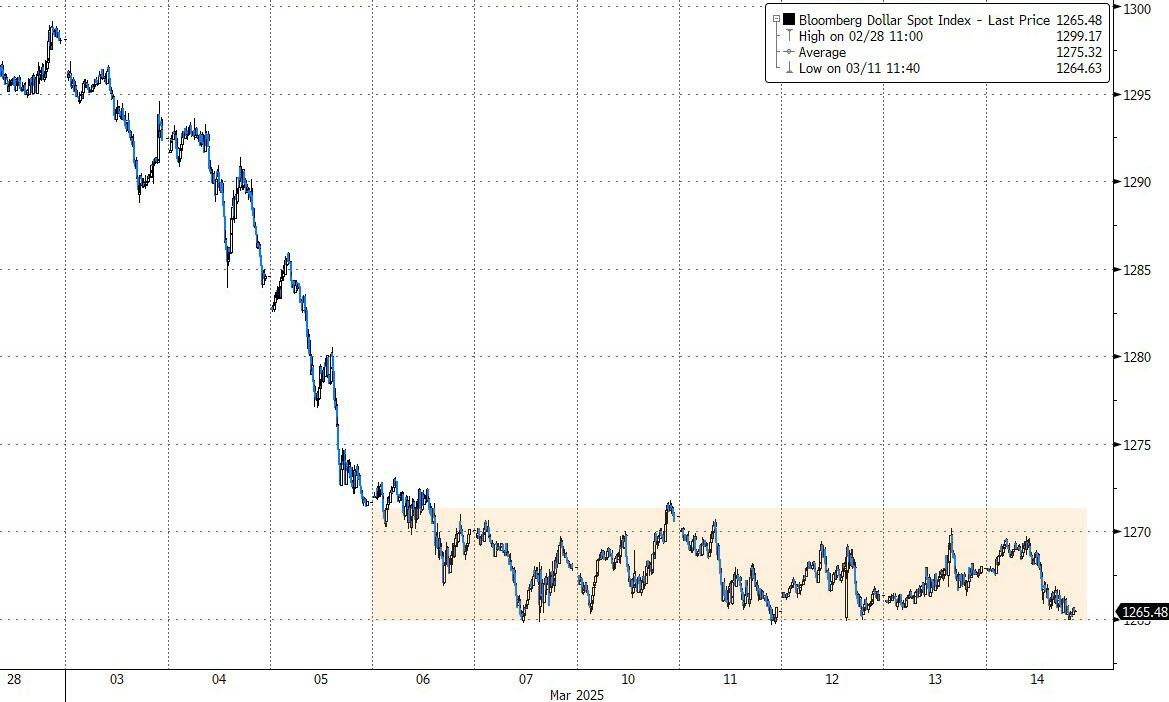
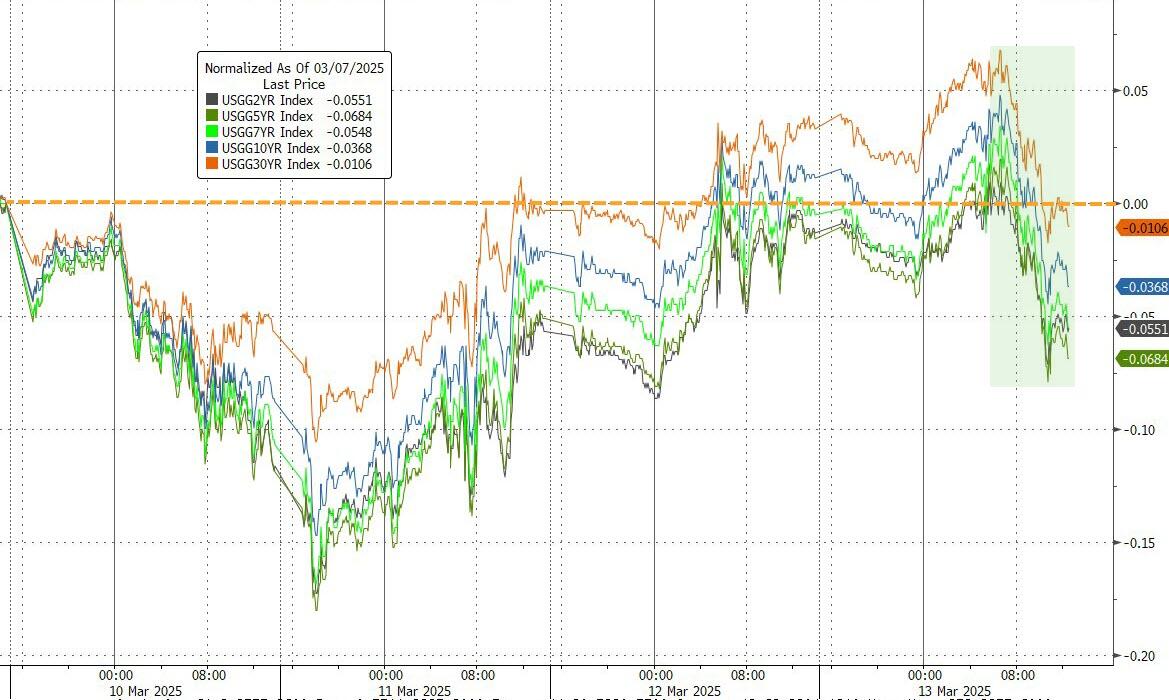
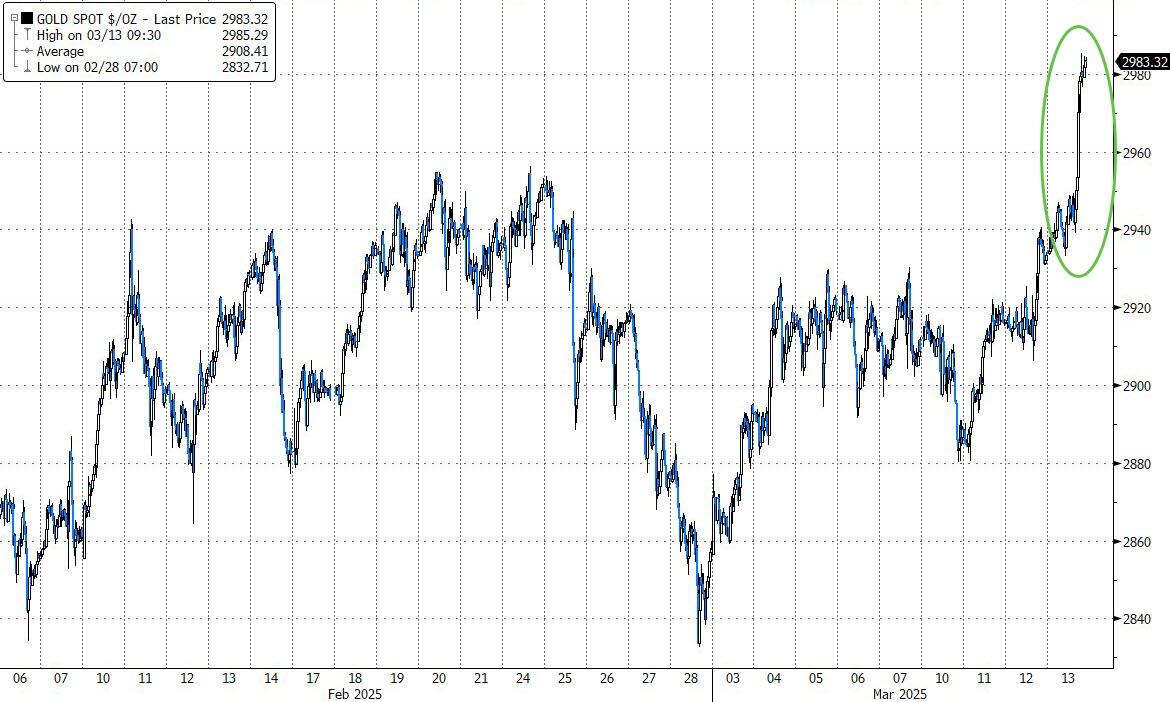
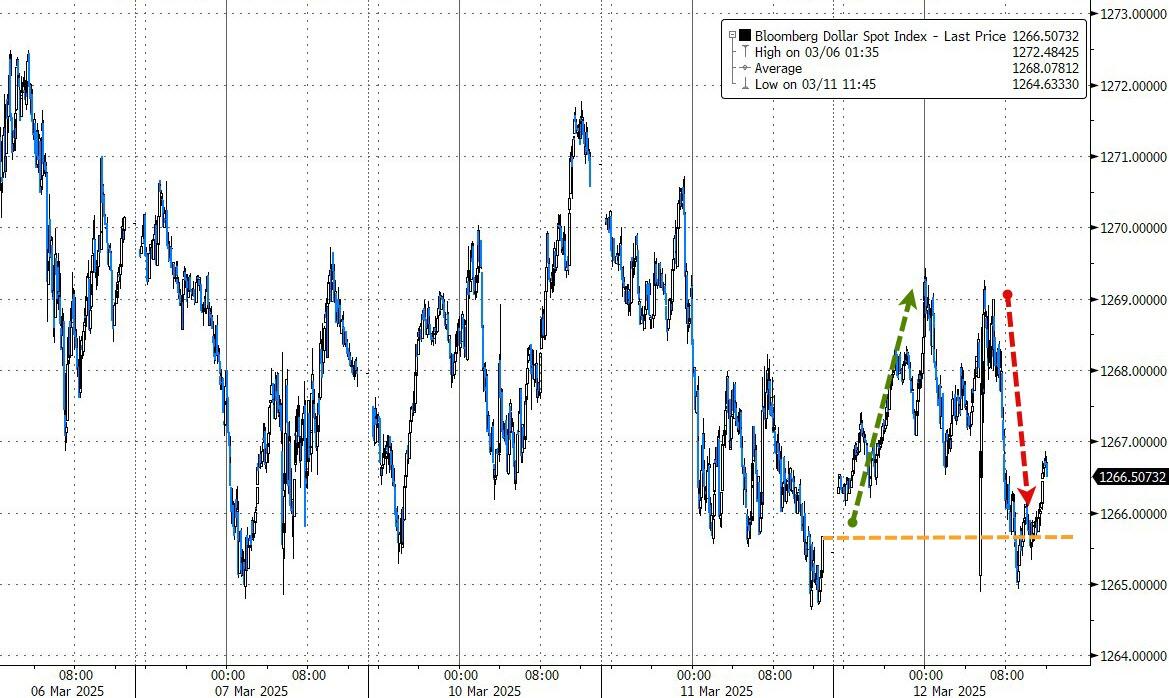
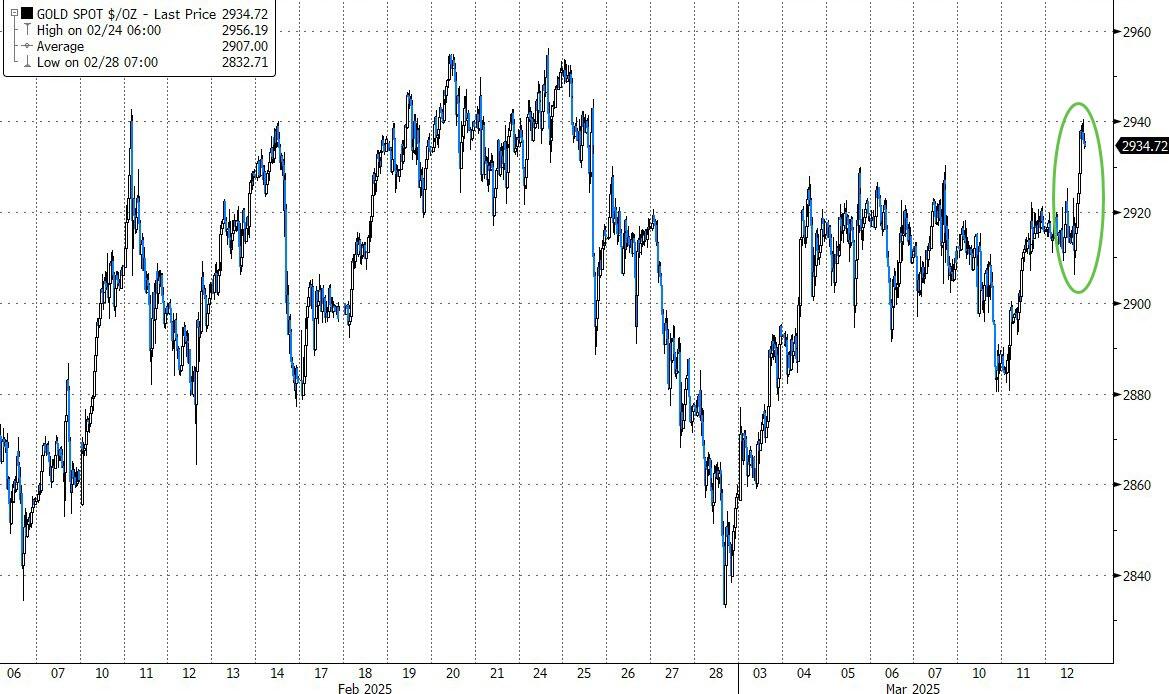
The biggest 2-day short squeeze since last July helped stocks stay on an upward path, despite mixed bond yields. Gold bounced against its $3,000 overhead ceiling and managed to close above it, while the dollar broke below its recent trading range.
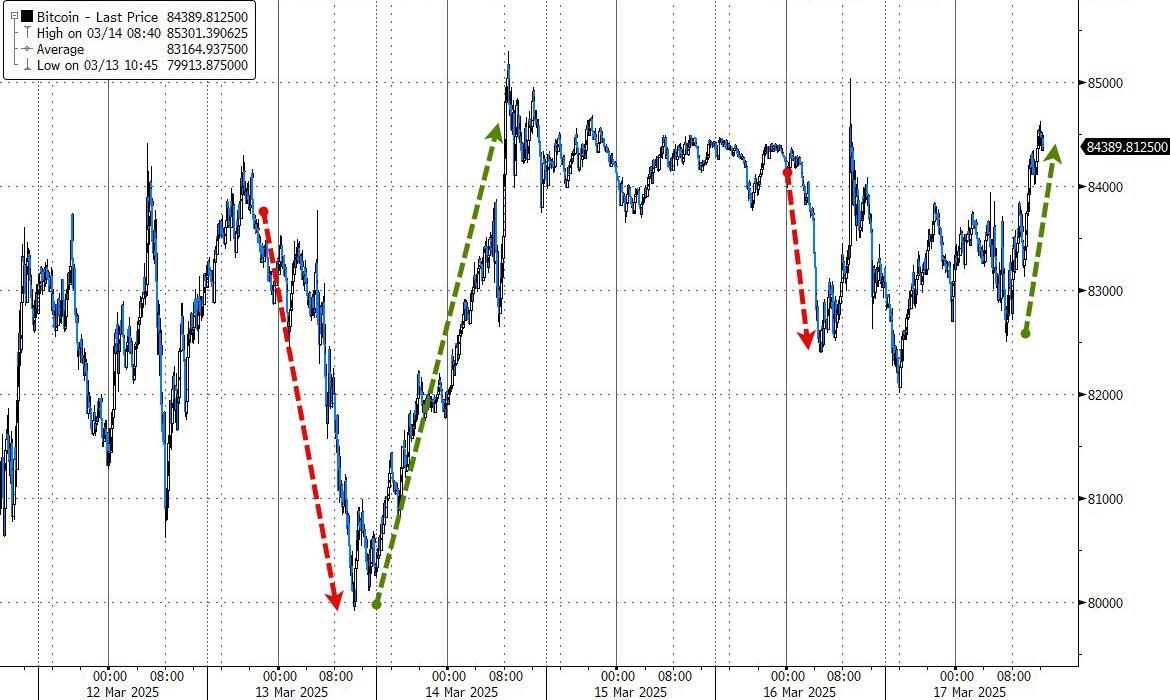
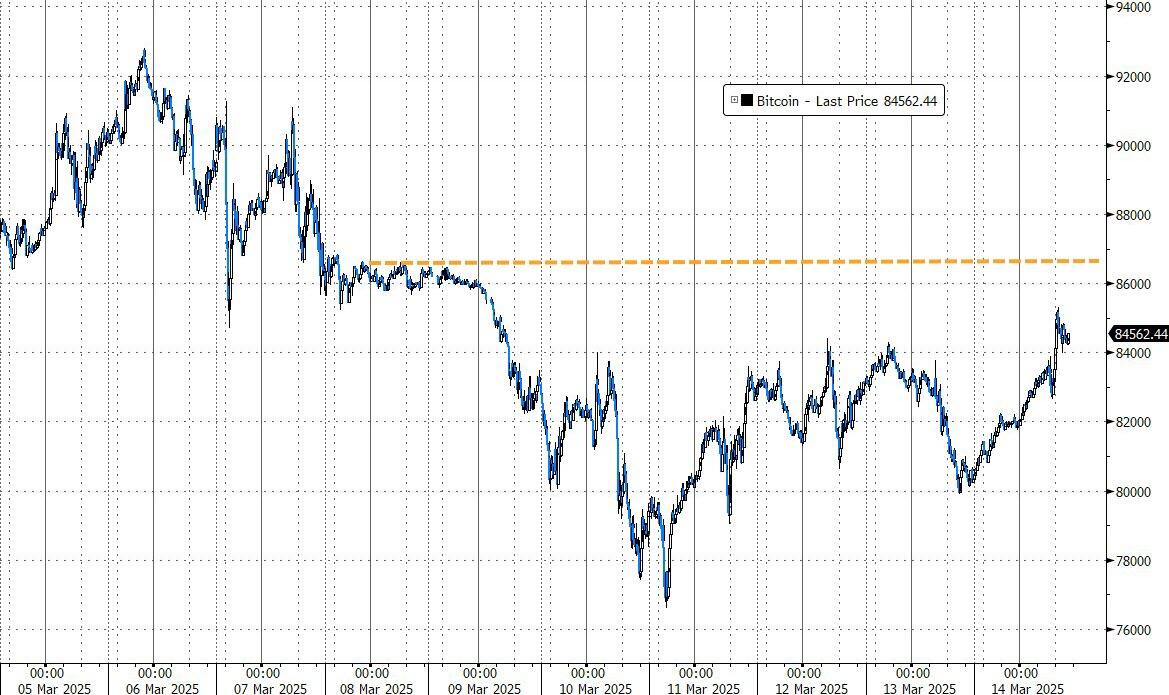
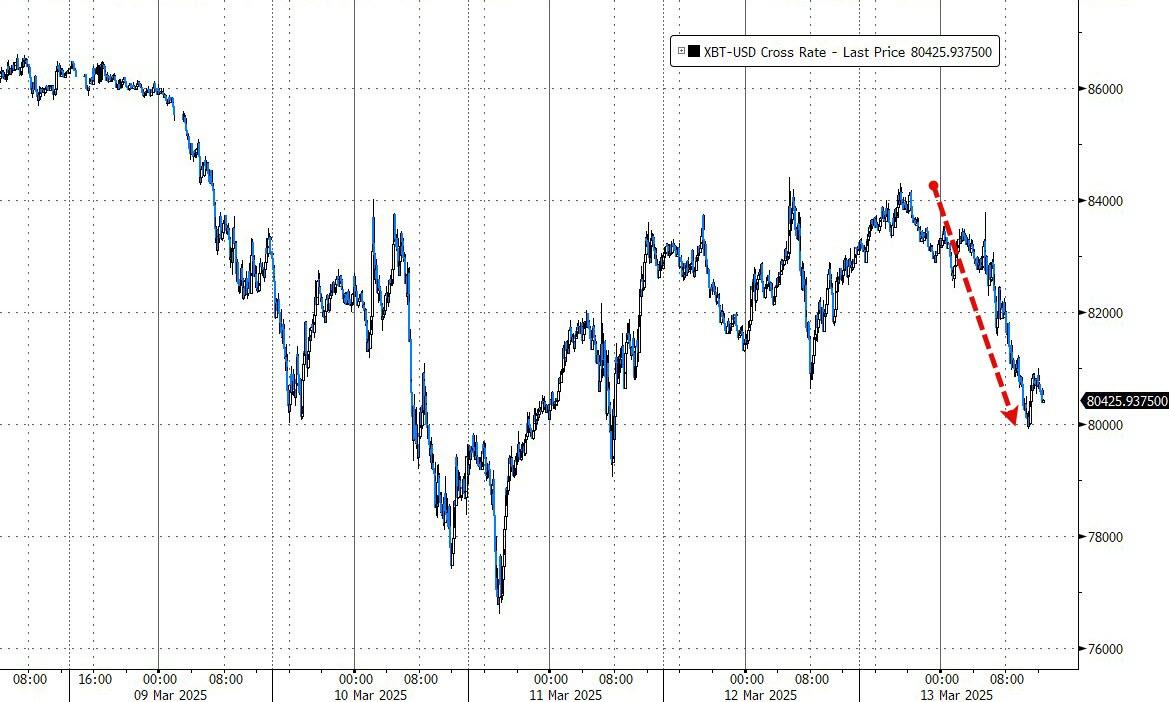
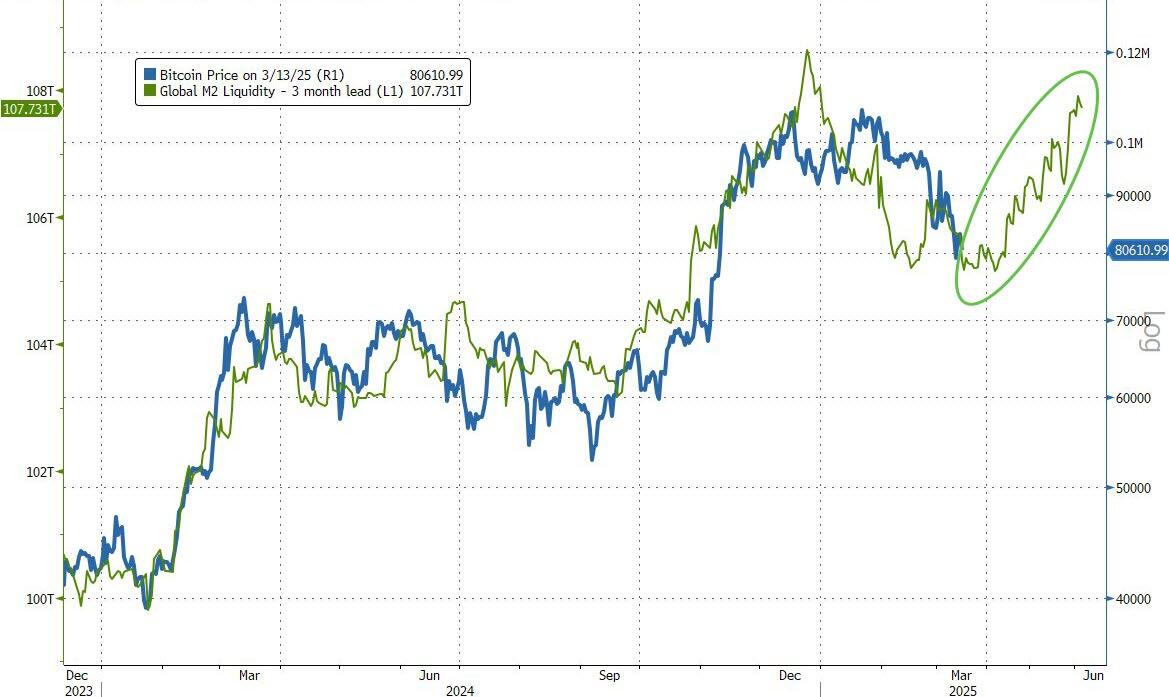
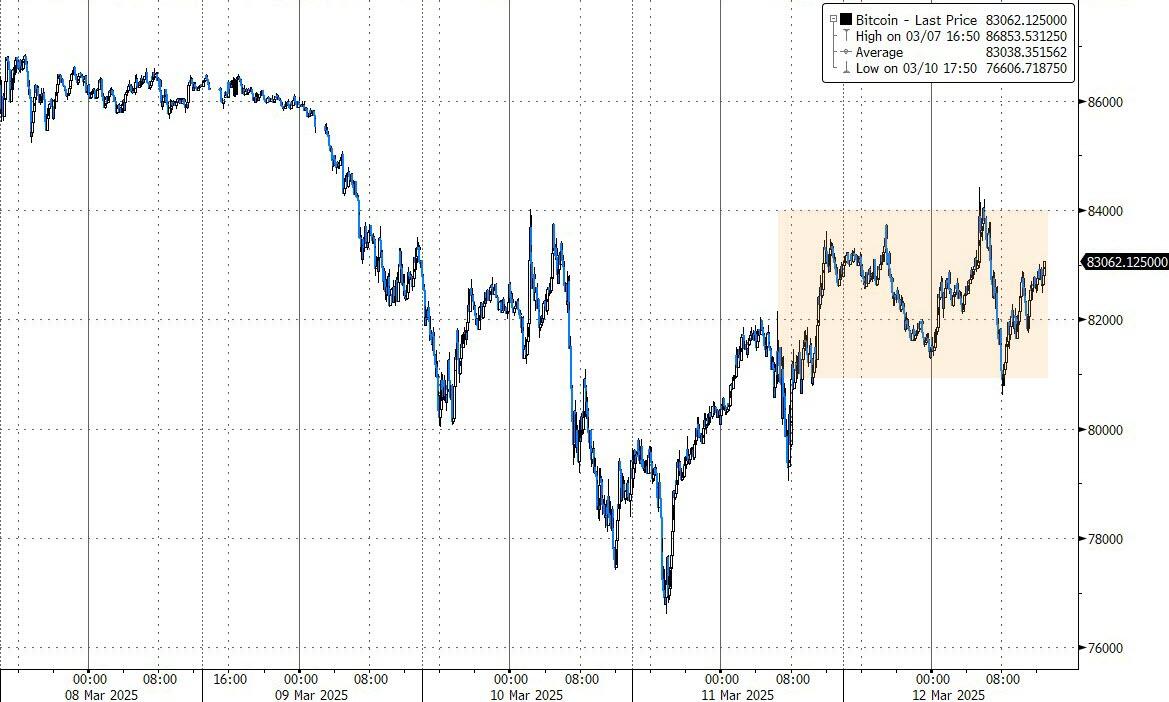
Bitcoin exhibited its usual volatility over the weekend, first falling to $82k before rebounding to nearly $85k.
Our domestic Trend Tracking Index (TTI) surged during the past two sessions, recovering almost all losses from the recent sell-off. See section 3 for more details.
Read More

