Gold Gains Amid Market Turmoil And Dollar Rally

Ulli Market Commentary Contact

[Chart courtesy of MarketWatch.com]

  1. Moving the market

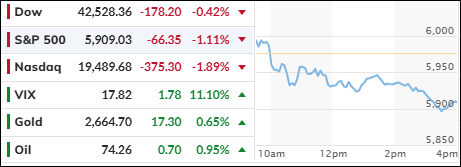
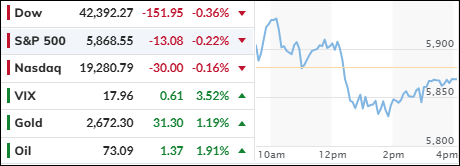
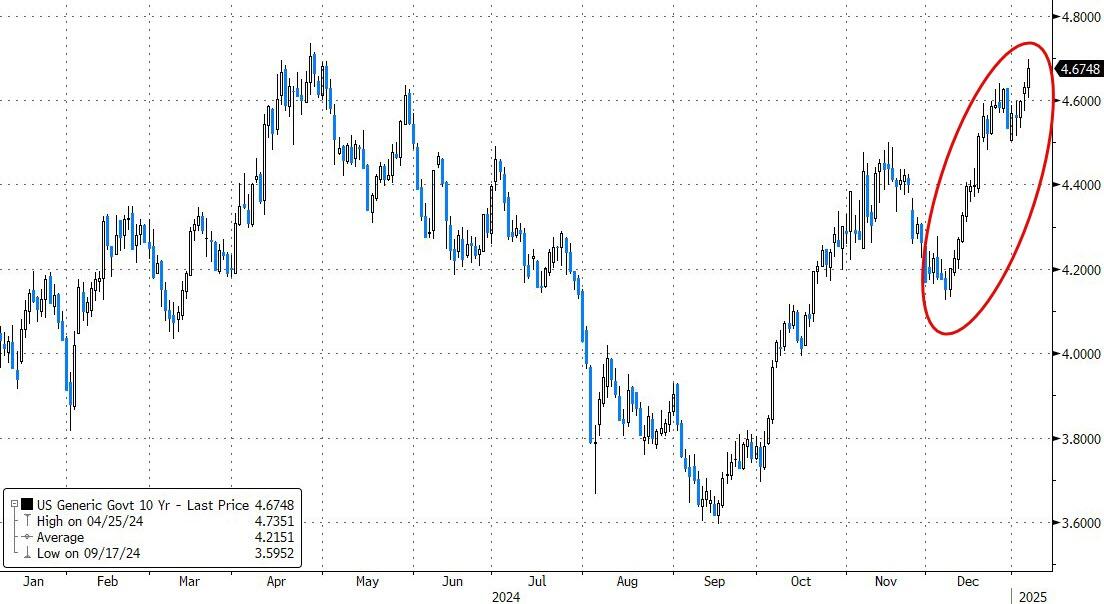
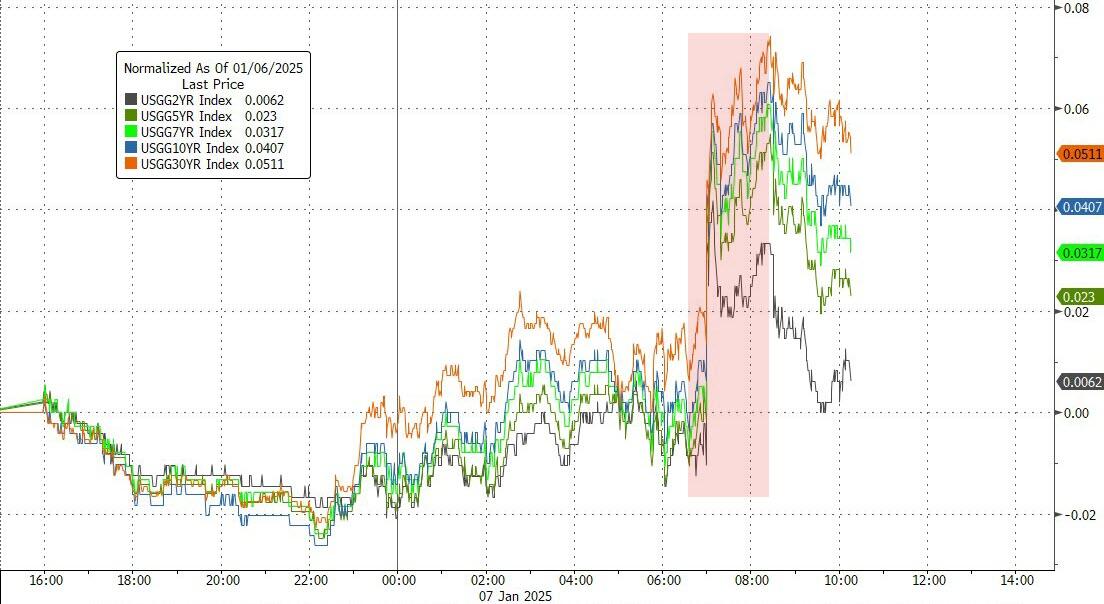
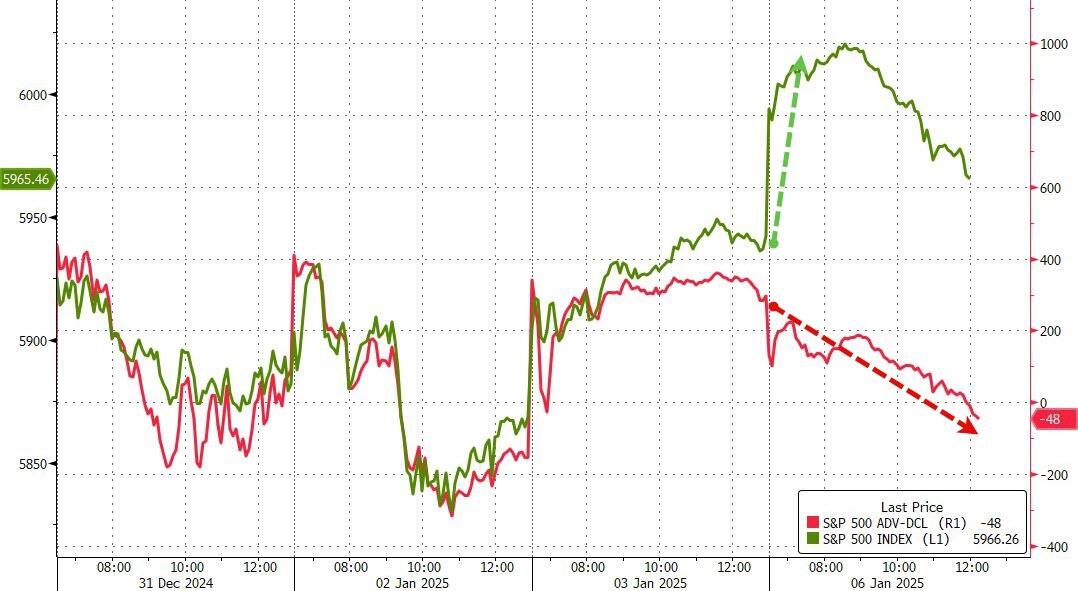
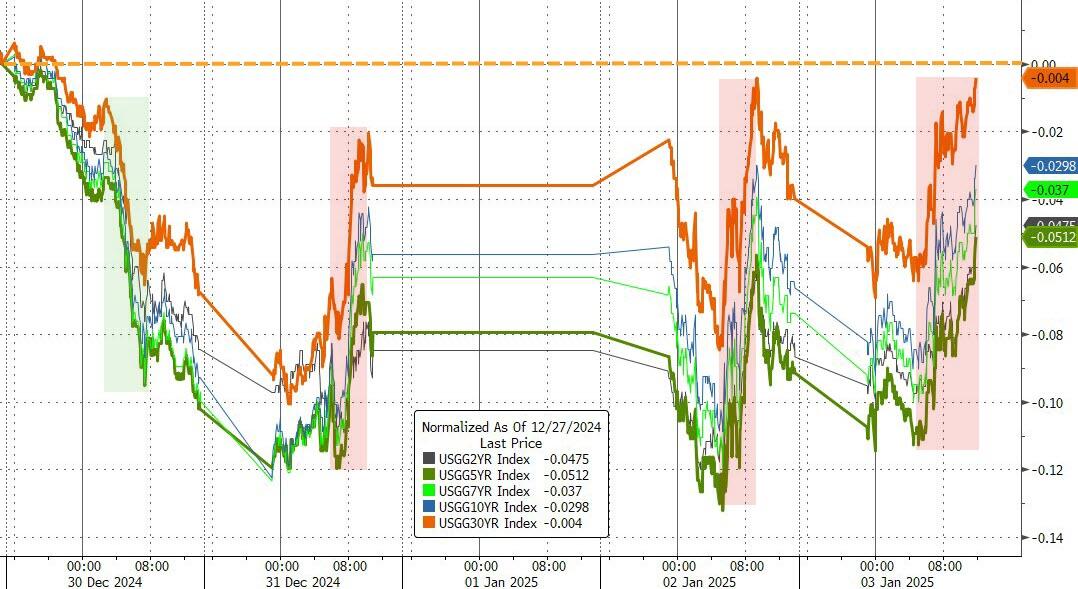
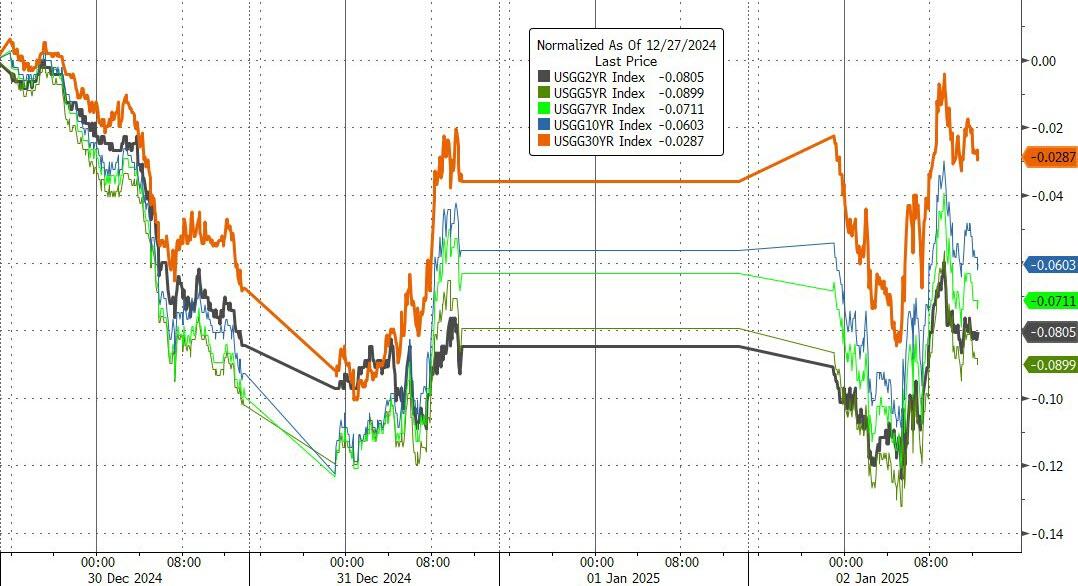
This morning, the markets experienced a significant downturn, with the Nasdaq leading the decline. Bond yields spiked, with the 10-year yield rising by 6 basis points to 4.70%, its highest level since April 2024.

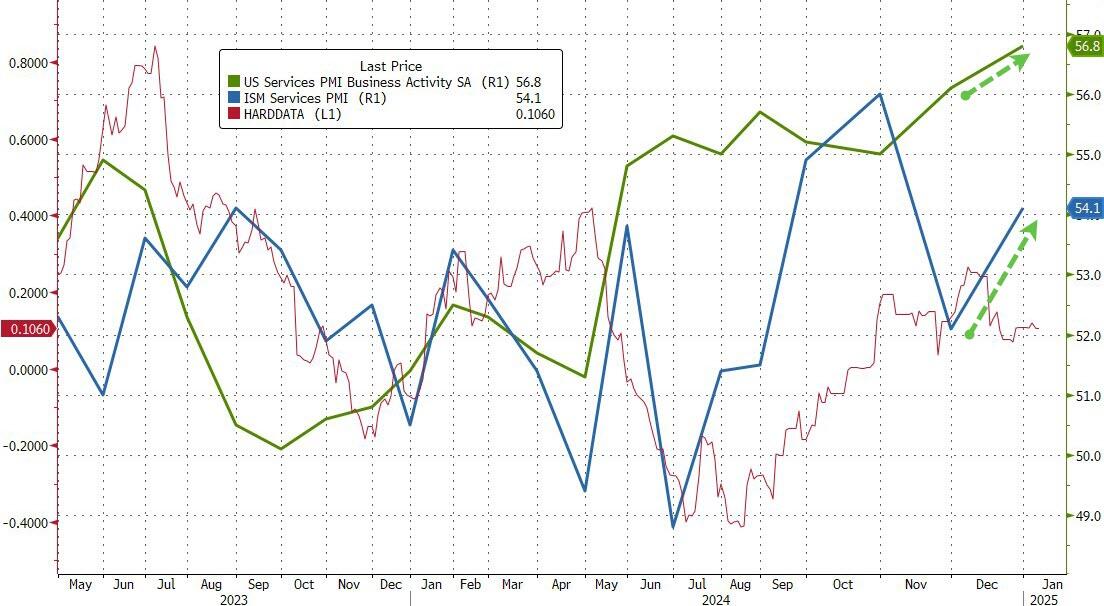
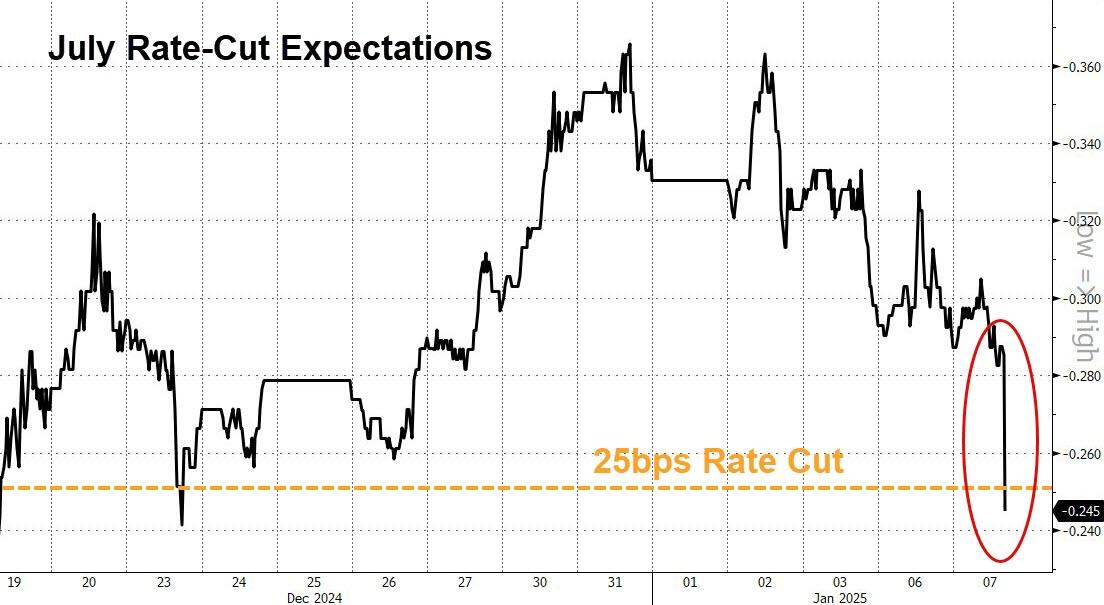
This spike was driven by the ISM Services Inflation Index, which surged to nearly two-year highs, casting doubt on the Federal Reserve’s willingness to further cut rates. Inflation expectations have now reached their highest point since February 2023, as noted by ZH.

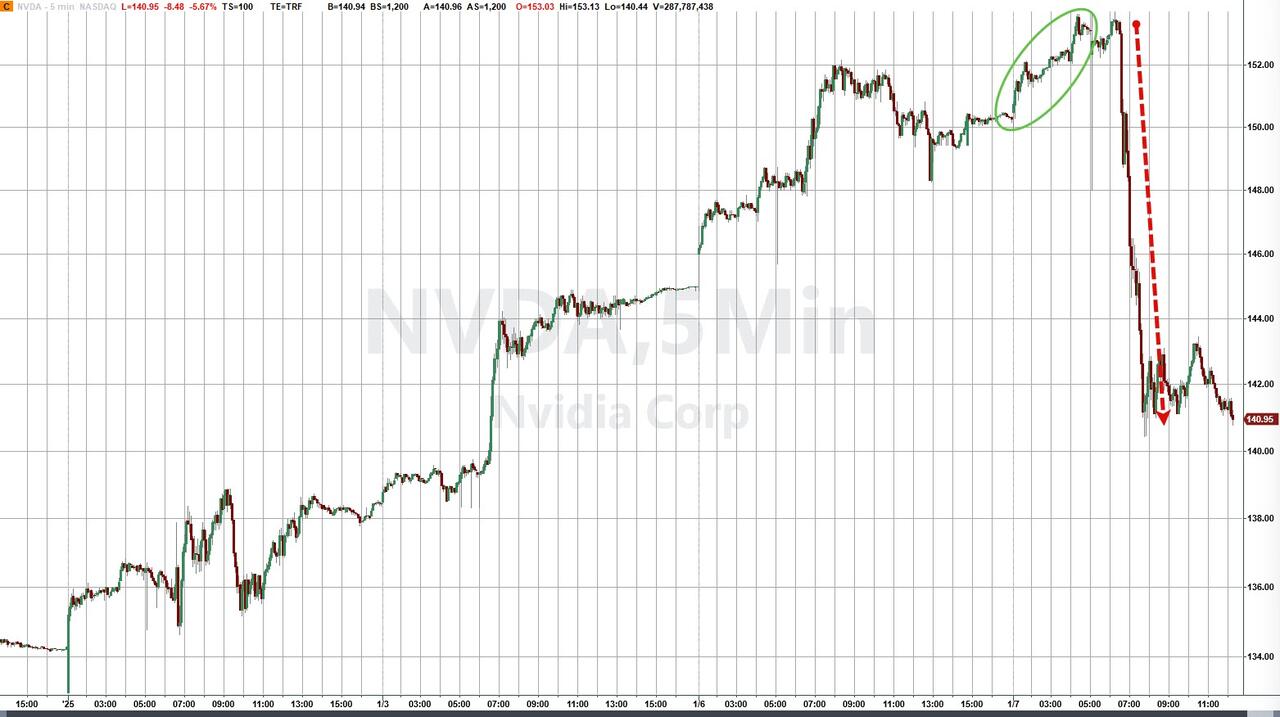
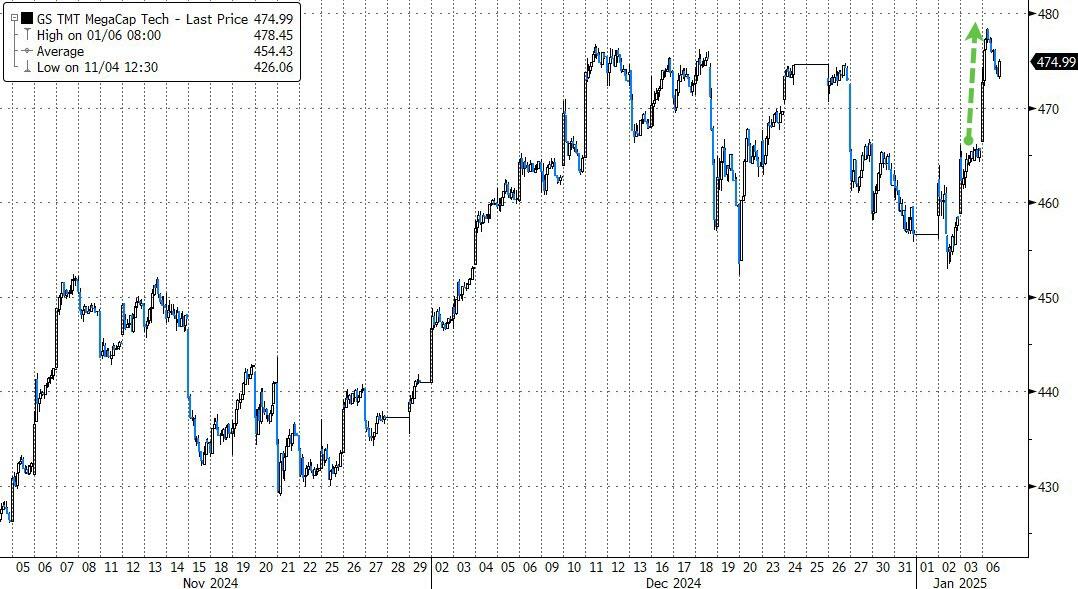
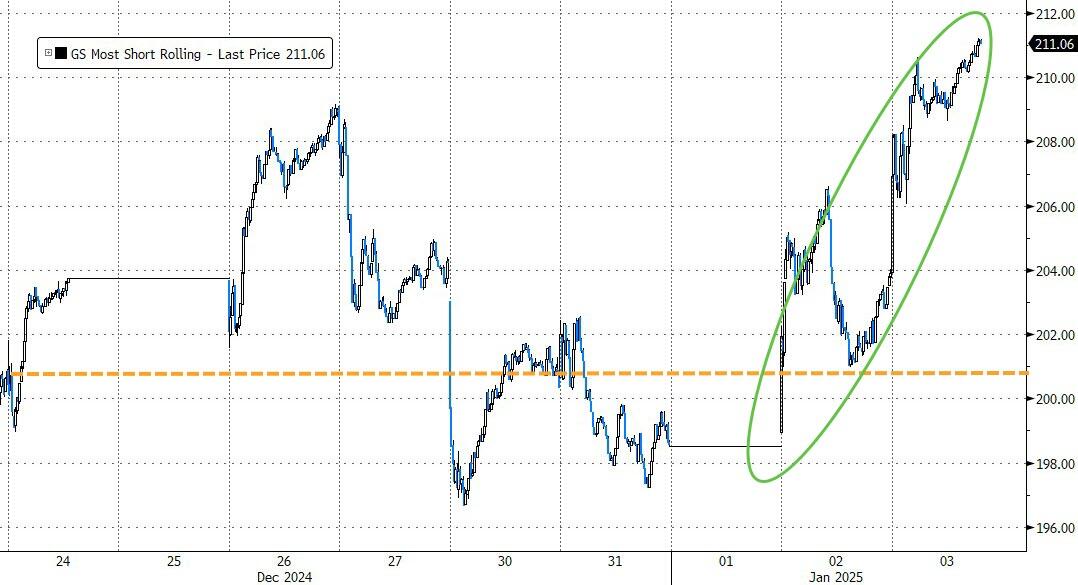
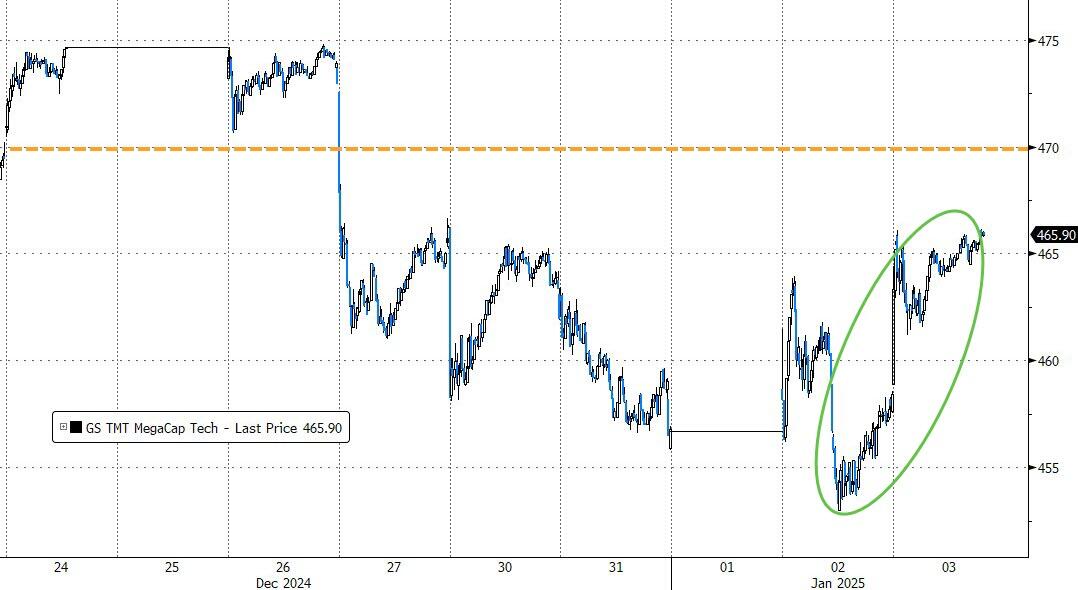
The tech sector faced additional pressure, with Nvidia shares dropping nearly 6% and failing to recover from their worst losses of the day.

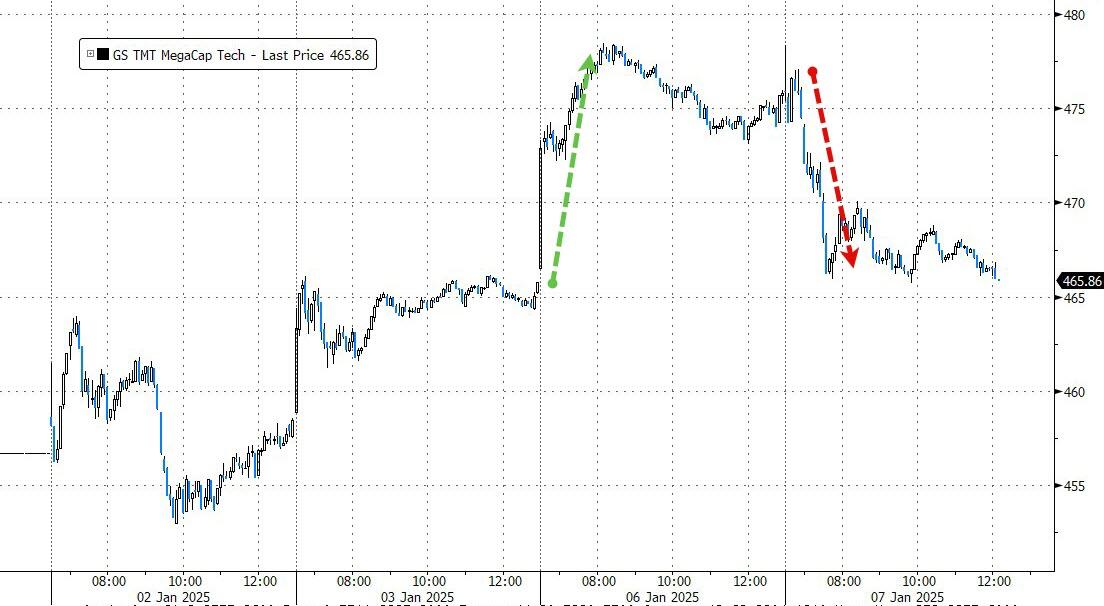
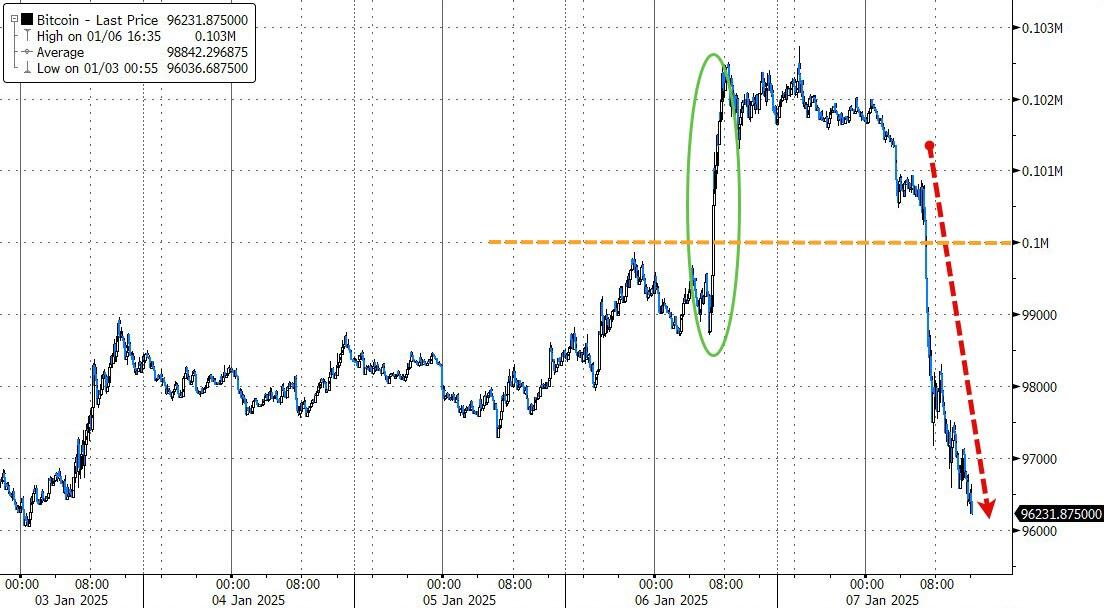
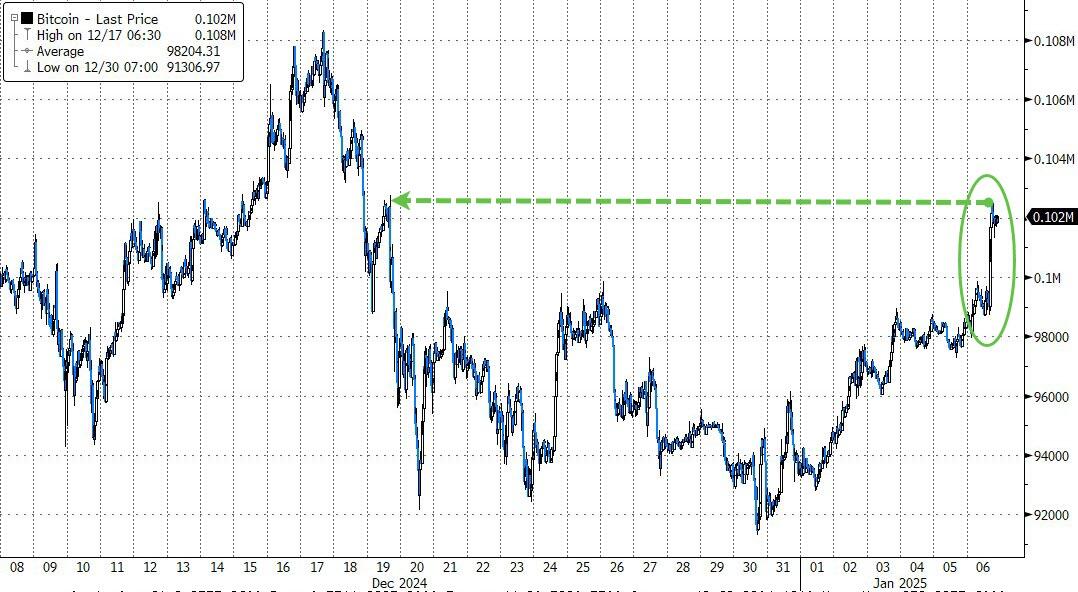
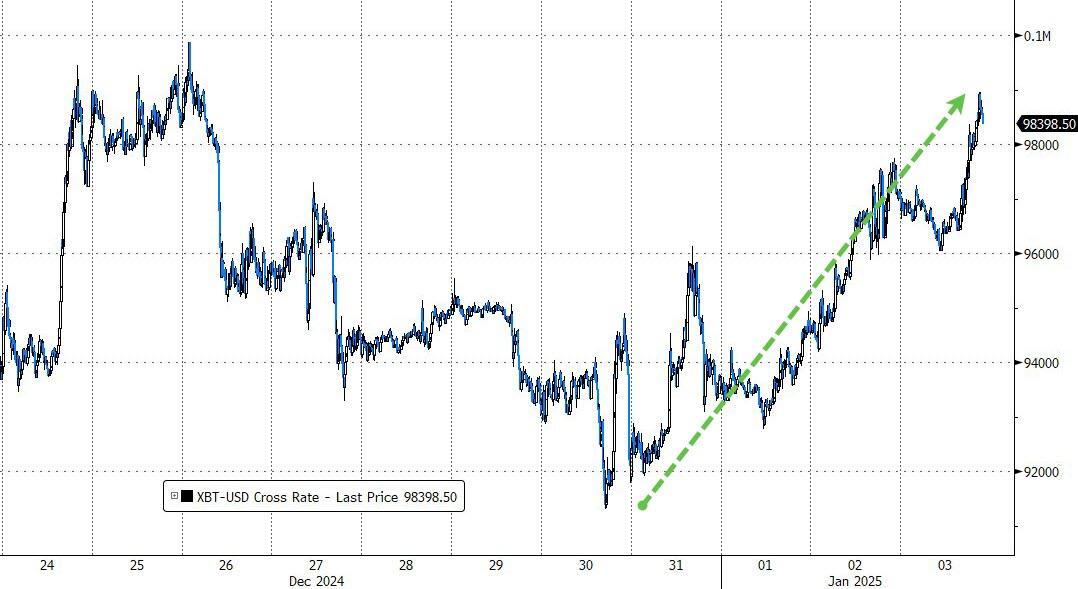
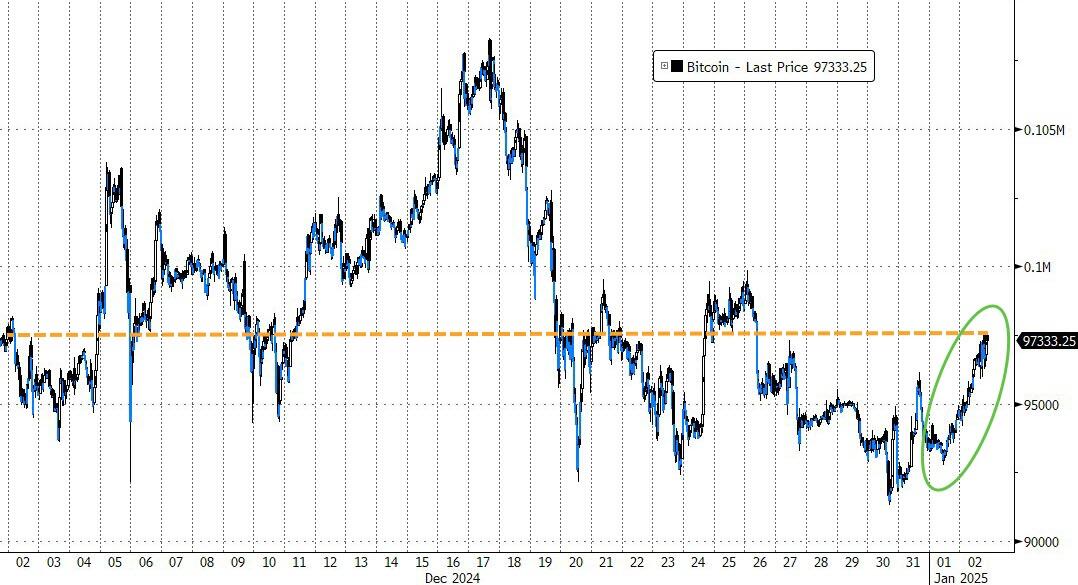
Additionally, Bank of America downgraded Tesla, causing its shares to slip by approximately 4.5%. This downgrade had a ripple effect, leading other mega-cap tech companies lower, along with Bitcoin, which fell below the $100,000 mark once again.

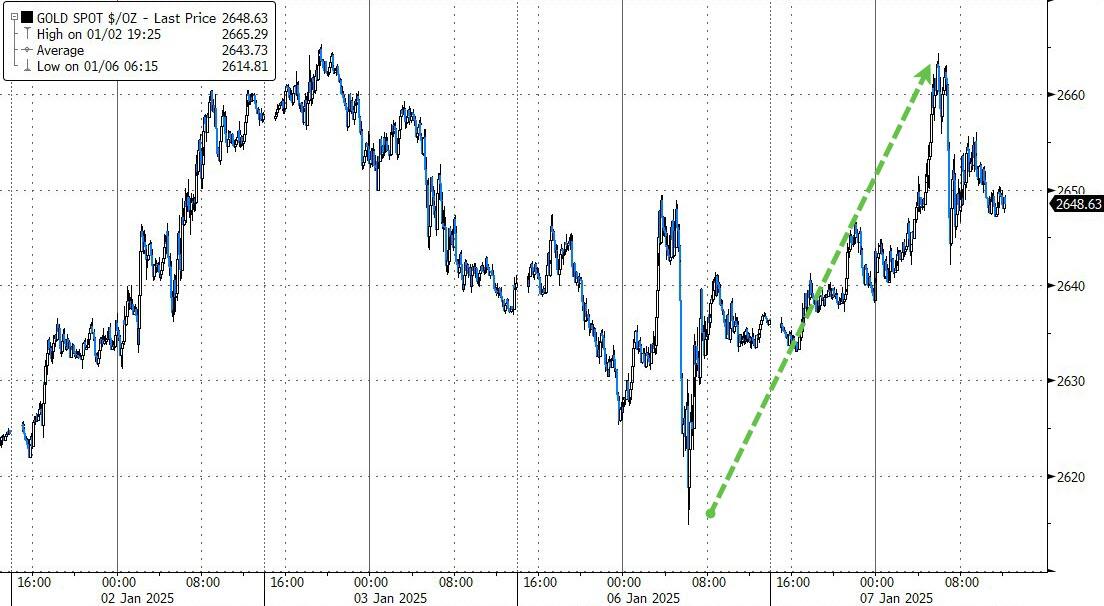
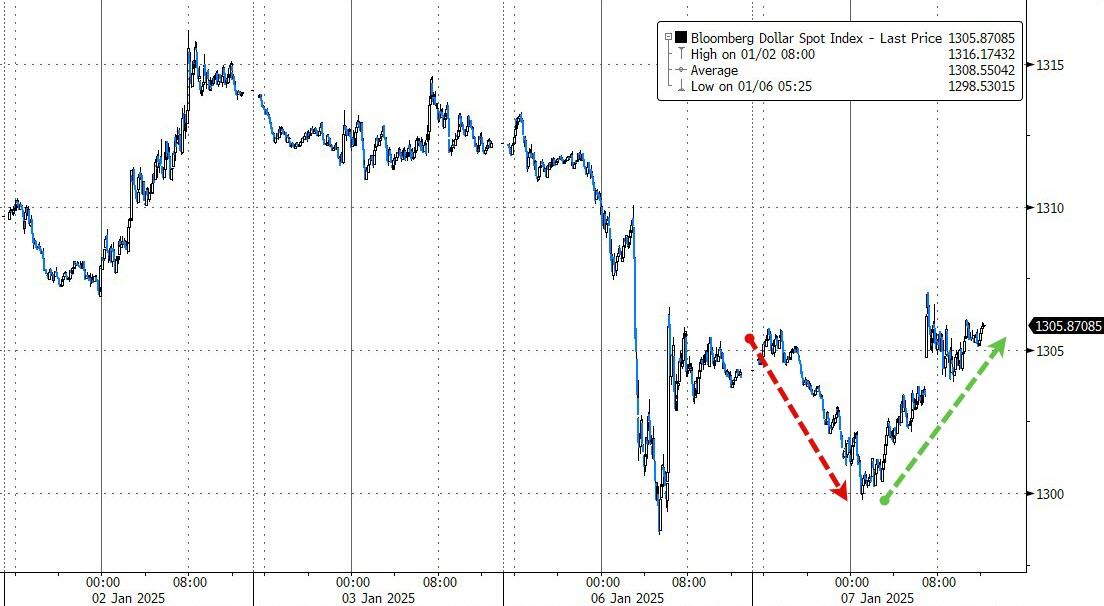
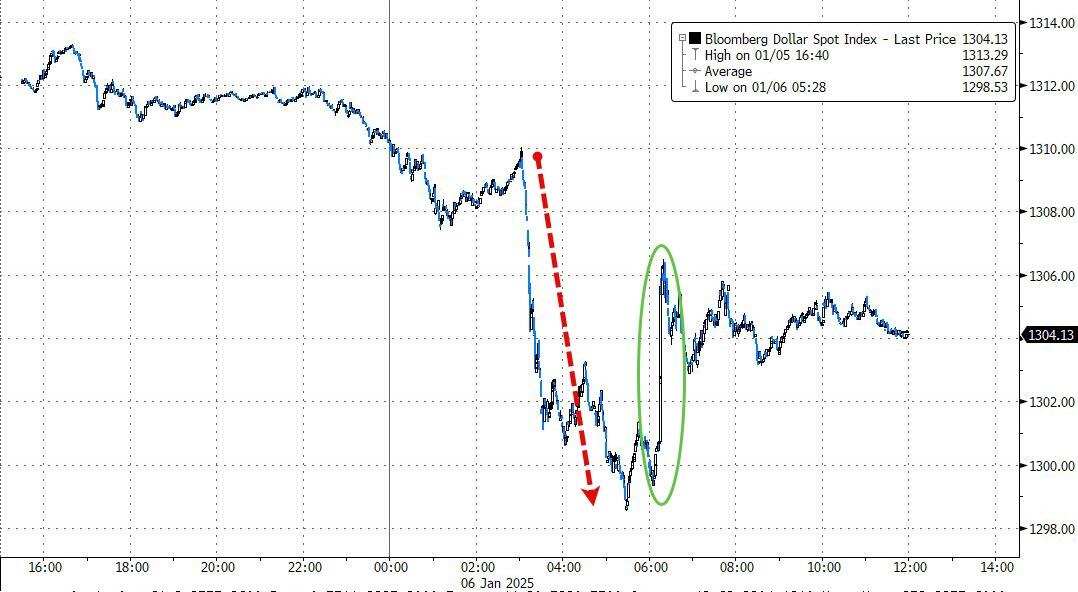
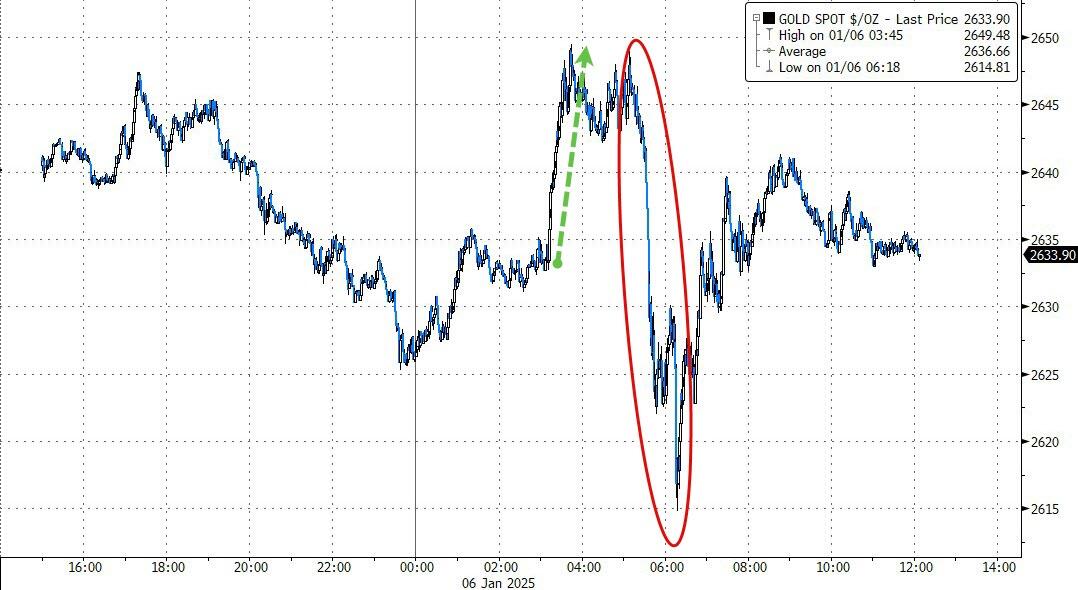
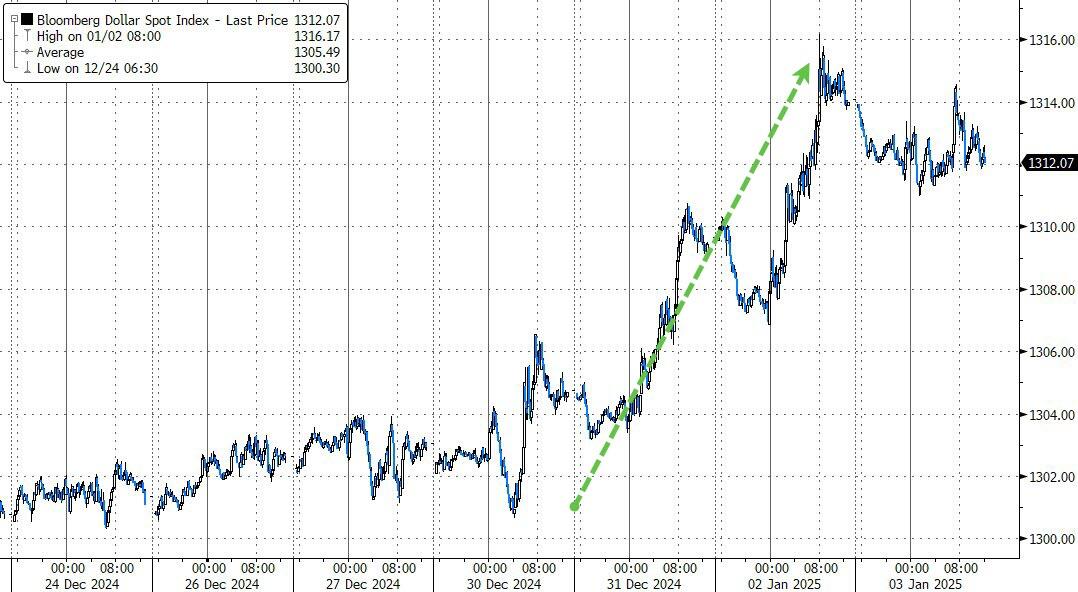
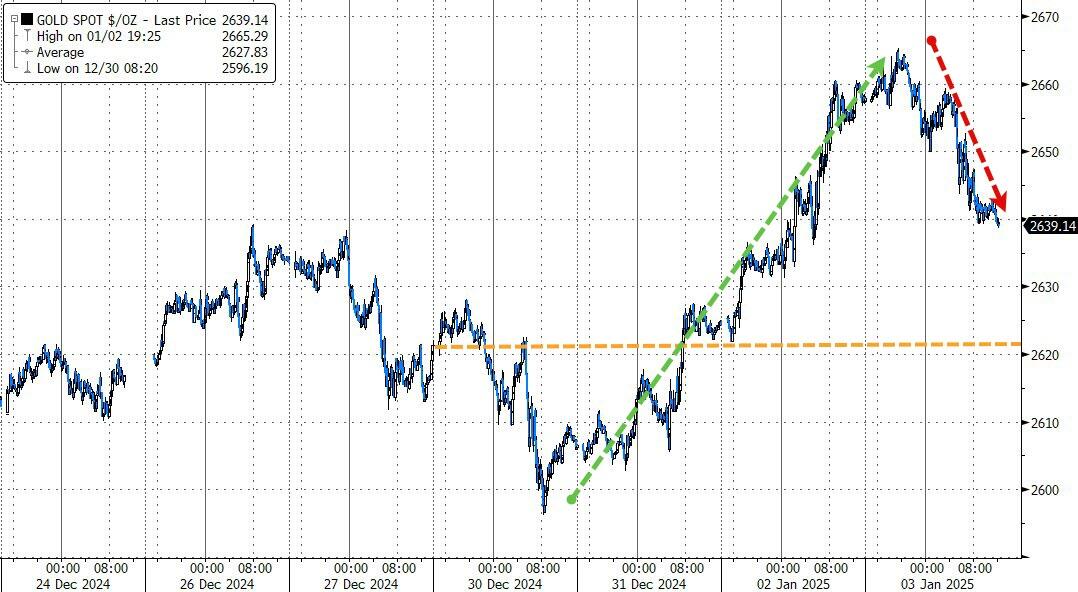
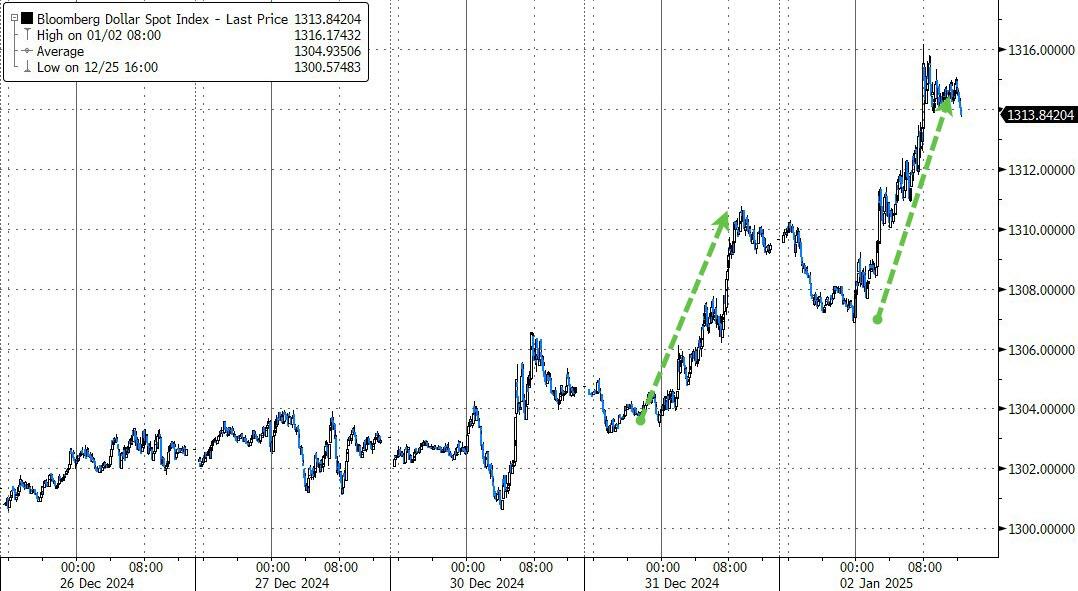
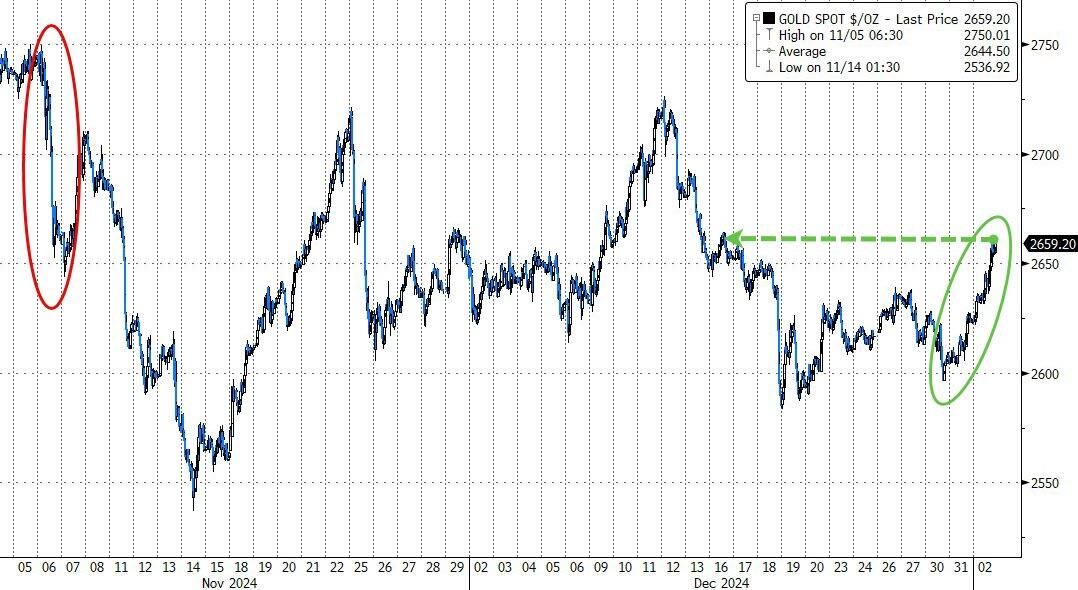
In contrast, gold managed to buck the trend, gaining 0.65% amid a moderate comeback rally in the dollar.

A press conference held by President-elect Trump generated a slew of headlines, ultimately pushing the volatility index higher and driving equities across the board lower. ZH compiled the following notable headlines:

-*Trump to announce $20B investment for new data centers: CNBC

– *Trump: Interest rates are far too high

– *Trump reiterates he’ll reverse Biden offshore drilling ban

– *Trump: Something will have to be done with Canada, Mexico trade

– *Trump: Will change name of Gulf of Mexico to Gulf of America

– *Trump threatens Denmark with tariffs over Greenland

– *Trump refuses to rule out economic, military tools for Panama

– *Trump: I want to see debt ceiling extension

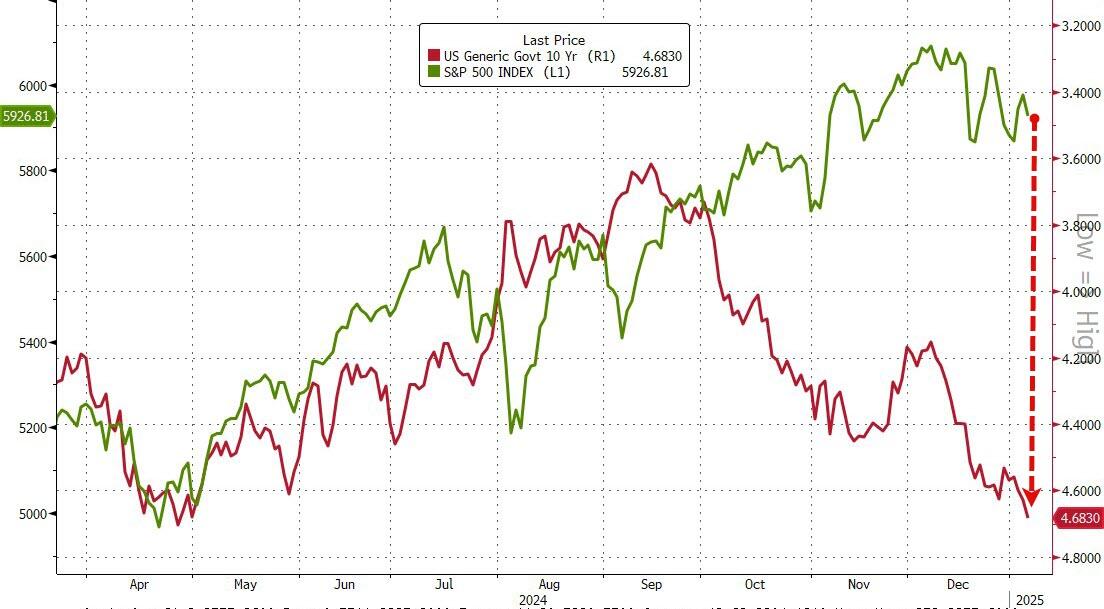
In the end, bonds sold off as yields surged, creating a significant divergence between equities and the rising 10-year yield.

This raises the question: How long can this divergence persist before the market corrects itself?

If it does, will equities head south, or will yields soften considerably?

Read More

Tech Sector Hits Record Highs, Bitcoin Surges

Ulli Market Commentary Contact

[Chart courtesy of MarketWatch.com]

  1. Moving the market

The markets opened on a positive note following last week’s pullback. The chip sector played a significant role in driving stocks higher, with Nvidia gaining nearly 5% early on, while Broadcom and Micron added 2.9% and 9%, respectively.

Early bullish sentiment was further supported by a Washington Post report suggesting that Trump’s tariff plan would be “narrower” than expected, targeting only critical imports. This marked a shift from campaign promises of “universal” tariffs in the 10%-20% range. However, this report turned out to be false, and the dollar recovered somewhat from an early sell-off.

Despite this, automakers advanced as fears of a global trade war eased. Traders are now keen to see how the markets perform during the first five trading days of the year, a period historically seen as an indicator of the year’s overall market direction.

While the Dow lost its early momentum and closed roughly unchanged, the S&P 500 and Nasdaq managed to close in the green. However, the negative breadth, with more declining stocks than advancing ones, indicates underlying weakness, as only a small number of S&P members contributed to the upswing.

The Mega-Cap tech sector reached new record highs today but faded by the end of the session. Gold struggled to find support after an early drop and failed to close in the green.

Meanwhile, Bitcoin surged, peaking at $102,000, its highest level in three weeks. With the incoming administration being extremely Bitcoin-friendly, a new all-time high could be on the horizon.

Read More

ETFs On The Cutline – Updated Through 01/03/2025

Ulli ETFs on the Cutline Contact

Do you want to know which ETFs are hot and which ones are not? Then you need my High-Volume ETF Cutline report. It tells you how close or far each of the 311 ETFs I follow is from its long-term trend line (39-week SMA). These are the ETFs that trade more than $5 million a day, so they are not some obscure funds that nobody cares about.

The report is split into two parts: The winners that are above their trend line (%M/A), and the losers that are below it. The yellow line is the line of shame that separates them. You can see how many ETFs are in each group and how they have changed since the last report (144 vs. 144 current).

Take a peek:

The HV ETF Master Cutline Report

If you are confused by some of the terms we use, don’t panic. I have a helpful Glossary of Terms for you.

If you want to learn more about the Cutline method and how it can make you rich (or at least less poor), read my original post here.

ETF Tracker Newsletter For January 3, 2025

Ulli ETF Tracker Contact

ETF Tracker StatSheet          

You can view the latest version here.

MARKET RALLIES AS TRADERS SHAKE OFF LOSING STREAK

[Chart courtesy of MarketWatch.com]

  1. Moving the market

Early in the session, the broad market rallied as traders attempted to shake off a five-day losing streak and overcome a volatile start to 2025. Their efforts finally paid off.

Nvidia led the tech sector with a solid 4.5% advance, while the consumer discretionary sector also posted gains. Profit-taking has been central to the recent pullback, with significant 2024 performers like Apple and Tesla experiencing temporary hits.

The year 2024 ended on a sour note for the S&P 500. Despite achieving a 23% gain for the year, the index lost 2.5% in December and ended the month with four consecutive days of losses, thereby neutralizing the much-anticipated Santa Claus rally.

On the economic front, US manufacturing remained in contraction mode after a challenging end to 2024, with optimism for growth in the year ahead waning. The primary reason was an increased rate of production cuts in December due to a disappointing inflow of new orders.

The most shorted stocks were sharply squeezed, providing a boost to equities, with the Mega-Cap tech basket also participating. Bond yields slipped for the week, while the dollar continued its relentless rally.

Bitcoin had its best week since Thanksgiving, nearly recouping its $99k level. Despite retreating today, gold ignored the strong dollar and recorded its best week since Thanksgiving as well.

A crack in consumer spending emerged as credit card defaults surged 50% from last year, reaching their highest levels since 2008. With the consumer contributing 67% of GDP, how will this affect future growth?

Does this indicate we might see a shrinking economy?

Read More

Weekly StatSheet For The ETF Tracker Newsletter – Updated Through 01/02/2025

Ulli ETF StatSheet Contact

ETF Data updated through Thursday, January 2, 2025

How to use this StatSheet:

  1. Out of the 1,800+ ETFs out there, I only pick the ones that trade over $5 million per day (HV ETFs), so you don’t get stuck with a lemon that nobody wants to buy or sell.
  1. Trend Tracking Indexes (TTIs)

These are the main indicators that tell you when to buy or sell Domestic and International ETFs (section 1 and 2). They do that by comparing their position to their long-term M/A (Moving Average). If they cross above, and stay there, it’s a green light to buy. If they fall below, and keep going, it’s a red light to sell. And to make sure you don’t lose your shirt if things go south, I also use a 12% trailing stop loss on all positions in these categories.

  1. All other investment areas don’t have a TTI and should be traded based on the position of each ETF relative to its own trend line (%M/A). That’s why I call them “Selective Buy.” In other words, if an ETF goes above its own trend line, you can buy it. But don’t forget to use a trailing sell stop of 12%, or less if you’re feeling nervous.

If some of these words sound like Greek to you, please check out the Glossary of Terms and new subscriber information in section 9.

  1. DOMESTIC EQUITY ETFs: BUY— since 11/21/2023

Click on chart to enlarge

This is our main compass, the Domestic Trend Tracking Index (TTI-green line in the above chart). It has broken above its long-term trend line (red) by +2.15% and is in “Buy” mode as posted.

Read More

Tech Giants Struggle As Major Indexes Reverse Early Gains

Ulli Market Commentary Contact

[Chart courtesy of MarketWatch.com]

  1. Moving the market

After a weak close to an otherwise strong 2024, the markets opened on a positive note, buoyed by Nvidia and the energy sector, which helped to boost bullish sentiment.

However, despite this encouraging start, the major indexes reversed course, and the gains evaporated, leading to a moderate close in the red. The silver lining was that the markets bounced off their worst levels, with Small Caps managing to eke out a green close.

Tech giant Tesla struggled, losing about 4% in early trading after reporting a decline in 2024 deliveries, while Apple’s stock also slipped into the red.

The so-called Magnificent 7 were the main drivers of last year’s market action, with Nvidia achieving a remarkable 171% gain for the year and Apple adding a solid 30%. However, these outsized gains led to profit-taking, which pulled the S&P 500 down during the last four trading days of 2024.

As we enter 2025, the question remains whether this tech-heavy performance will be sustainable. Despite this uncertainty, relentless exuberance and optimism persist, with traders pointing to economic strength and earnings growth as reasons for more upside potential.

Bond yields stayed in a tight range, while Bitcoin rallied back over $97.5k, remaining unchanged for the last month.

The dollar surged, but this was ignored by gold, which started strong and advanced by 1.20%. Not to be outdone, crude oil followed suit and recouped its $73 level.

Despite a shaky start, history suggests that the first two weeks of January are usually strong, as ZH posted with this chart.

Will history repeat itself?

Read More