Gold And Bitcoin Rebound Strongly, Oil Prices Decline

Ulli Market Commentary Contact

[Chart courtesy of MarketWatch.com]

  1. Moving the market

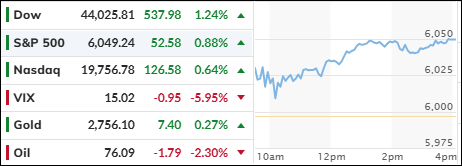
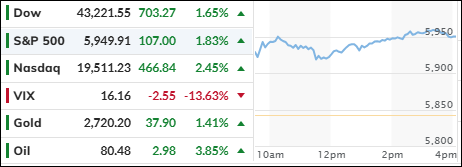
The major indexes began the “post-inauguration” session with a positive outlook, as traders interpreted Trump’s comments on tariffs as less severe than initially anticipated.

Small Caps led the early surge, bolstered by a better-than-expected earnings report from 3M, which saw its stock rise by more than 4%.

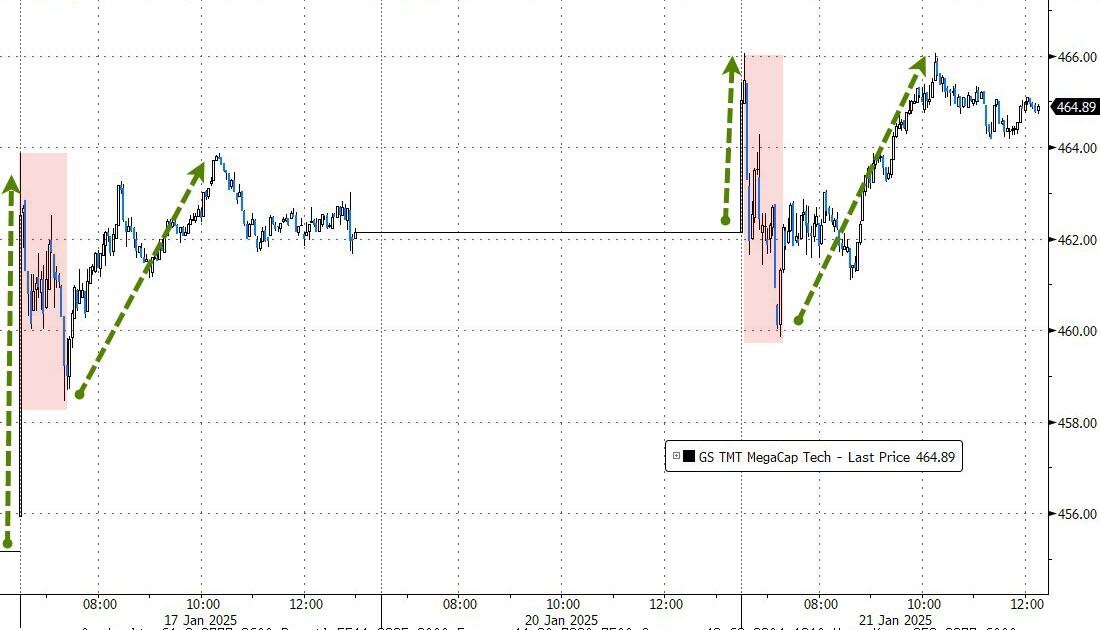
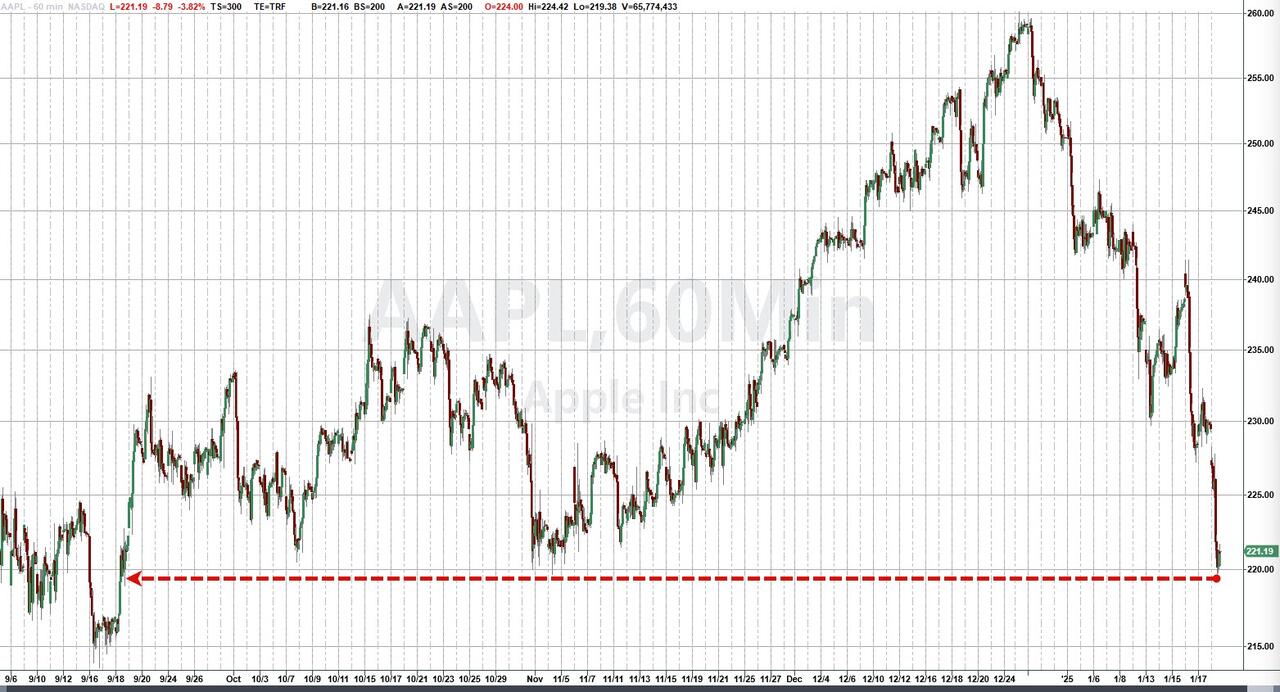
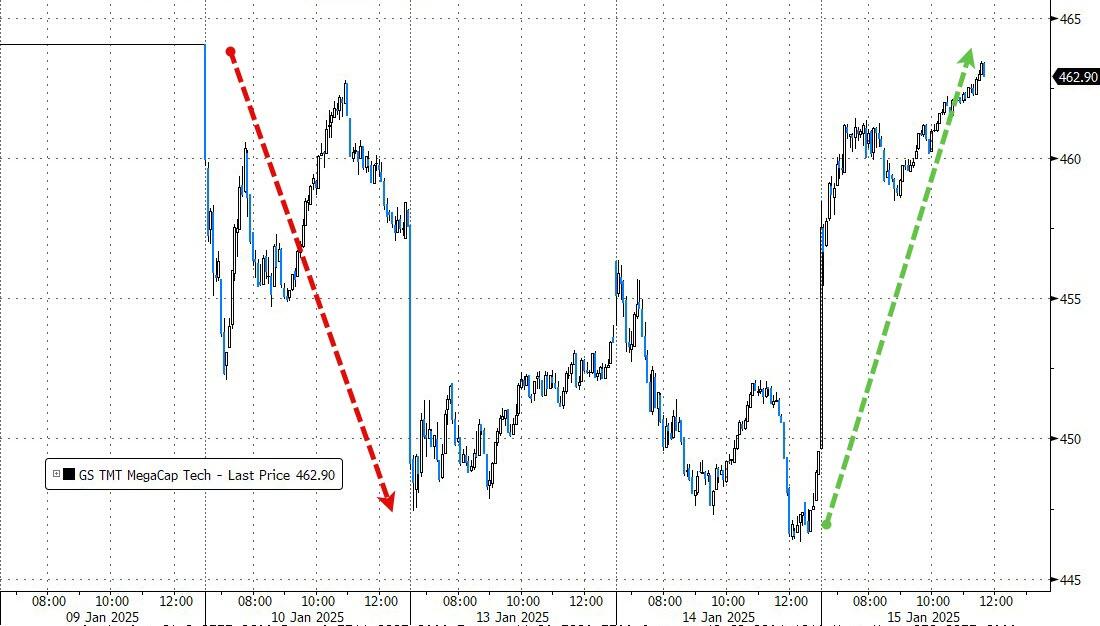
Mega-tech companies like Amazon and Alphabet also contributed to the upswing. However, Apple, having faced two downgrades and now down 16% from its record highs, kept the Nasdaq from fully participating in the rally.

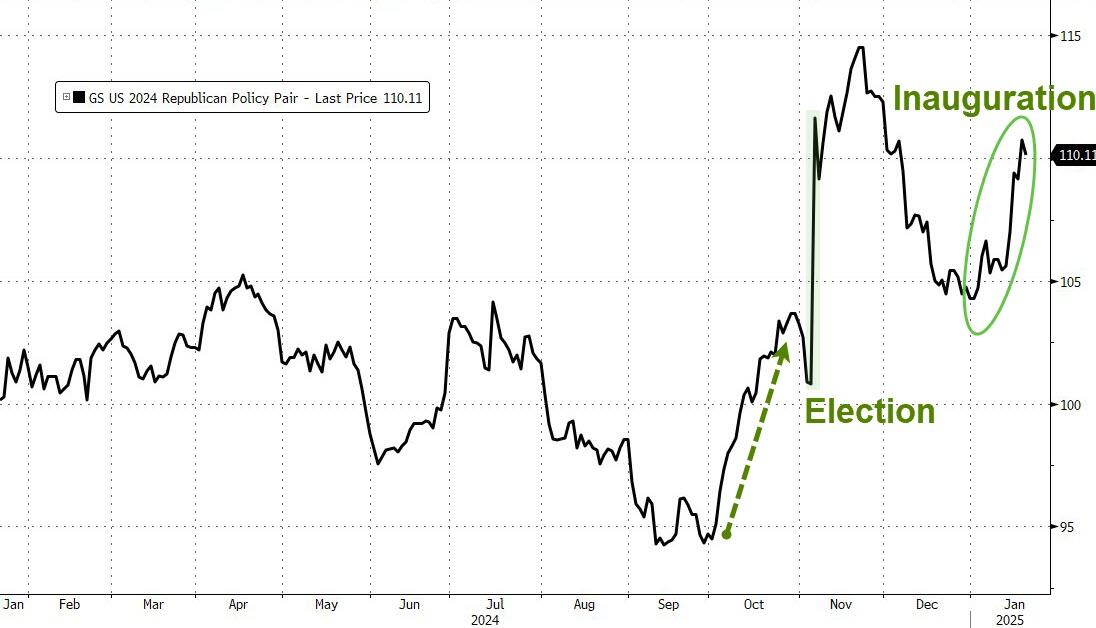
On Trump’s first day back in the Oval Office, unfair trade practices were a key focus. He issued a broad memorandum to Federal agencies to study the issue in more detail, easing Wall Street’s fears of an overly aggressive approach.

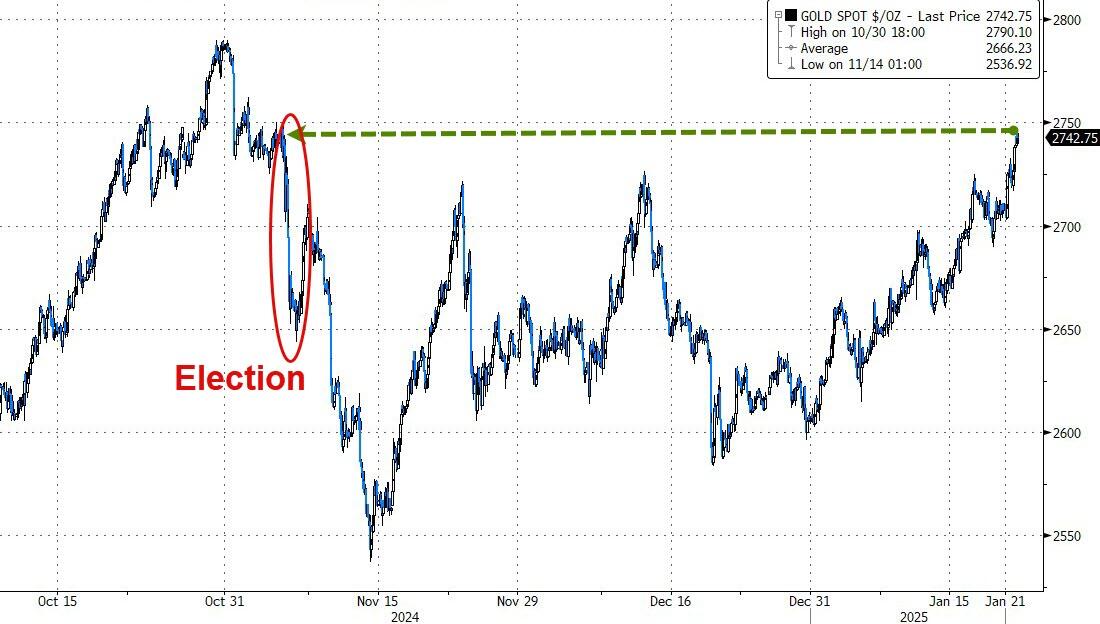
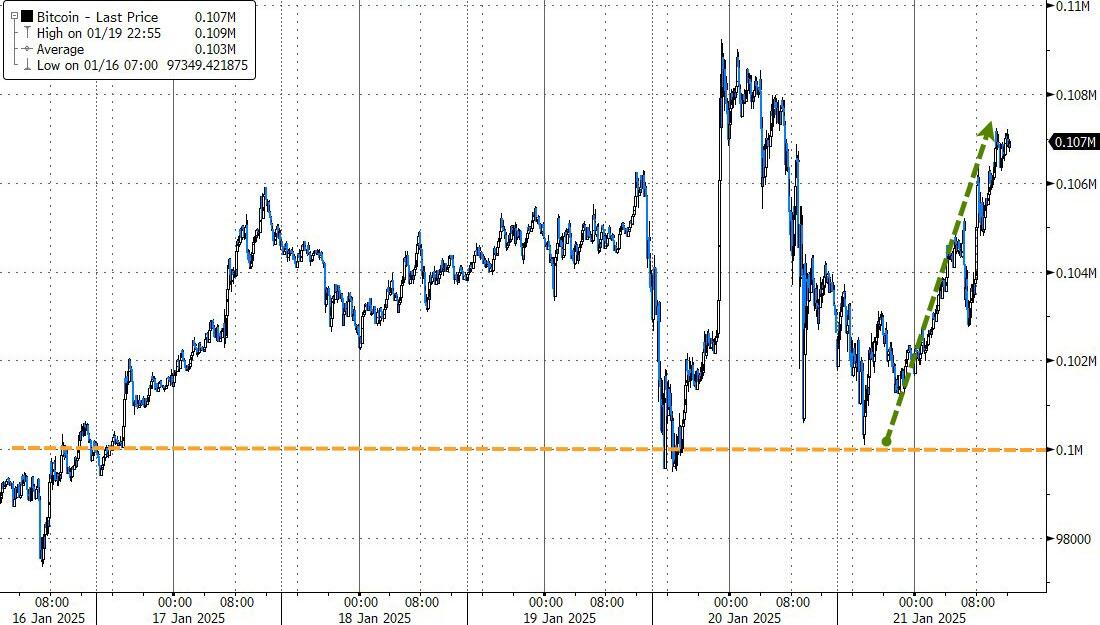
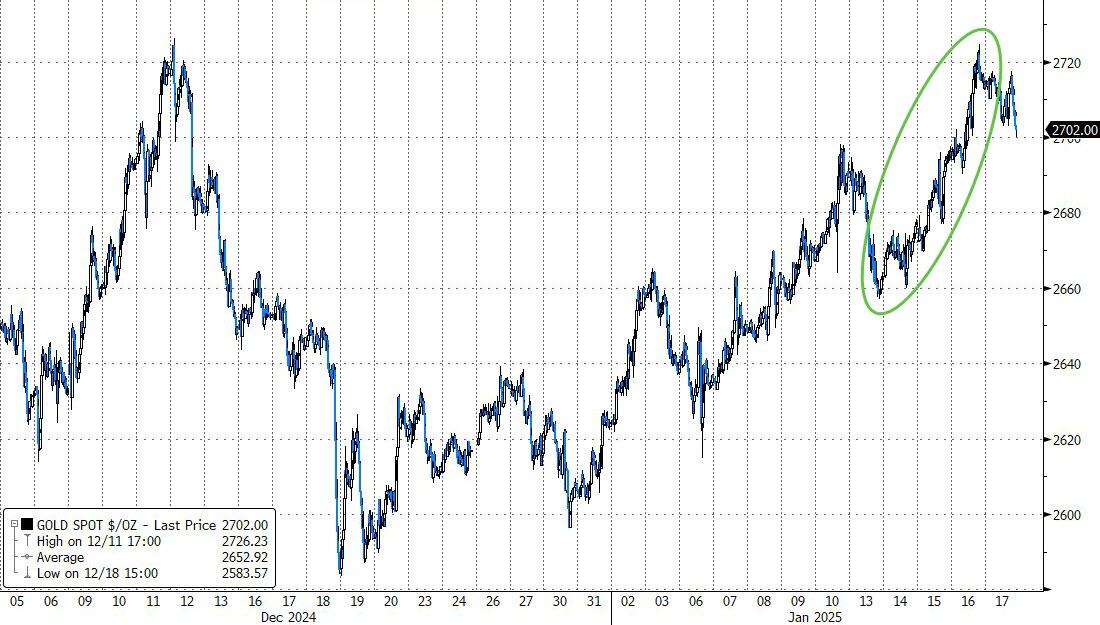
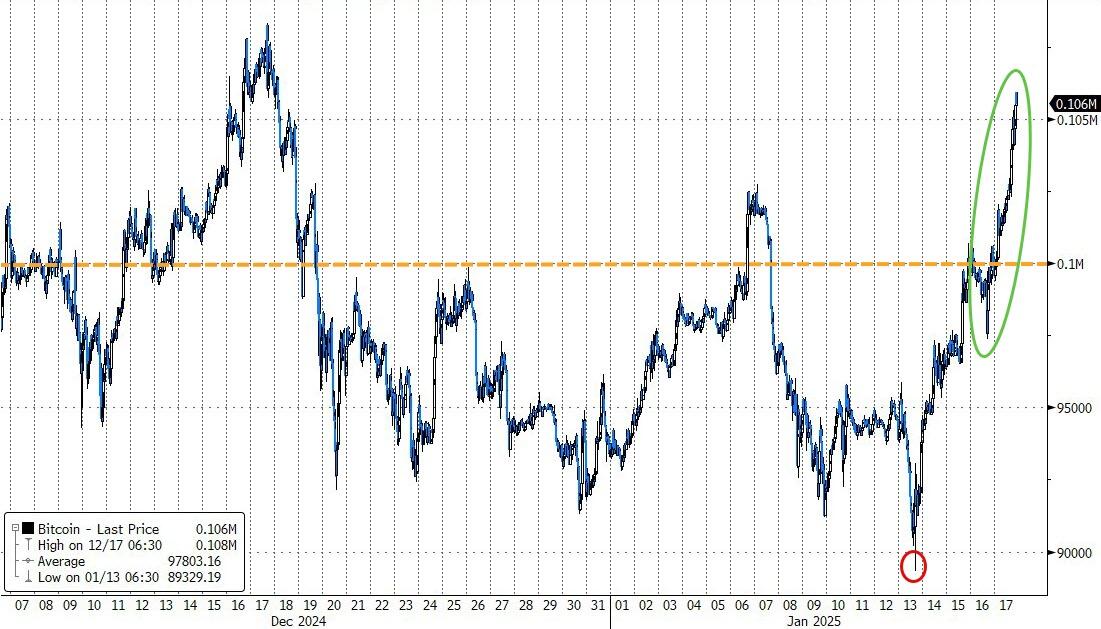
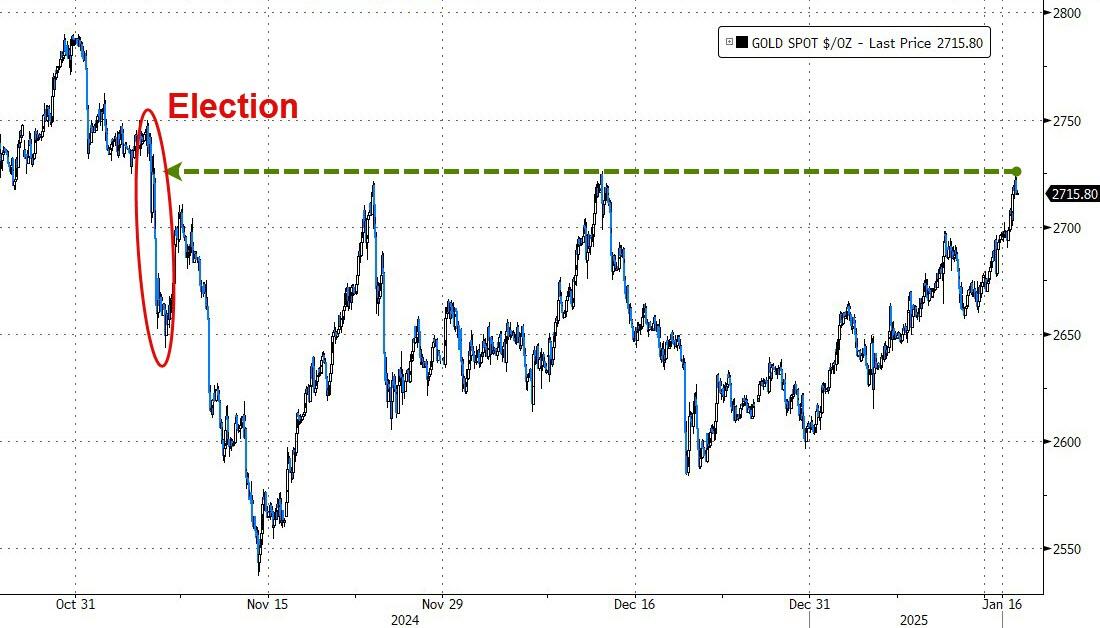
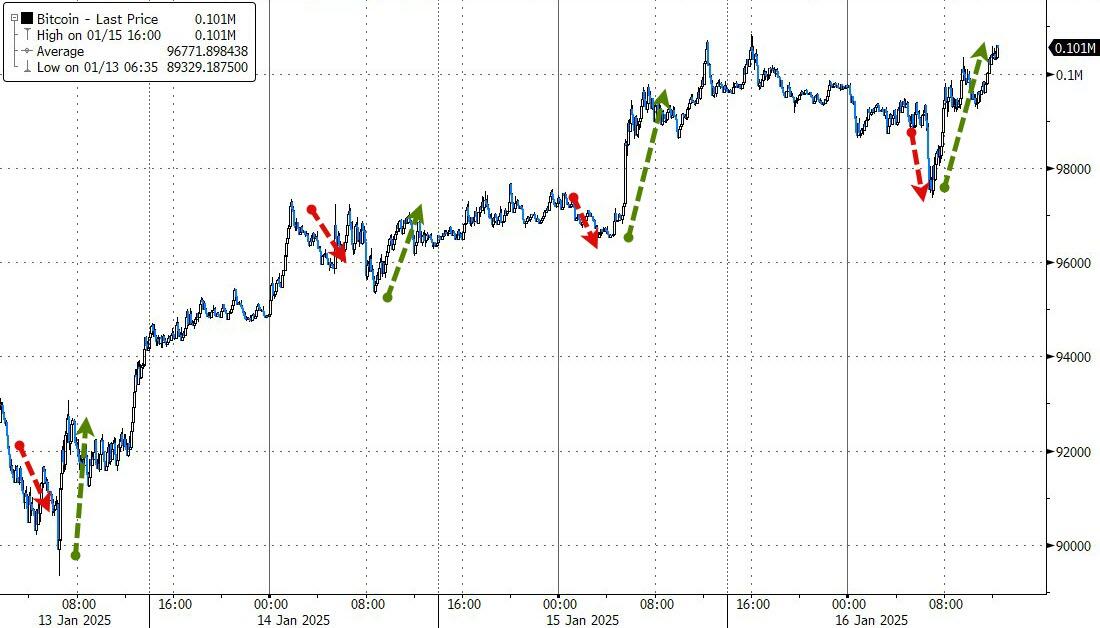
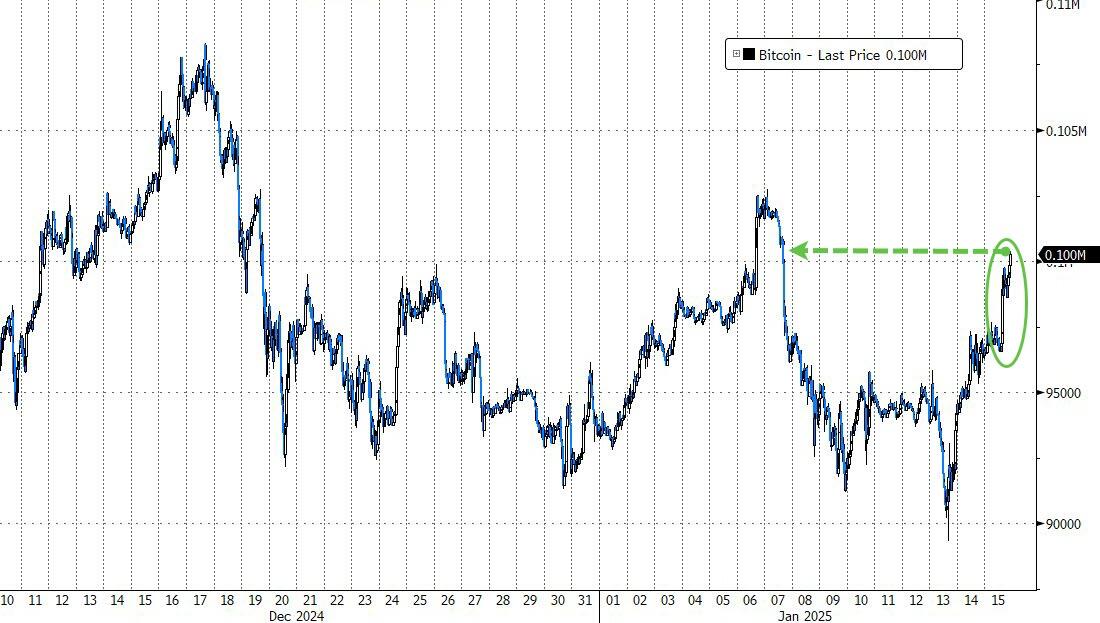
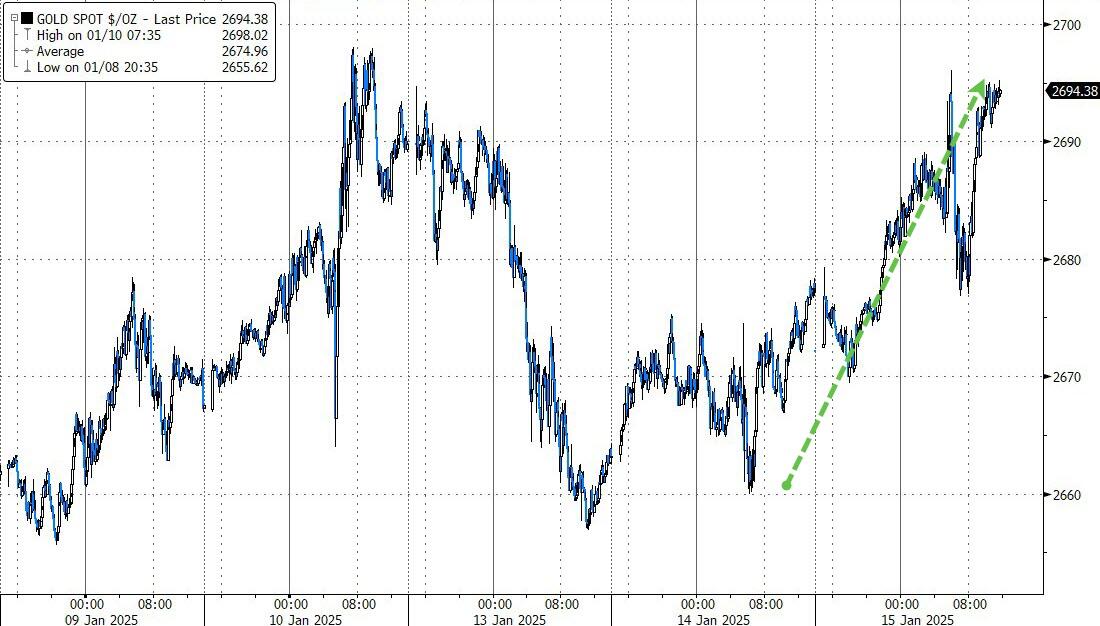
Gold rallied, reclaiming the $2,750 level, and erasing all post-election losses. Bitcoin, after bouncing off the $100k level, surged back above $107k, just shy of its record high of $109k.

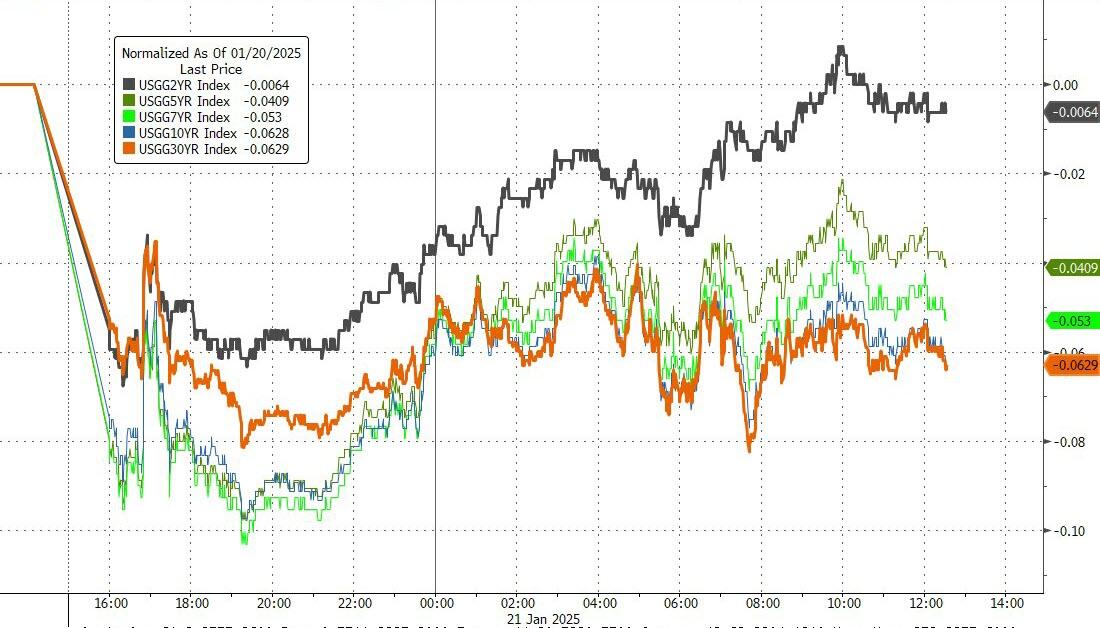
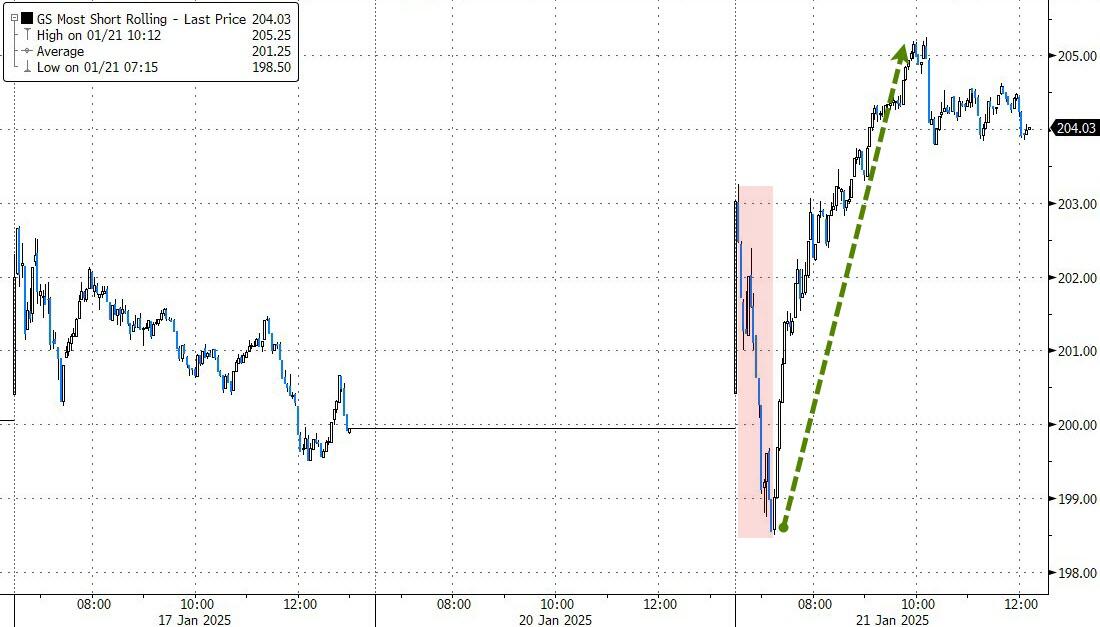
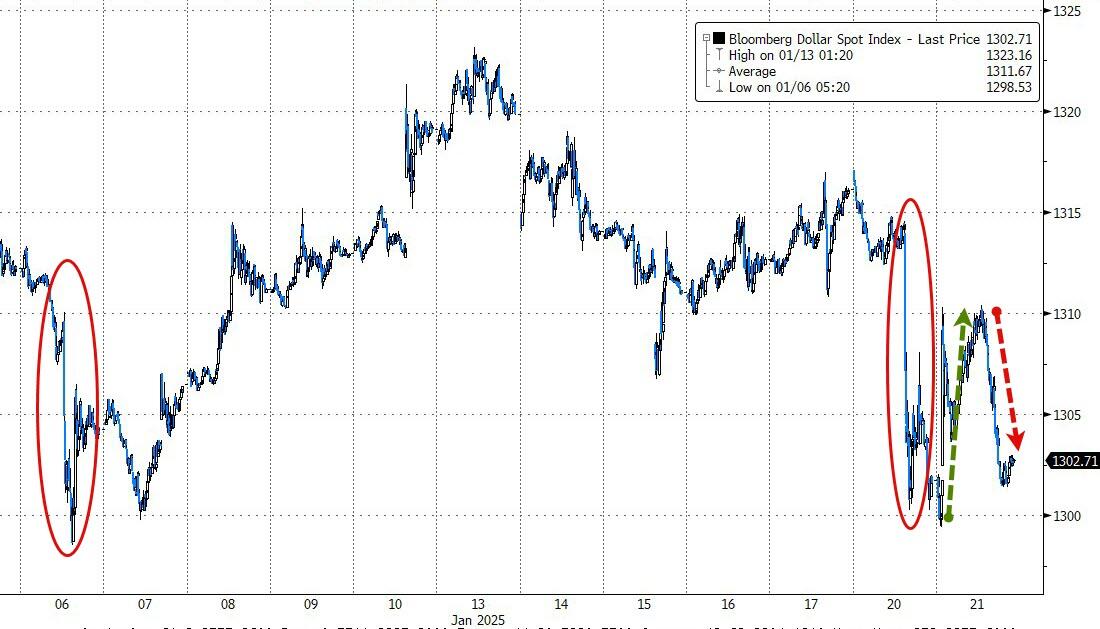
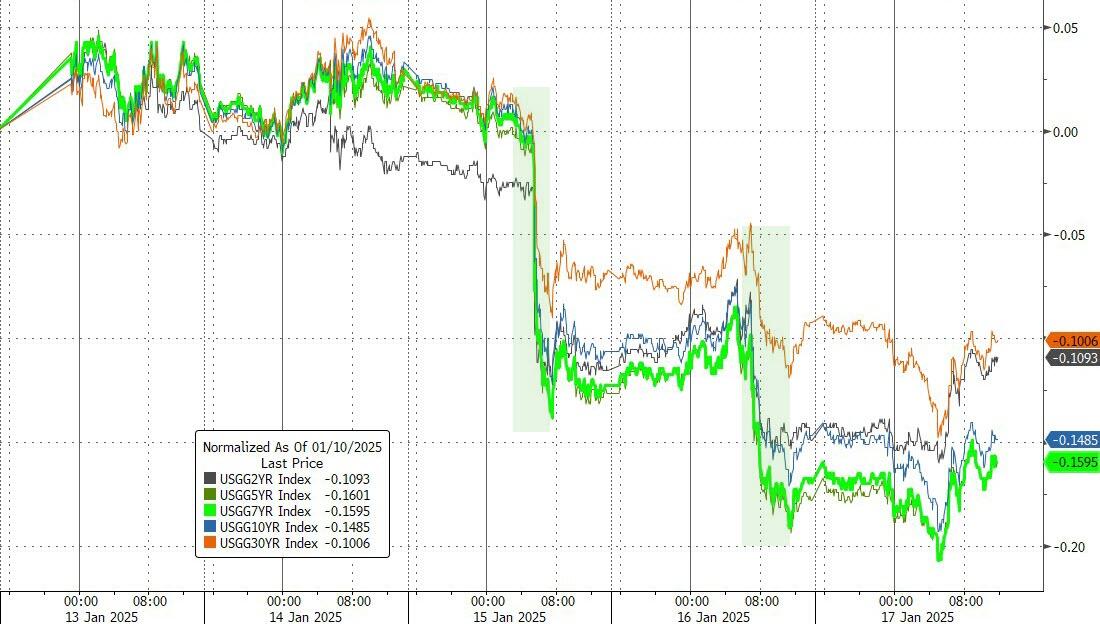
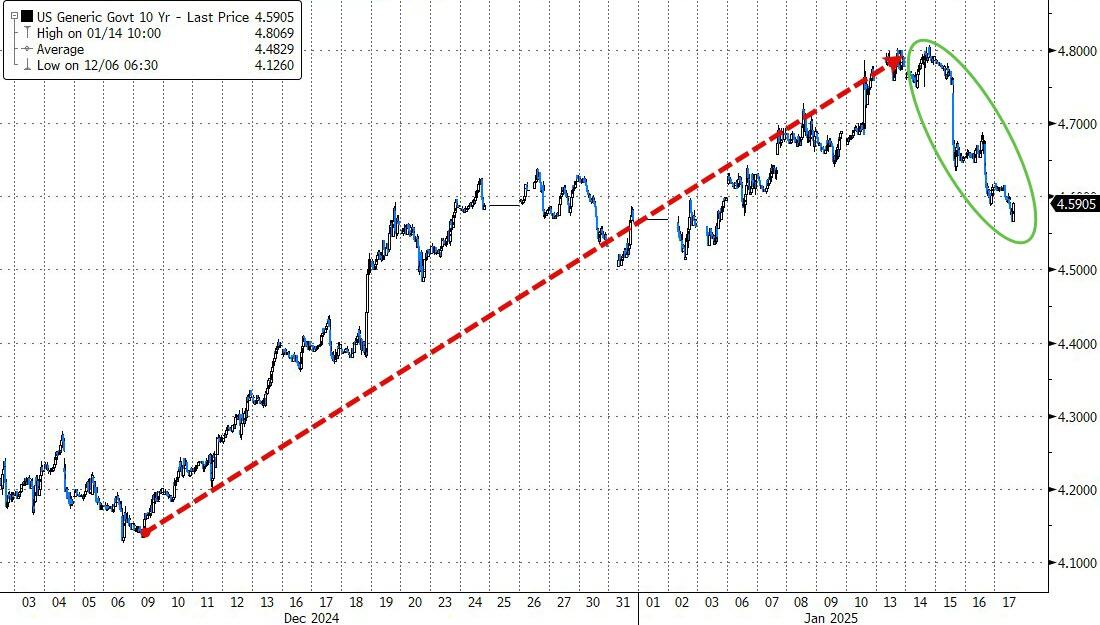
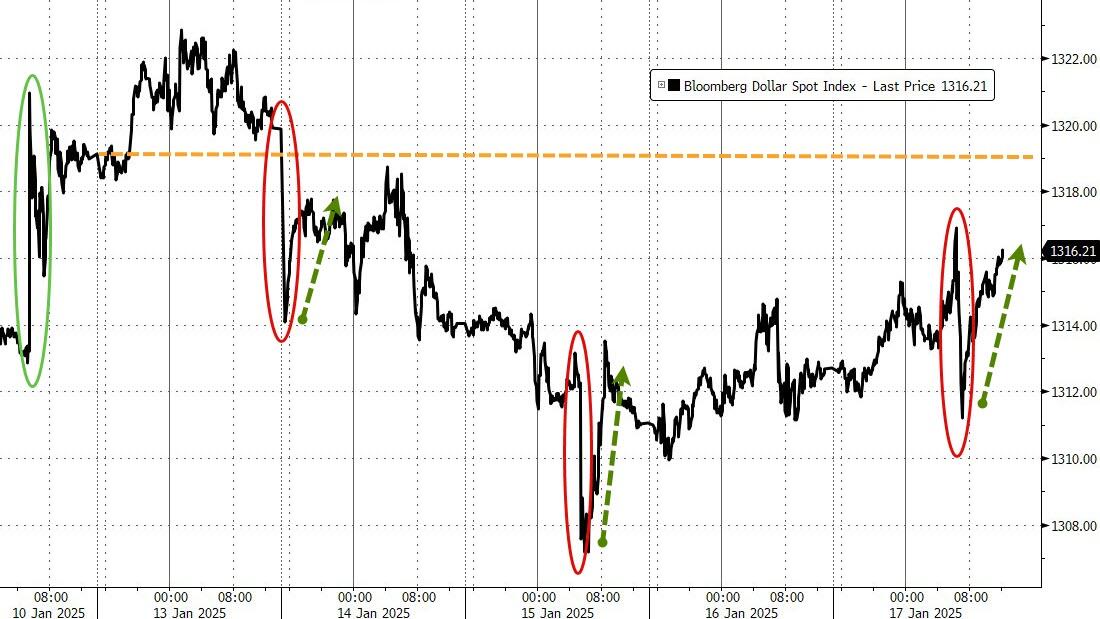
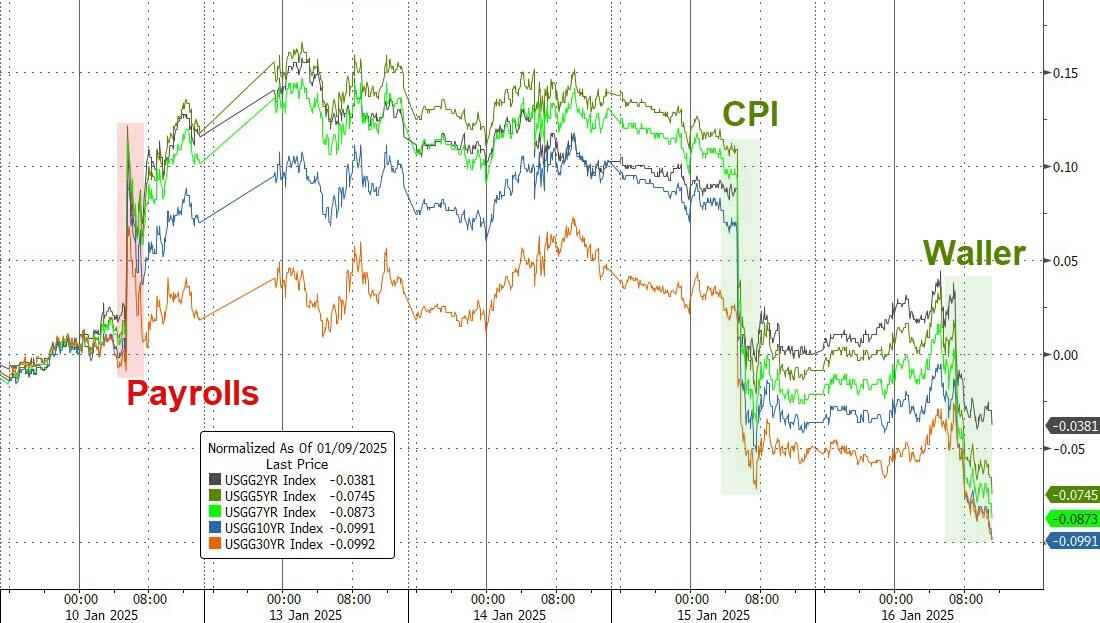
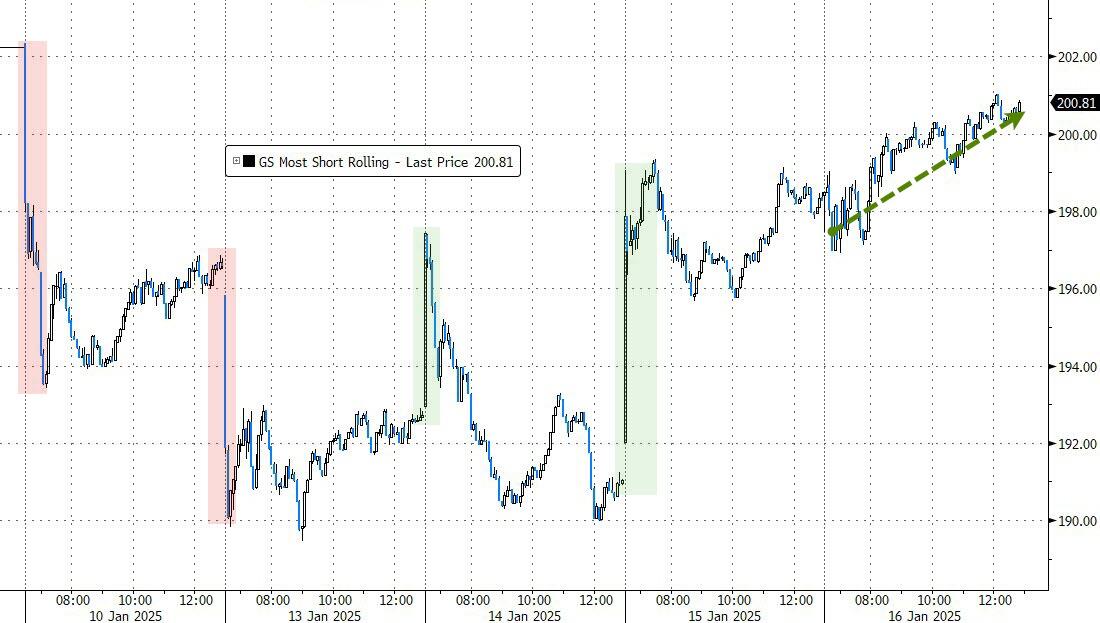
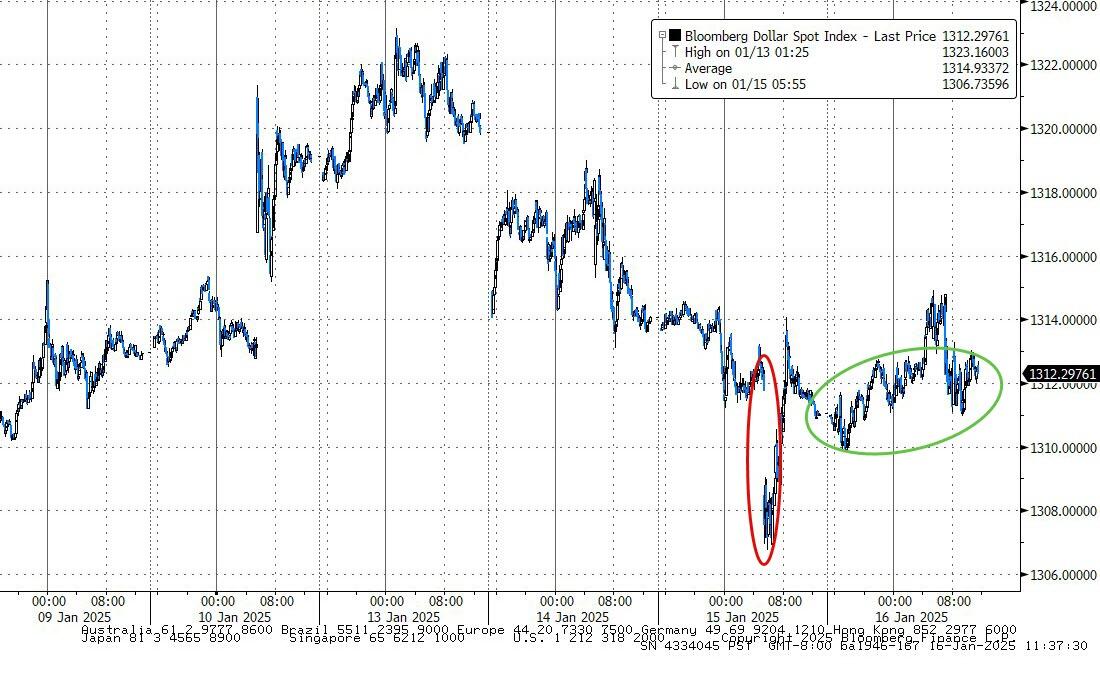
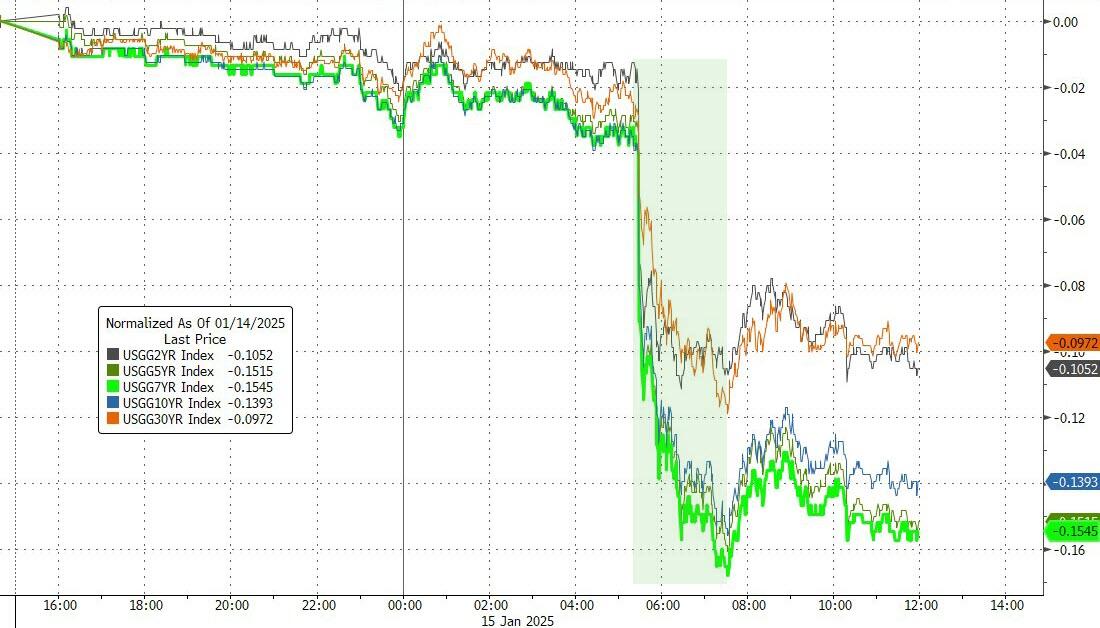
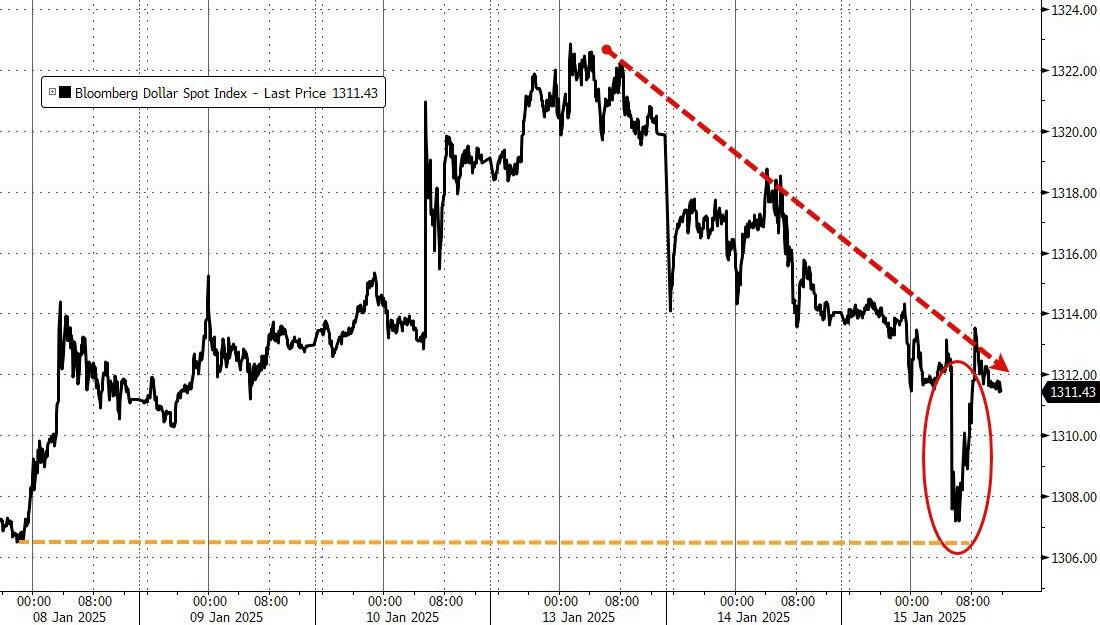
Falling bond yields and a short squeeze provided the necessary momentum for today’s market rise, while the dollar initially bounced but faded by the close.

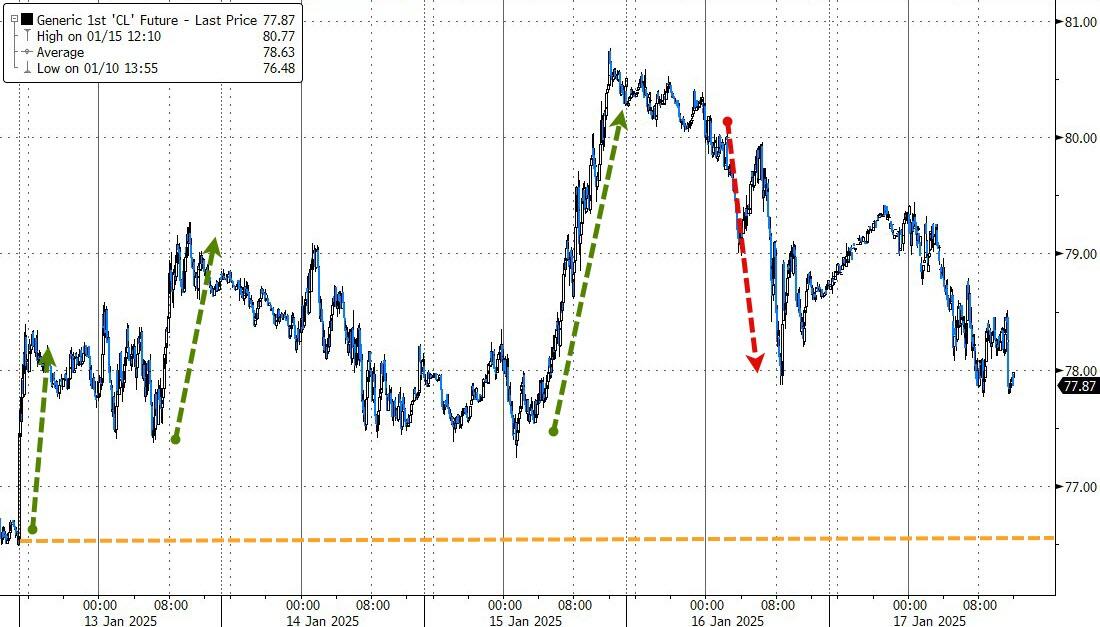
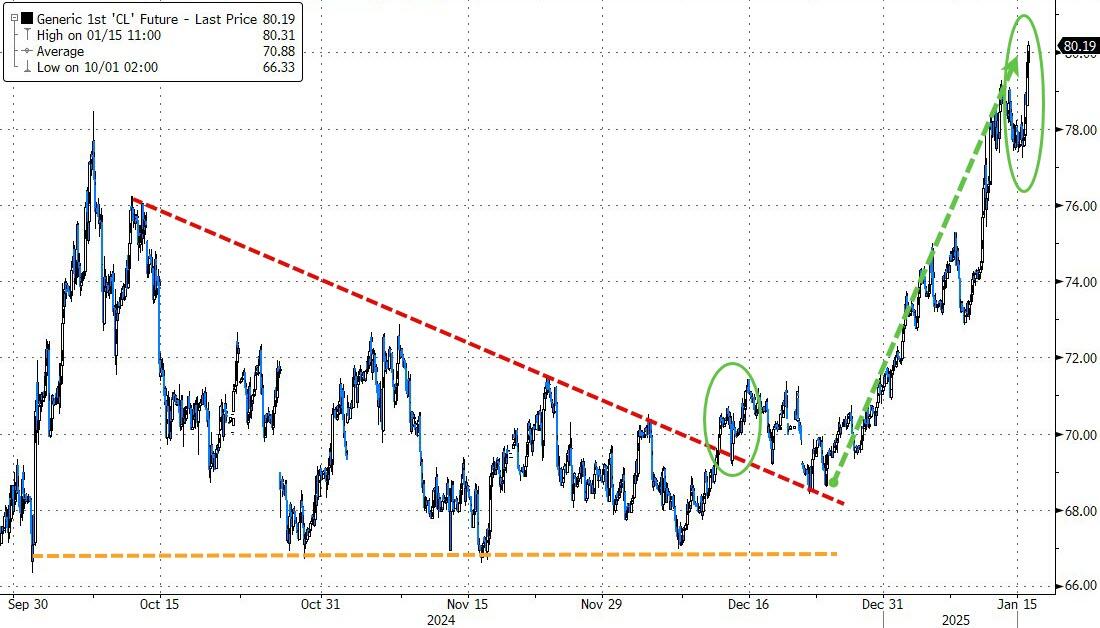
I couldn’t help but chuckle as oil prices declined throughout the session, with Trump’s famous adage “drill, baby, drill” dampening any bullish sentiment.

Read More

ETFs On The Cutline – Updated Through 01/17/2025

Ulli ETFs on the Cutline Contact

Do you want to know which ETFs are hot and which ones are not? Then you need my High-Volume ETF Cutline report. It tells you how close or far each of the 311 ETFs I follow is from its long-term trend line (39-week SMA). These are the ETFs that trade more than $5 million a day, so they are not some obscure funds that nobody cares about.

The report is split into two parts: The winners that are above their trend line (%M/A), and the losers that are below it. The yellow line is the line of shame that separates them. You can see how many ETFs are in each group and how they have changed since the last report (111 vs. 163 current).

Take a peek:

The HV ETF Master Cutline Report

If you are confused by some of the terms we use, don’t panic. I have a helpful Glossary of Terms for you.

If you want to learn more about the Cutline method and how it can make you rich (or at least less poor), read my original post here.

ETF Tracker Newsletter For January 17, 2025

Ulli ETF Tracker Contact

ETF Tracker StatSheet          

You can view the latest version here.

MARKETS SURGE AS MAJOR INDEXES ACHIEVE FIRST WEEKLY GAIN OF 2025

[Chart courtesy of MarketWatch.com]

  1. Moving the market

Today, the major indexes surged, marking not only their first weekly gain of 2025 but also their largest weekly advance since the November elections.

This broad-based rally saw participation from chipmakers, mega-tech, and small-cap stocks, with the widely followed S&P 500 gaining 1% for the day and 2.9% for the week.

Traders remain buoyant following consecutive reports indicating that the core CPI rose less than expected over the year, while the PPI also showed a smaller-than-expected increase for December. Consequently, the 10-year yield retreated sharply, contributing to this week’s rally.

Strong earnings from major banks further lifted equities, with some traders now referring to the current environment as a “goldilocks” scenario, which supposedly encourages more risk-taking in equities.

Adding to the positive sentiment is the anticipation of Trump’s inauguration as president on Monday, with traders betting on deregulation and lower taxes—two key promises from his campaign.

Dovish comments from Fed governors Waller and Goolsbee fueled rate-cut hopes, reversing the recent hawkish trend.

Bond yields tumbled sharply mid-week, with the 10-year yield dropping from 4.8% to close at 4.62%. The dollar slipped, gold rallied for the third consecutive week towards record highs, and Bitcoin surged towards its all-time high, with the ARKB ETF, which we own, gaining a solid 10.6% over the past week.

Oil prices fell below $78 after the Israel-Hamas deal eased some geopolitical tensions.

As Trump’s inauguration approaches, ZH pondered this question: Will the ‘Day One’ executive orders confirm the hope priced into the markets?

Read More

Weekly StatSheet For The ETF Tracker Newsletter – Updated Through 01/16/2025

Ulli ETF StatSheet Contact

ETF Data updated through Thursday, January 16, 2025

How to use this StatSheet:

  1. Out of the 1,800+ ETFs out there, I only pick the ones that trade over $5 million per day (HV ETFs), so you don’t get stuck with a lemon that nobody wants to buy or sell.
  1. Trend Tracking Indexes (TTIs)

These are the main indicators that tell you when to buy or sell Domestic and International ETFs (section 1 and 2). They do that by comparing their position to their long-term M/A (Moving Average). If they cross above, and stay there, it’s a green light to buy. If they fall below, and keep going, it’s a red light to sell. And to make sure you don’t lose your shirt if things go south, I also use a 12% trailing stop loss on all positions in these categories.

  1. All other investment areas don’t have a TTI and should be traded based on the position of each ETF relative to its own trend line (%M/A). That’s why I call them “Selective Buy.” In other words, if an ETF goes above its own trend line, you can buy it. But don’t forget to use a trailing sell stop of 12%, or less if you’re feeling nervous.

If some of these words sound like Greek to you, please check out the Glossary of Terms and new subscriber information in section 9.

  1. DOMESTIC EQUITY ETFs: BUY— since 11/21/2023

Click on chart to enlarge

This is our main compass, the Domestic Trend Tracking Index (TTI-green line in the above chart). It has broken above its long-term trend line (red) by +4.36% and is in “Buy” mode as posted.

Read More

Gold Surges To Election Highs As Bitcoin Rebounds

Ulli Market Commentary Contact

[Chart courtesy of MarketWatch.com]

  1. Moving the market

Equities saw a bounce but ultimately pulled back during the session following yesterday’s strong advances, as traders analyzed the latest earnings reports.

Banks such as Bank of America and Morgan Stanley saw gains after surpassing expectations, like their peers JP Morgan and Goldman Sachs from the previous day. This earnings season is off to a promising start, with 77% of reporting companies exceeding their outlooks.

Traders are still energized from yesterday’s strongest session since November, where all major indexes posted solid gains, driven by a moderate improvement in core inflation. Let’s hope these figures are accurate and not subject to revision.

Federal Reserve Governor Waller provided some reassurance, suggesting that if incoming inflation data continues this path or improves, rate cuts could happen sooner than the market anticipates.

On the economic front, retail sales disappointed, jobless claims soared to three-year highs, but the Philly Fed Manufacturing Index surged in January, marking the biggest month-over-month jump since COVID-19 and the second-highest level in 40 years, according to ZH.

Bond yields slipped again, but the dovish sentiment in rates wasn’t enough to push the major indexes into the green, despite another short squeeze lifting Small Caps.

The dollar traded sideways, while gold surged higher, closing above $2,700—its highest level since the election. Bitcoin, after dropping below $90 a few days ago, reversed course and surged back above $101,000 today.

After this recent rollercoaster ride, is Bitcoin now on its way to a new all-time high?

Read More

Indexes Rally Broadly On Softer CPI And Impressive Bank Earnings

Ulli Market Commentary Contact

[Chart courtesy of MarketWatch.com]

  1. Moving the market

This morning, the markets received a significant boost, with all indexes advancing broadly as inflation fears seemed to dissipate. The latest Consumer Price Index (CPI) report revealed that core inflation unexpectedly slowed in December. Major banks also kicked off the earnings season with impressive results, further fueled by a massive short squeeze.

December’s CPI showed that core inflation, which excludes food and energy, rose by 3.2%. This was slightly lower than the previous month and below the estimated 3.3%. However, the month-over-month headline inflation number came in just above the 0.3% forecast.

Traders were relieved by yesterday’s Producer Price Index (PPI) report and today’s CPI report, concluding that any additional rate hikes by the Federal Reserve are now off the table, a sentiment that some market participants had already priced in.

Bond yields retreated sharply, with the 10-year yield, which had been on a relentless upward trend since the Fed lowered rates, reversing course and dropping 14 basis points to close the session at 4.66%.

The fourth-quarter earnings season began with major banks like JP Morgan, Goldman Sachs, Wells Fargo, and Citibank all beating expectations. Bank earnings are crucial as the financial sector is closely tied to the general economy.

The mega-cap sector surged, recouping Friday’s losses, with the Nasdaq experiencing its best day since early November. The dollar closed lower after fluctuating wildly throughout the day.

Meanwhile, Bitcoin surged back above $100,000, and gold rallied to Monday’s highs, joined by crude oil, which broke above $80 for the first time since August.

Despite these positive developments, inflation remains a concern, raising the question in my mind: Does this exuberant rebound have any legs to stand on?

Read More