Weekly StatSheet For The ETF Tracker Newsletter – Updated Through 09/07/2017

Ulli ETF StatSheet Contact

ETF Data updated through Thursday, September 7, 2017

Methodology/Use of this StatSheet:

  1. From the universe of over 1,800 ETFs, I have selected only those with a trading volume of over $5 million per day (HV ETFs), so that liquidity and a small bid/ask spread are assured.
  2. Trend Tracking Indexes (TTIs)

Buy or Sell decisions for Domestic and International ETFs (section 1 and 2), are made based on the respective TTI and its position either above or below its long-term M/A (Moving Average). A crossing of the trend line from below accompanied by some staying power above constitutes a “Buy” signal. Conversely, a clear break below the line constitutes a “Sell” signal. Additionally, I use a 7.5% trailing stop loss on all positions in these categories to control downside risk.

  1. All other investment arenas do not have a TTI and should be traded based on the position of the individual ETF relative to its own respective trend line (%M/A). That’s why those signals are referred to as a “Selective Buy.” In other words, if an ETF crosses its own trendline to the upside, a “Buy” signal is generated. Since these areas tend to be more volatile, I recommend a wider trailing sell stop of 7.5% -10% depending on your risk tolerance.

If you are unfamiliar with some of the terminology, please see Glossary of Terms and new subscriber information in section 9.


  1. DOMESTIC EQUITY ETFs: BUY — since 4/4/2016
Click on chart to enlarge

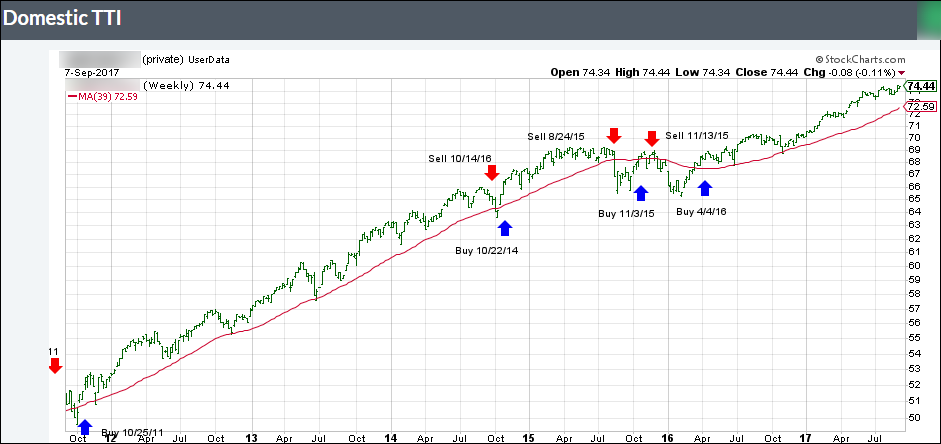
Our main directional indicator, the Domestic Trend Tracking Index (TTI-green line in the above chart) is positioned above its long-term trend line (red) by +2.70% after having generated a new Domestic Buy signal effective 4/4/2016 as posted.
Read More

Financials Tumble; Major Indexes End Mixed; Dollar Plunges

Ulli Market Commentary Contact

[Chart courtesy of MarketWatch.com]
  1. Moving the Markets

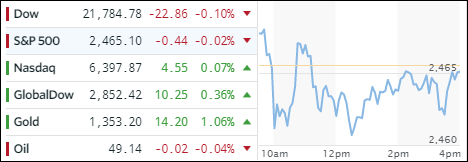
A host of events joined forces to keep equities in a state of uncertainty. It started with an ugly jobs data report showing that jobless claims spiked the most in 12 years, in part due to hurricane Harvey’s economic effects many of which are still unknown. Not helping matters was the announcement that Q2 saw labor costs decline -0.2% YoY, meaning they have been unchanged since 2015 and income gains are simply an illusion.

Financials (XLF) got hit hard today and lost -1.73% with the Regional Banking ETF (KBWR) dropping -2.62%. On the equity side, we saw the International SmallCaps (SCHC) take top billing with +1.08% followed by the Internationals (SCHF) with +0.80%. Ending the day in the red were domestic SmallCaps (SCHA) with a modest -0.28% loss.

With all of the official rhetoric spewed in MSM as to how great the economy is doing, I have to ask: If that is so, why are interest rates collapsing? They should be rising instead. The 10-year Bond yield slipped again by 5 basis points to end the day at 2.05%; which is the lowest level of the year. It looks as though the 2% level may be taken out in the near future to bring us back to where we were at election time. In other words, the Trump pump effect on interest rates has been wiped out. Will equities follow?

The US Dollar (UUP) plunged by -1.33% and has not only been making a new low for the year but also reached a point last seen in December 2014. It has clearly broken its 200-day M/A to the downside and is stuck in bear market territory. On the plus side, gold is heading solidly north and has conquered its $1,350 marker for the first time since July 2016.

Read More

Energy Rebound Assists Equities

Ulli Market Commentary Contact

[Chart courtesy of MarketWatch.com]
  1. Moving the Markets

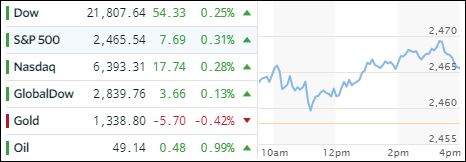
The markets were in rally mode, albeit modest, right after the opening bell and never looked back with the S&P 500 gaining +0.31%. Contributing to today’s bullish mood was some de-escalation with N. Korea, as Trump announced that “war was not first priority,” before agreeing to a 3-month debt-ceiling-can-kicking extension deal ending on December 15.

With more hurricanes on the horizon, energy recovered with crude oil gaining +0.99% and XLE scoring a solid +1.63%. Equity ETFs behaved nicely and closed higher with the leaders being the International arena (SCHF) with +0.62% and International SmallCaps (SCHC) with +0.57%. The losers of the day turned out to be Aerospace & Defense (ITA) with -0.73%, which was obviously due to reduced verbal saber rattling, joined by Gold with -0.42%.

Interest rates reversed from yesterday with the 20-year bond giving back -0.61%. The US Dollar (UUP) dipped lower but managed to rebound to almost wipe out all losses by closing down only a meager -0.08%.

Read More

Equities Skid As Uncertainty Reigns

Ulli Market Commentary Contact

[Chart courtesy of MarketWatch.com]
  1. Moving the Markets

In addition to the usual menu of concerns, there were a few new ones that helped the markets end their multi-day winning streak. Besides the lack of progress with the Trump pro-growth agenda and continued saber rattling with N. Korea, another monster hurricane named Irma is threatening the coast of Florida prompting the state to prepare for the “catastrophic” system.

In the meantime, on the economic side, July factory orders plunged to their weakest since February with final data confirming a 3.3 MoM tumble; durable goods got spanked at a rate of -6.8%. Ouch!

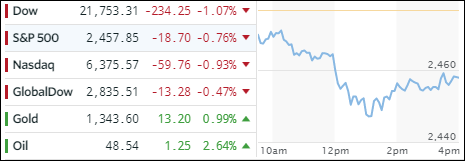
As a result, the major indexes headed south with the S&P 500 faring the best by surrendering only -0.76%. Across the ETF spectrum, Semiconductors (SMH) gave back -1.27% closely followed by Transportations (IYT) with -0.97%. The Dividend ETF (SCHD) held up the best with -0.44%.

Profiting from all this carnage were Gold and Bonds. As is well-known, gold can be an insurance play, and it certainly acted that way today with a gain of +0.99% and a sprint towards the $1,350 marker, a level last seen in September 2016. In regards to interest rates, yields got clobbered with the 10-year losing 6 basis points to end the day at 2.10%.

That benefited the 20-year bond (TLT), which rallied a solid +1.54% and continued its northerly path from August.

The US Dollar (UUP) retraced some of its recent gains, AKA a dead cat bounce, and dropped -0.54%.

Read More

One Man’s Opinion: Weird Things Are Happening With Gold

Ulli Market Review Contact

By James Rickards

Last week featured two unusual stories on gold – one strange and the other truly weird. These stories explain why gold is not just money but is the most politicized form of money.

They show that while politicians publicly disparage gold, they quietly pay close attention to it.

The first strange gold story involves Germany…

The Deutsche Bundesbank, the central bank of Germany, announced that it had completed the repatriation of gold to Frankfurt from foreign vaults.

The German story is the completion of a process that began in 2013. That’s when the Deutsche Bundesbank first requested a return of some of the German gold from vaults in Paris, in London and at the Federal Reserve Bank of New York.

Those gold transfers have now been completed.

Read More

ETFs On The Cutline – Updated Through 09/01/2017

Ulli ETFs on the Cutline Contact

Below please find the latest High Volume ETFs Cutline report, which shows how far above or below their respective long-term trend lines (39 week SMA) my currently tracked ETFs are positioned.

This report covers the HV ETF Master List from Thursday’s StatSheet and includes 366 High Volume ETFs ETFs, defined as those with an average daily volume of more than $5 million, of which currently 284 (last week 265) are hovering in bullish territory. The yellow line separates those ETFs that are positioned above their trend line (%M/A) from those that have dropped below it.

Take a look:

The HV ETF Master Cutline Report            

In case you are not familiar with some of the terminology used in the reports, please read the Glossary of Terms.

If you missed the original post about the Cutline approach, you can read it here.