Rebounding Into The Fed Meeting

Ulli Market Commentary Contact

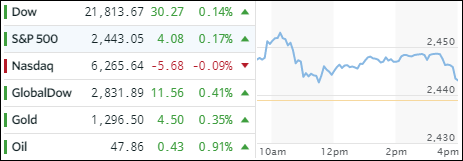
[Chart courtesy of MarketWatch.com]
  1. Moving the Markets

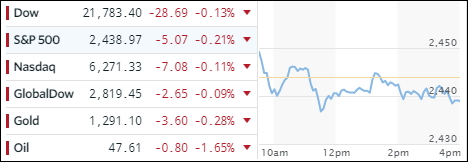
The pullback of the last 2 days ended, at least for the time being, with the Nasdaq and S&P 500 moving into record territory, while the Dow touched an all-time high on an intra-day basis as the Fed started its two-day meeting on interest rates. Even the Russell 2000 hit a record high at a moment in time when its 2017 EPS expectations hit 2017 lows. Makes perfect sense to me…

The result of the FOMC conference will be announced tomorrow with market observers holding a nearly unanimous view that interest rates will be hiked by +0.25%. That means traders are comfortable and are assuming that the Fed will balance things in a way so that a tighter monetary policy does not have a negative effect on growth. Hmm, given that economic data points have collapsed that will be quite a magic act for the Fed to perform.

Interest rates vacillated but ended the day unchanged with the 10-year T-Bond maintaining its 2.21% yield. The US dollar slipped for the second day in a row with UUP closing down -0.12%.

Read More

Nasdaq Gets Bruised Again

Ulli Market Commentary Contact

[Chart courtesy of MarketWatch.com]
  1. Moving the Markets

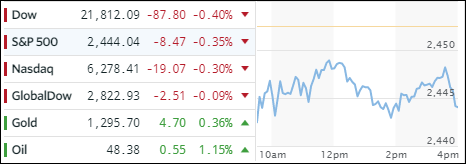
The trading day started out on a sour note with the major indexes heading south as tech weakness dragged all sectors down for the second day in a row. Things stabilized mid-day, after which we headed south again, but the usual last hour ramp kept losses to a minimum for the Dow and S&P, but the Nasdaq gave back another -0.52% with Apple dropping another -2.39% on top of Friday’s -3.9% loss.

Causing these issues were the FAANG stocks (Facebook, Apple, Amazon, Netflix, Google), which showed downright meteoric rises since the election to reach extreme valuation levels. In fact, these 5 stocks were responsible for generating 40% of the S&P 500’s gains this year, an astonishing number that clearly demonstrates the lack of breadth accompanying this recent rally. In other words, a correction was long overdue.

In regards to interest rates, the widely followed 10-year T-bond ended the day unchanged yielding 2.21%. The US dollar, as represented by UUP, dropped by a slight -0.16% reversing a 3-day rebound. Precious metals were mixed with gold slipping -0.20% while silver fared worse by surrendering -1.47%.

Read More

One Man’s Opinion: “This Insanity Is The Surest Sign The Stock Market Bubble Is Ready To Pop”

Ulli Market Review Contact

by Michael Snyder

If everything is going to be “just fine”, why are so many big names in the financial community warning about an imminent meltdown?  I don’t think that I have seen so many simultaneous warnings about a market crash since just before the great financial crisis of 2008.  And at this point, you would have to be quite blind not to see that stocks are absurdly overvalued and that a correction is going to happen at some point.  And when stocks do start crashing, lots of fingers are going to start pointing at President Trump, but it won’t be his fault.  The Federal Reserve and other central banks are primarily responsible for creating this bubble, and they should definitely get the blame for what is about to happen to global financial markets.

Regular readers are quite familiar with my thoughts on where the market is headed, so today let me share some thoughts from five respected financial experts…

#1 When Altair Asset Management’s chief investment officer Philip Parker was asked if a market crash was coming to Australia, he said that he has “never been more certain of anything in my life”.  In fact, he is so sure that the investments that his hedge fund is managing are going to crash that a decision was made to liquidate the fund “and return ‘hundreds of millions’ of dollars to its clients”

Read More

ETFs On The Cutline – Updated Through 06/09/2017

Ulli ETFs on the Cutline Contact

Below please find the latest High Volume ETFs Cutline report, which shows how far above or below their respective long-term trend lines (39 week SMA) my currently tracked ETFs are positioned.

This report covers the HV ETF Master List from Thursday’s StatSheet and includes 366 High Volume ETFs ETFs, defined as those with an average daily volume of more than $5 million, of which currently 282 (last week 284) are hovering in bullish territory. The yellow line separates those ETFs that are positioned above their trend line (%M/A) from those that have dropped below it.

Take a look:

The HV ETF Master Cutline Report            

In case you are not familiar with some of the terminology used in the reports, please read the Glossary of Terms.

If you missed the original post about the Cutline approach, you can read it here.
ETF Tracker Newsletter For June 9, 2017

Ulli ETF Tracker Contact

ETF Tracker StatSheet

https://theetfbully.com/2017/06/weekly-statsheet-etf-tracker-newsletter-updated-06082017/

Tech Gets Slammed; Dow Closes In The Green

[Chart courtesy of MarketWatch.com]
  1. Moving the Markets

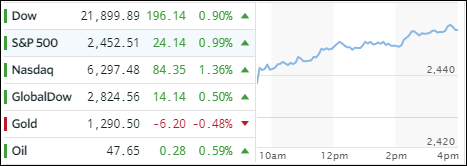
Something changed in the markets today. All was well until late morning, with SmallCaps continuing their explosion, when suddenly momentum changed and south we went. The Nasdaq took the worst beating losing almost 2% with the Apple being spanked at the tune of -3.9%, its biggest one-day percentage loss since April 2016. To no surprise, the semiconductor ETF SMH, one of our holdings, followed suit by giving back -3.78%, which was to be expected given that SMH had been up over 24% YTD.

It all had to do with the VIX (Volatility Index) making a 24-year low at 9.37 before suddenly not just spiking above 12 but also above its 50/100 DMAs thereby taking the starch out of any upward momentum in the equity universe. The FANG stocks took a dive as well with Amazon (-3.16%) losing $175 billion in market cap in about 5 seconds. Ouch!

Financial and energy shares were the winners of the day with XLF and XLE gaining +1.89% and +2.47% respectively. With energy having been pounded into submission since its highs made early December, a dead cat bounce was way overdue.

Interest rates rose for the 3rd day in a row with the 1-year T-bond settling at a yield of 2.21%. The dollar followed suit with UUP showing 3-day gains as well. In the end, trading was very erratic today, and it remains to be seen if this was just an outlier or a sign of things to come.

Read More

Weekly StatSheet For The ETF Tracker Newsletter – Updated Through 06/08/2017

Ulli ETF StatSheet Contact

ETF Data updated through Thursday, June 8, 2017

Methodology/Use of this StatSheet:

  1. From the universe of over 1,800 ETFs, I have selected only those with a trading volume of over $5 million per day (HV ETFs), so that liquidity and a small bid/ask spread are assured.
  2. Trend Tracking Indexes (TTIs)

Buy or Sell decisions for Domestic and International ETFs (section 1 and 2), are made based on the respective TTI and its position either above or below its long-term M/A (Moving Average). A crossing of the trend line from below accompanied by some staying power above constitutes a “Buy” signal. Conversely, a clear break below the line constitutes a “Sell” signal. Additionally, I use a 7.5% trailing stop loss on all positions in these categories to control downside risk.

  1. All other investment arenas do not have a TTI and should be traded based on the position of the individual ETF relative to its own respective trend line (%M/A). That’s why those signals are referred to as a “Selective Buy.” In other words, if an ETF crosses its own trendline to the upside, a “Buy” signal is generated. Since these areas tend to be more volatile, I recommend a wider trailing sell stop of 7.5% -10% depending on your risk tolerance.

If you are unfamiliar with some of the terminology, please see Glossary of Terms and new subscriber information in section 9.


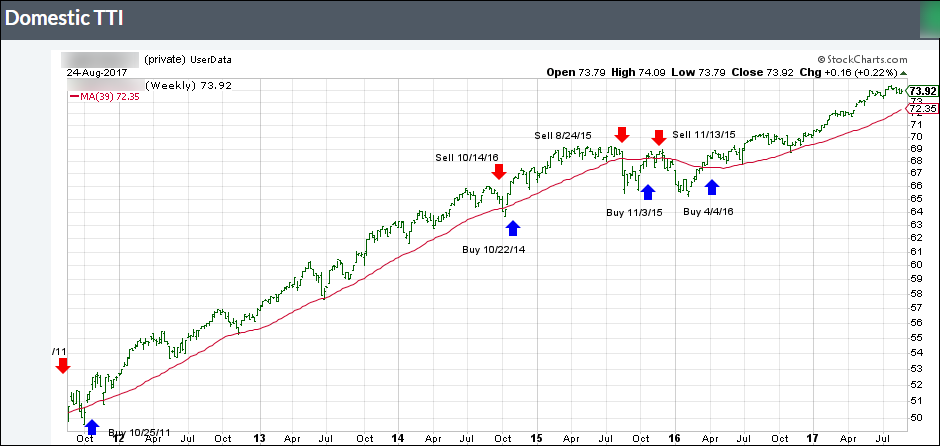
  1. DOMESTIC EQUITY ETFs: BUY — since 4/4/2016

Click on chart to enlarge

Our main directional indicator, the Domestic Trend Tracking Index (TTI-green line in the above chart) is positioned above its long-term trend line (red) by +4.10% after having generated a new Domestic Buy signal effective 4/4/2016 as posted.

Read More