One Man’s Opinion: Banks are becoming less safe. Again.

Ulli Market Review Contact

By Simon Black

What I’m about to tell you isn’t some wild conspiracy. Or fake news.

It’s raw fact, based on publicly available data from the US Federal Reserve.

This data shows a very simple but concerning trend: banks in the United States are becoming less safe. Again.

And they’re doing it on purpose. Again.

Few people ever give much thought to the safety and security of their bank.

After all, banks go out of their way to instill an overwhelming sense of confidence that they’re rock solid.

They spend tons of money on ornate lobbies in giant buildings. They buy the naming rights to football and baseball stadiums.

And hey, they’re insured by the government.

But it turns out that none of these elaborate distractions means anything when it comes to bank safety.

Safety is actually pretty easy to calculate.

Read More

ETFs On The Cutline – Updated Through 06/09/2017

Ulli ETFs on the Cutline Contact

Below please find the latest High Volume ETFs Cutline report, which shows how far above or below their respective long-term trend lines (39 week SMA) my currently tracked ETFs are positioned.

This report covers the HV ETF Master List from Thursday’s StatSheet and includes 366 High Volume ETFs ETFs, defined as those with an average daily volume of more than $5 million, of which currently 277 (last week 282) are hovering in bullish territory. The yellow line separates those ETFs that are positioned above their trend line (%M/A) from those that have dropped below it.

Take a look:

The HV ETF Master Cutline Report            

In case you are not familiar with some of the terminology used in the reports, please read the Glossary of Terms.

If you missed the original post about the Cutline approach, you can read it here.

ETF Tracker Newsletter For June 16, 2017

Ulli ETF Tracker Contact

ETF Tracker StatSheet

https://theetfbully.com/2017/06/weekly-statsheet-etf-tracker-newsletter-updated-06152017/

AMAZON SLAMS STOCKS BUT MAJOR INDEXES RECOVER

[Chart courtesy of MarketWatch.com]
  1. Moving the Markets

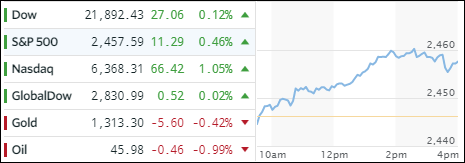
Several events kept the indexes in roller coaster mode. For one, it was quadruple options expiration day, which always tends to add volatility to an otherwise complacent market. That fact got shoved into the background as Amazon announced its acquisition of Whole Foods, which collapsed shares of many grocers not just in the U.S. but also around the world.

Heavyweights like Kroger, Target, Walmart and Costco got slammed with their share prices losing anywhere from -5% to -9% at the close, which was a great improvement over losses early in the session. Pharmacies, drug distributors and REITs were negatively affected as well. The retail ETF XRT joined in and slumped -1.21%.

In the meantime, the economic “hits” continued unabashed with Housing starts suffering its worst streak since January 2009, dropping for the 3rd month in a row (-5.5%) bruising expectations of +4.1%. So, it’s no surprise that building permits also tumbled by -4.9% vs. expectations of +1.7%. Ouch!

In the bigger scheme of things, US economic data has not disappointed this much since August 2011, with the US Macro Surprise Index being hugely disconnected from the stock market as the chart below shows:

Read More

Weekly StatSheet For The ETF Tracker Newsletter – Updated Through 06/15/2017

Ulli ETF StatSheet Contact

ETF Data updated through Thursday, June 15, 2017

Methodology/Use of this StatSheet:

  1. From the universe of over 1,800 ETFs, I have selected only those with a trading volume of over $5 million per day (HV ETFs), so that liquidity and a small bid/ask spread are assured.
  2. Trend Tracking Indexes (TTIs)

Buy or Sell decisions for Domestic and International ETFs (section 1 and 2), are made based on the respective TTI and its position either above or below its long-term M/A (Moving Average). A crossing of the trend line from below accompanied by some staying power above constitutes a “Buy” signal. Conversely, a clear break below the line constitutes a “Sell” signal. Additionally, I use a 7.5% trailing stop loss on all positions in these categories to control downside risk.

  1. All other investment arenas do not have a TTI and should be traded based on the position of the individual ETF relative to its own respective trend line (%M/A). That’s why those signals are referred to as a “Selective Buy.” In other words, if an ETF crosses its own trendline to the upside, a “Buy” signal is generated. Since these areas tend to be more volatile, I recommend a wider trailing sell stop of 7.5% -10% depending on your risk tolerance.

If you are unfamiliar with some of the terminology, please see Glossary of Terms and new subscriber information in section 9.


  1. DOMESTIC EQUITY ETFs: BUY — since 4/4/2016
Click on chart to enlarge

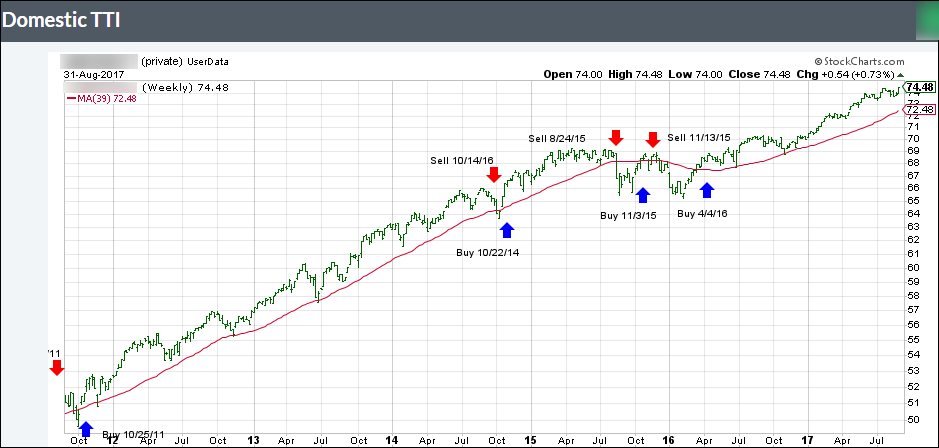
Our main directional indicator, the Domestic Trend Tracking Index (TTI-green line in the above chart) is positioned above its long-term trend line (red) by +3.56% after having generated a new Domestic Buy signal effective 4/4/2016 as posted.
Read More

Red Is The Color Of The Day As Indexes Slide

Ulli Market Commentary Contact

[Chart courtesy of MarketWatch.com]
  1. Moving the Markets

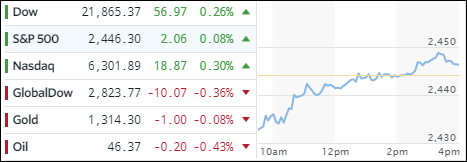
The reaction to the Fed’s hawkish tone on Wednesday continued to take its toll on the markets for the second day, with the major indexes hovering below the unchanged line all day. The mood on Wall Street could be best described as “cautious” with news of a special counsel investigating allegations, as to whether Trump obstructed justice, not helping matters. The markets hate uncertainty and that’s what we got today.

As has been the case lately, the Nasdaq, down 4 of the last 5 days, took the brunt of the beating as tech shares (XLK) extended its month-to-date decline to -1.7%. The FANG stocks got hammered to an 8-week low, but dip buyers stepped in late today to minimize the session’s losses, however, they still closed below yesterday’s lows with Netflix (NFLX) showing the largest drop.

It appears that the Fed has not noticed the collapse of America’s economy but the US dollar has, as it continues on its 2017 downward path having lost -5.6% of its value. Although today, UUP showed a rebound of +0.60%, which sent gold and silver lower. Interest rates rose a tad with the 20-year T-bond losing -0.16%.

Read More

Fed Does The Expected; Markets Disappointed

Ulli Market Commentary Contact

[Chart courtesy of MarketWatch.com]
  1. Moving the Markets

In the face of poor economic news, the Fed did the expected by hiking interest rates 0.25% and set plans in motion to shrink its $4.5 trillion balance sheet reflecting the view that “an economic expansion now entering its ninth year no longer needs so much propping up.” They also appeared to stick to their plans for one more rate increase this year.

The latest economic data released showed anything but an expansion:

  • The Core PPI disappointed the inflation hoping crowd as it printed +1.7%, which was worse than the expected 1.9% and the weakest growth since February 2015.
  • Headline CPI slowed from 2.2% YoY to 1.9% YOY (also missing expectations)
  • S. retail sales are the weakest in 16 months as sales sank -0.3%, the biggest drop since January 2016.
  • Business inventories tumbled 0.2% MoM in April, the biggest drop since Novembe3 2015.
  • Inventory-to-sales stagnated but remain in a recession-signaling mode. Not a good sign for Q2 GDP.

Source: ZH and MarketWatch

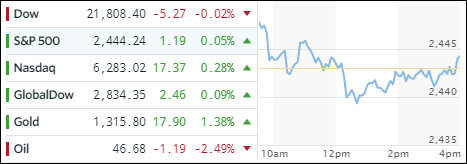
After the Fed announcement, the major indexes headed south and rebounded during the last hour with only the Dow crossing back above the unchanged line.

Gold’s early rally was wiped out and the metal ended down -0.48%. The FANG stocks were slammed again and T-bond yields collapsed with the 10-year dropping from yesterday’s close of 2.21% to 2.15%. As yields tanked, bond prices rallied with the 20-year T-Bond ETF (TLT) gaining +1.54%.

The US Dollar index had its own roller coaster ride dropping sharply early on, after the release of weak CPI and Retail Sales data, but it shifted into rally mode, after the Fed decision was released, and made up most of the losses to close down by a only a minimal -0.08% (UUP).

Read More