- Moving the Markets
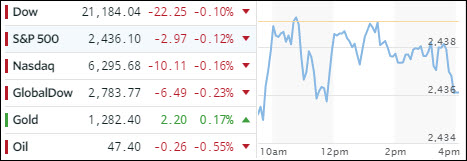
For the second day, market nervousness prevailed, as concerns ahead of the UK general election, uncertainties about ex-FBI chief Comey’s upcoming testimony to the Senate, along with a Thursday ECB policy meeting, kept the major indexes subdued and stuck below their respective unchanged lines. However, as was the case yesterday, the pullback was minor.
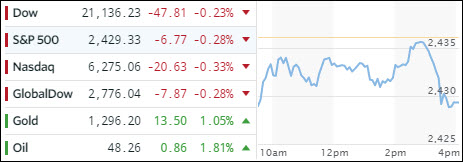
Interest rates took another dive with the 10-year T-Bond losing 4 basis points to now yield +2.14%, which is a substantial drop from the beginning of March 2017 when the yield had reached +2.62%. What does it mean? Simple, if yields slide at this pace, it usually is a sign that the economy is heading towards a recession which, when reviewing the downright atrocious and worsening economic data points, appears to be a reasonable conclusion. The question seems to be not “if” but “when.”
The US dollar (UUP) followed suit by slipping -0.24% to a level last seen early October 2016. As is no surprise, this weakness has benefited gold, which is now in striking distance of reclaiming the $1,300 marker, which is a number gold has not been able to reach since around Election Day.