ETF Tracker Newsletter For February 21, 2025

Ulli ETF Tracker Contact

ETF Tracker StatSheet          

You can view the latest version here.

GOLD SHINES AMID MARKET TURMOIL, BITCOIN STUMBLES ON CHINA NEWS

[Chart courtesy of MarketWatch.com]

  1. Moving the market

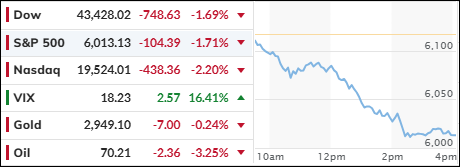
A weak consumer sentiment reading and a nearly 9% drop in UnitedHealth stock combined to dampen any bullish sentiment, causing major indexes to dive early on.

According to the Wall Street Journal, UnitedHealth is under investigation by the Justice Department, with more information to come. This pullback marks the stock’s worst decline in five years. However, a comeback may be on the horizon after the company labeled the WSJ’s report on Medicare billing practices as “misinformation.”

The Michigan consumer sentiment index fell to 64.7 in January, plunging into contraction territory, which represents a 10% drop and was worse than expected due to fears of higher inflation ahead.

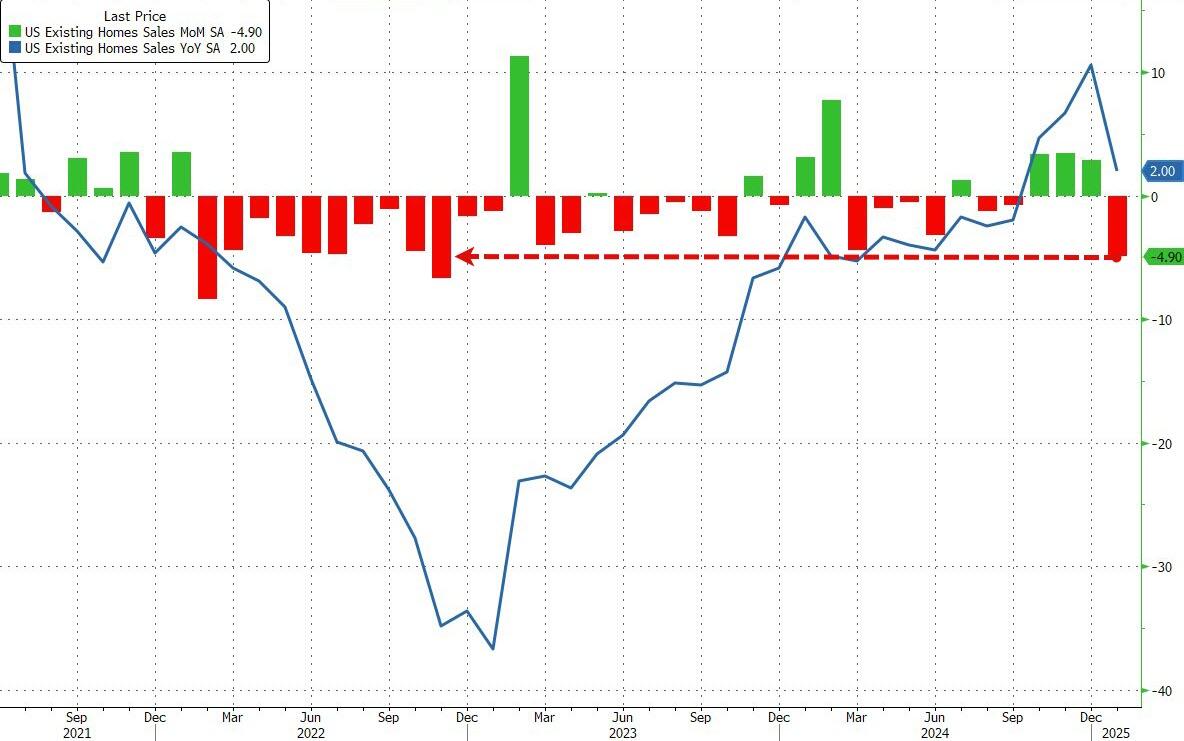
Additionally, January U.S. existing home sales declined by 4.9% month-over-month, compared to expectations of a 2.6% drop, as mortgage rates rose. Sales fell the most in the West and South, partly due to destructive wildfires and severe winter weather.

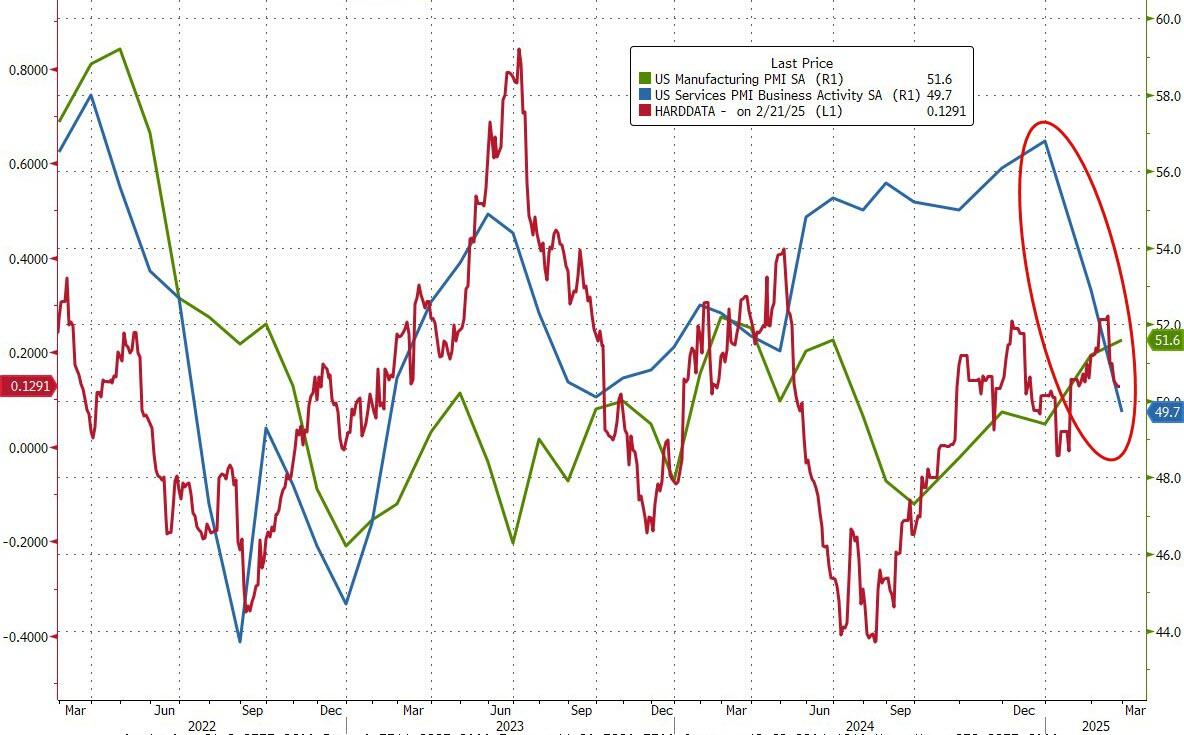
With markets struggling all week and entering the seasonally weakest period of the year, traders are increasingly concerned with the soft data points, as indexes slump despite the S&P’s recent all-time high.

In the end, nothing worked for the bulls. Multi-trillion-dollar options expirations, China’s discovery of a new coronavirus, and the upcoming elections in Germany this weekend all contributed to major indexes closing lower for the week.

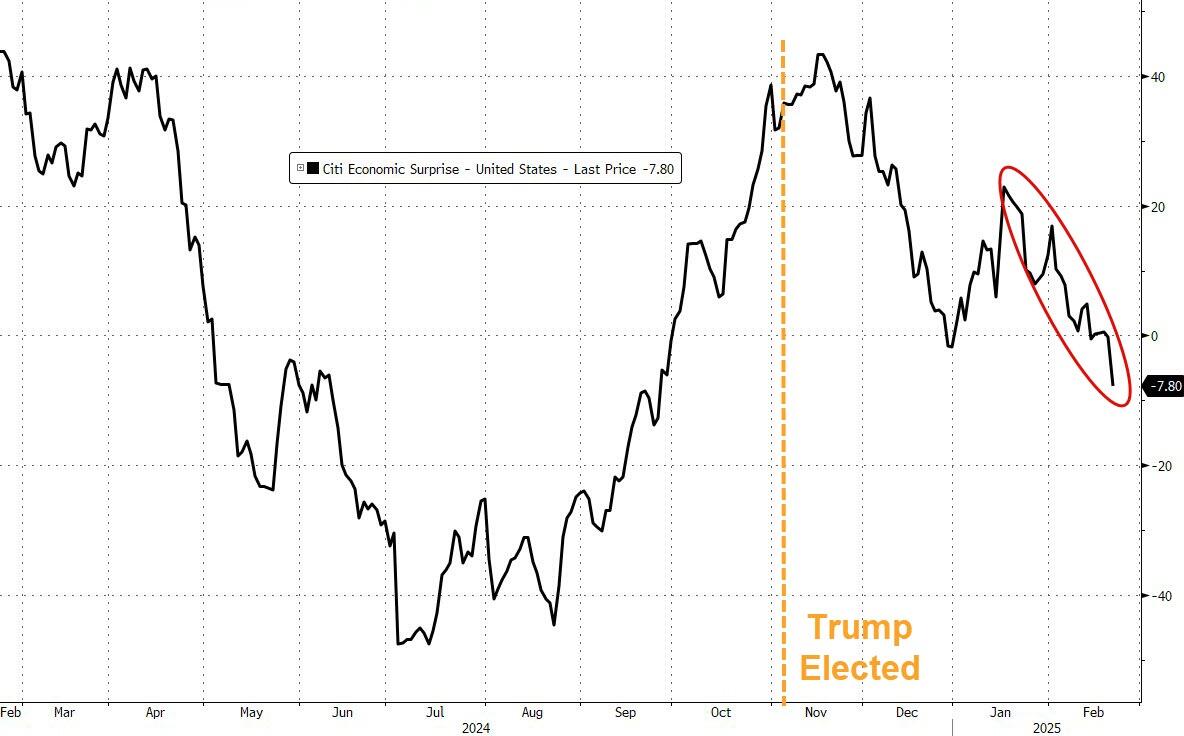
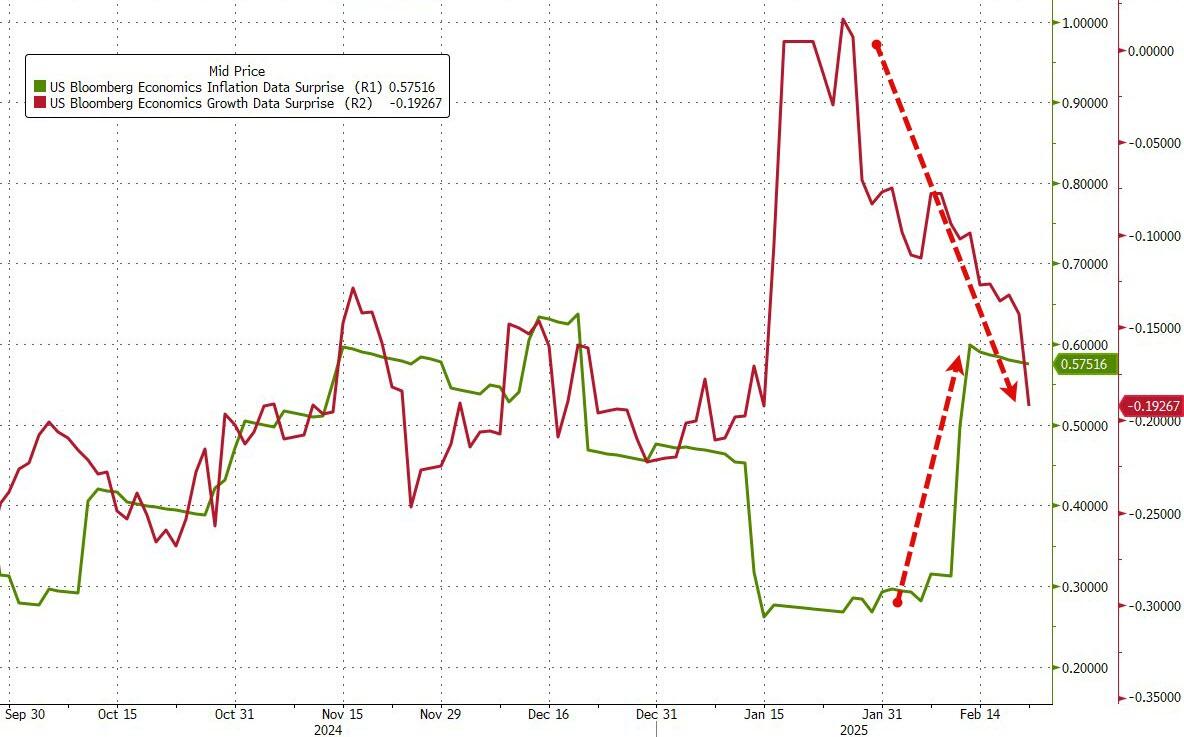
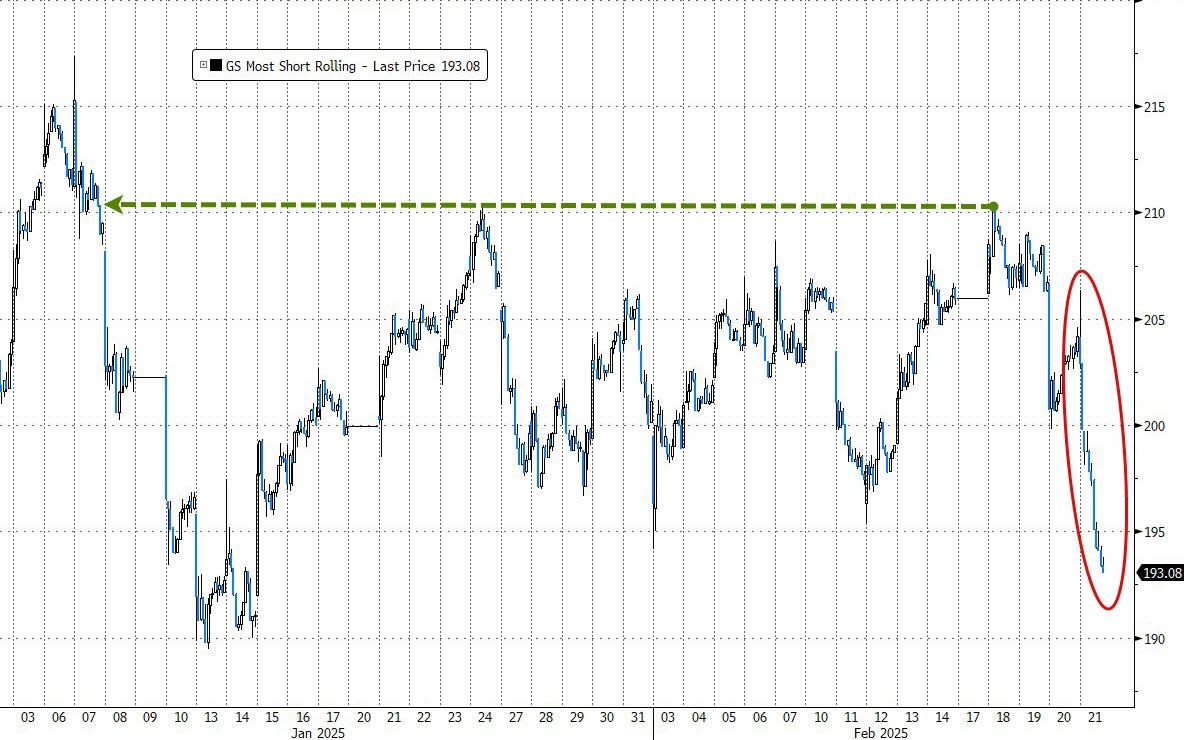
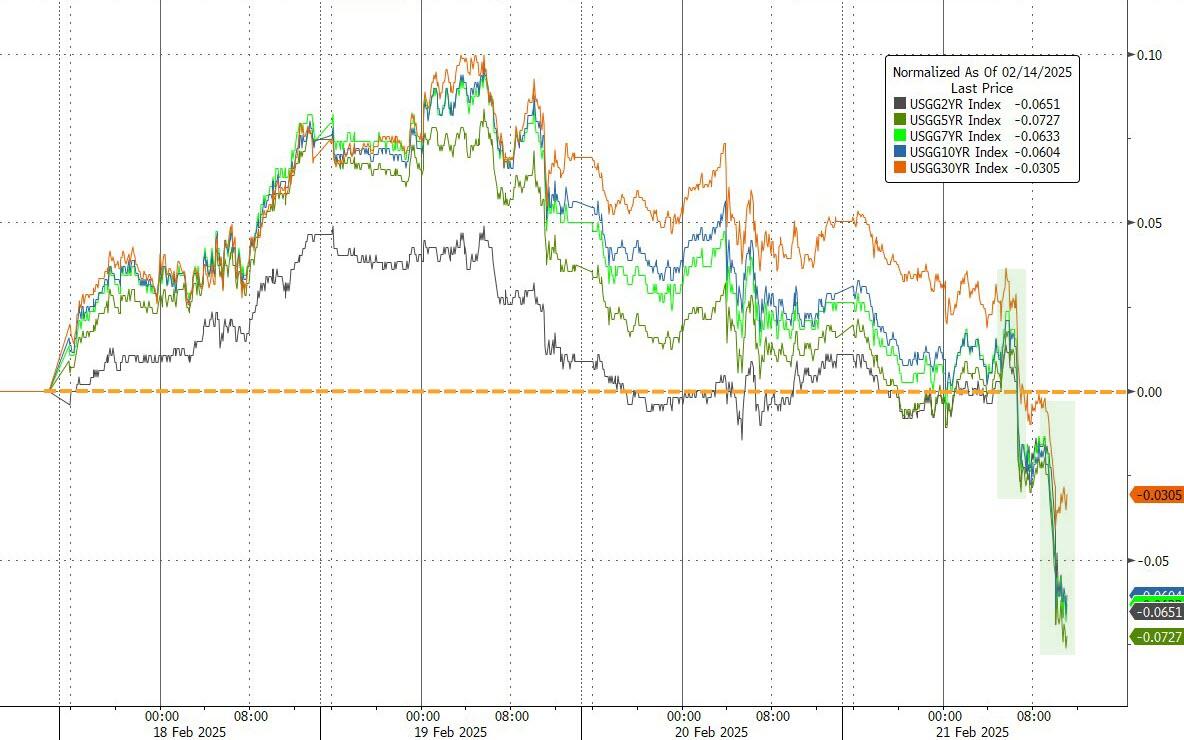
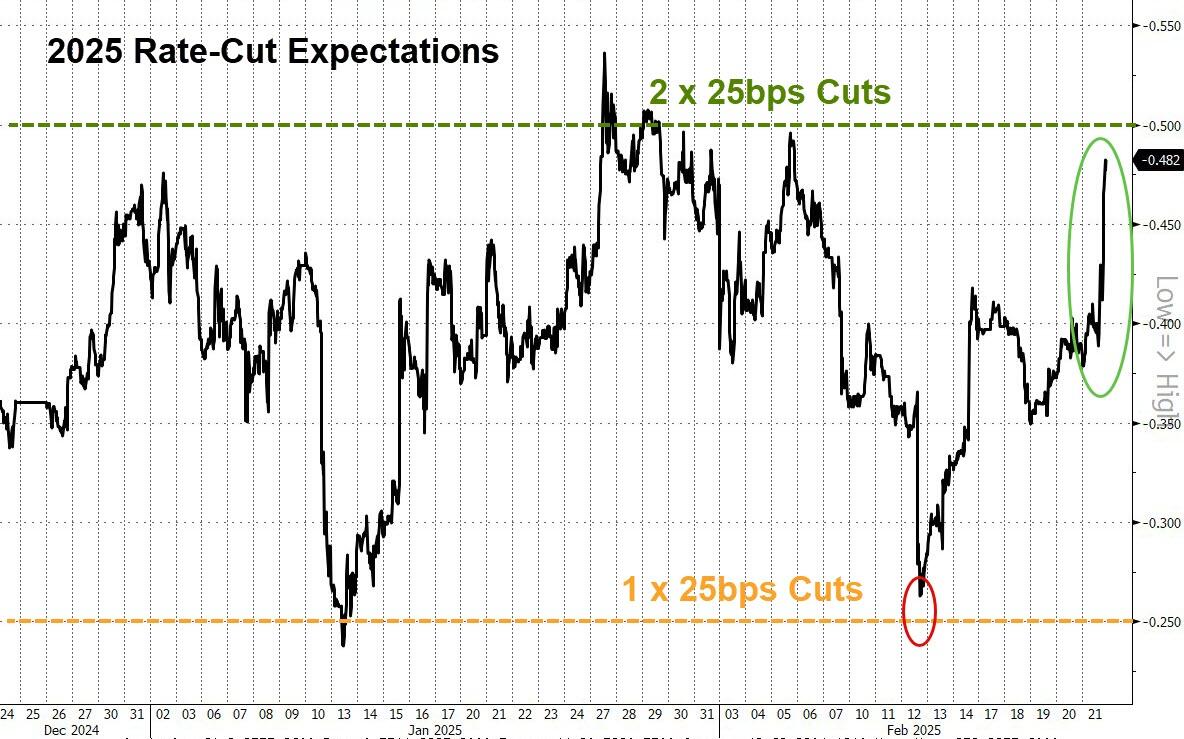
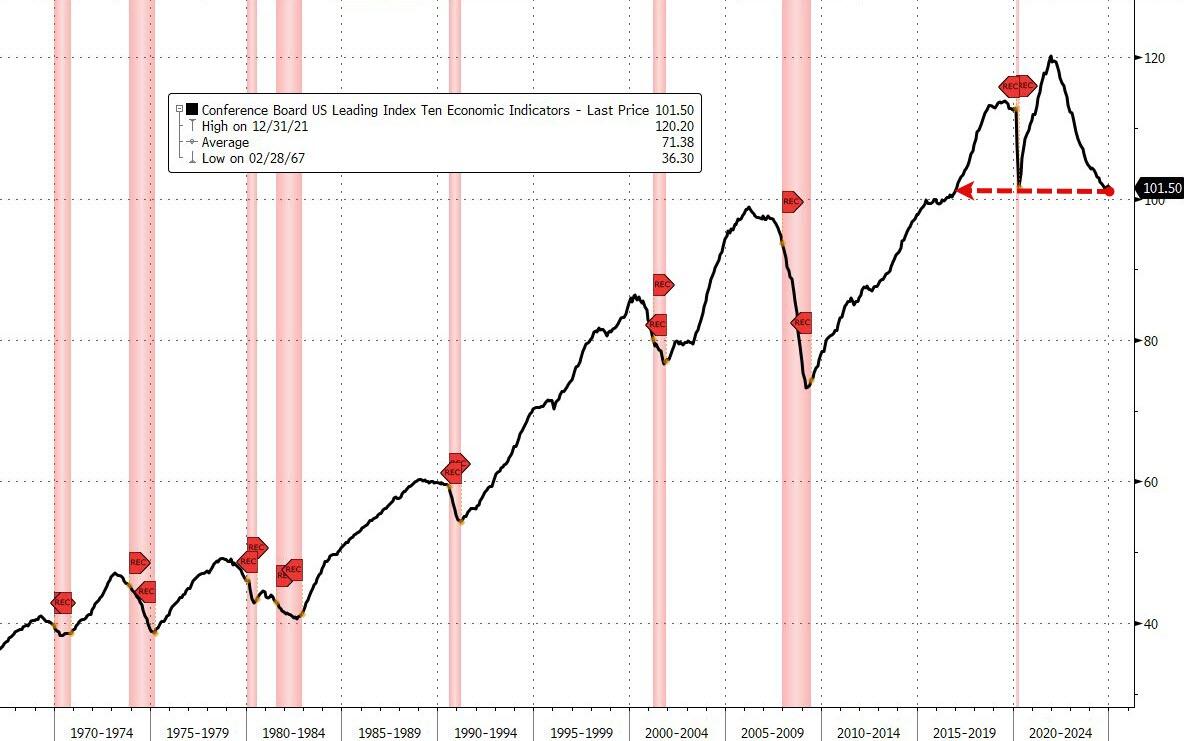
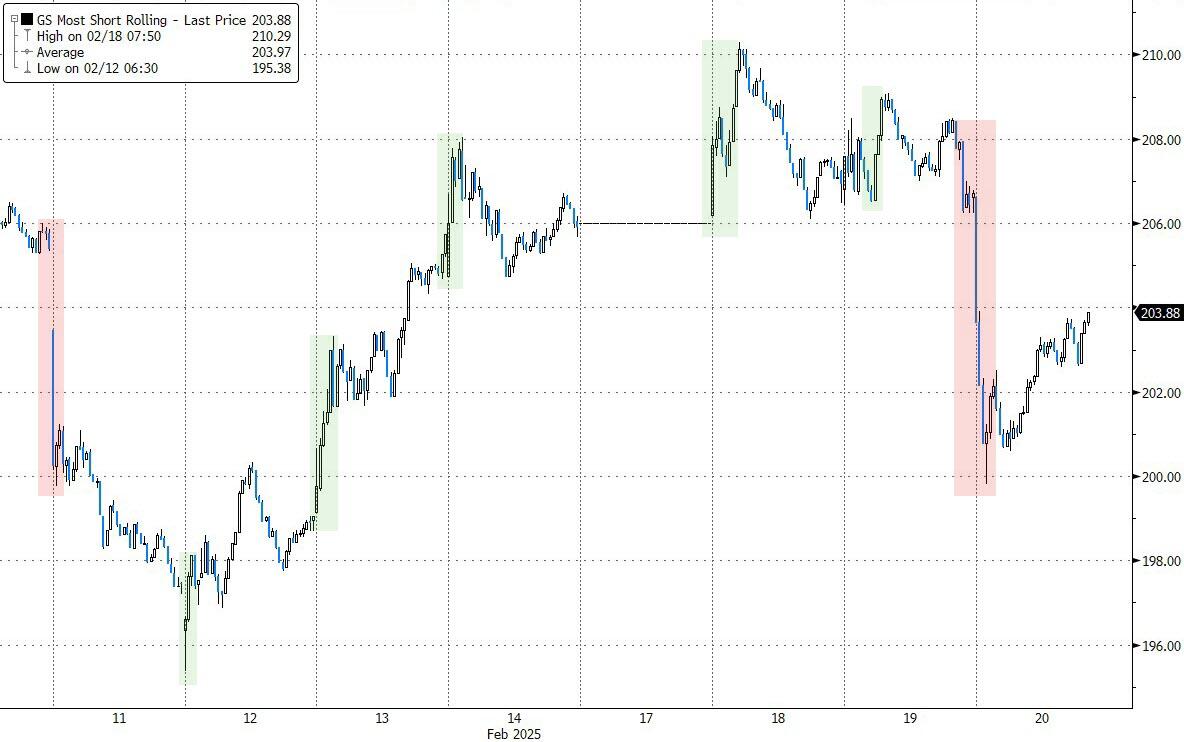
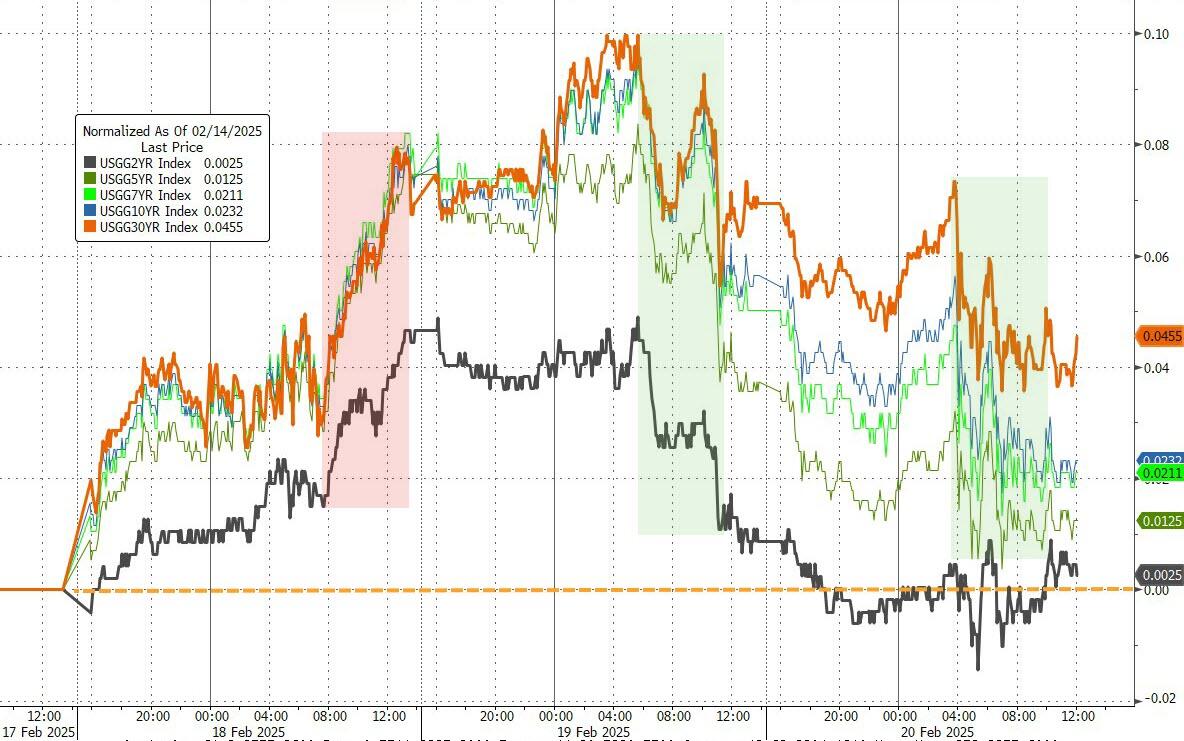
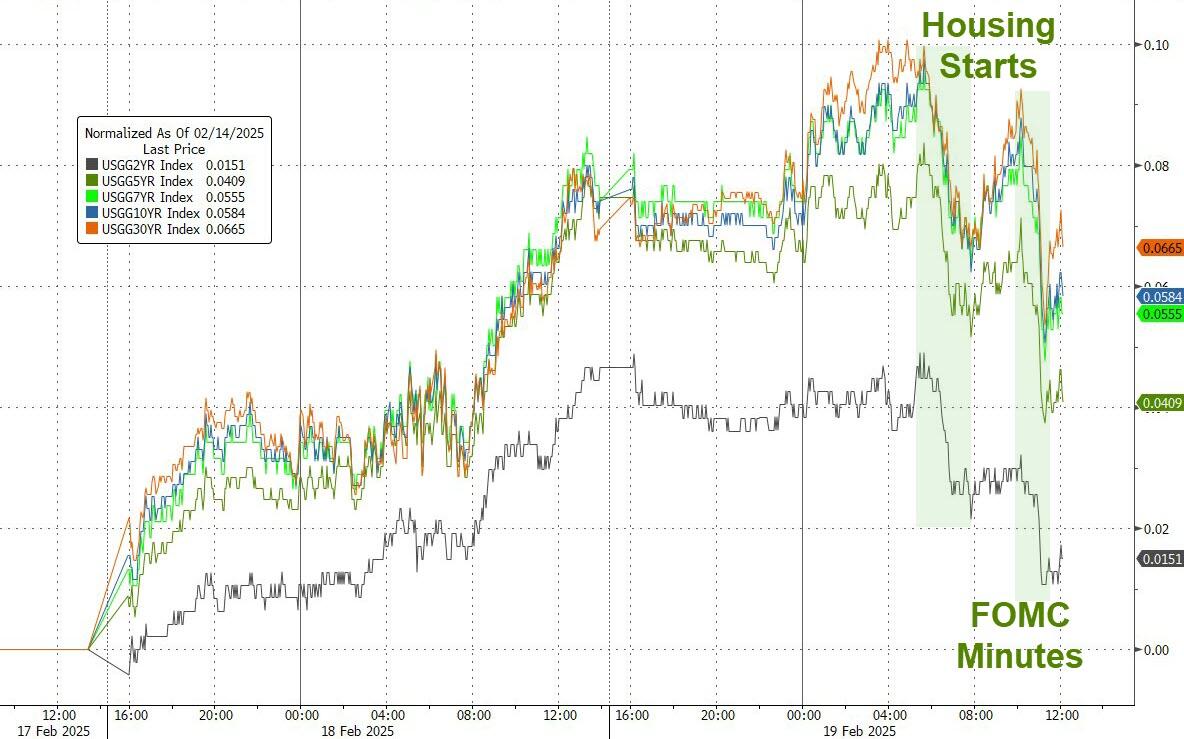
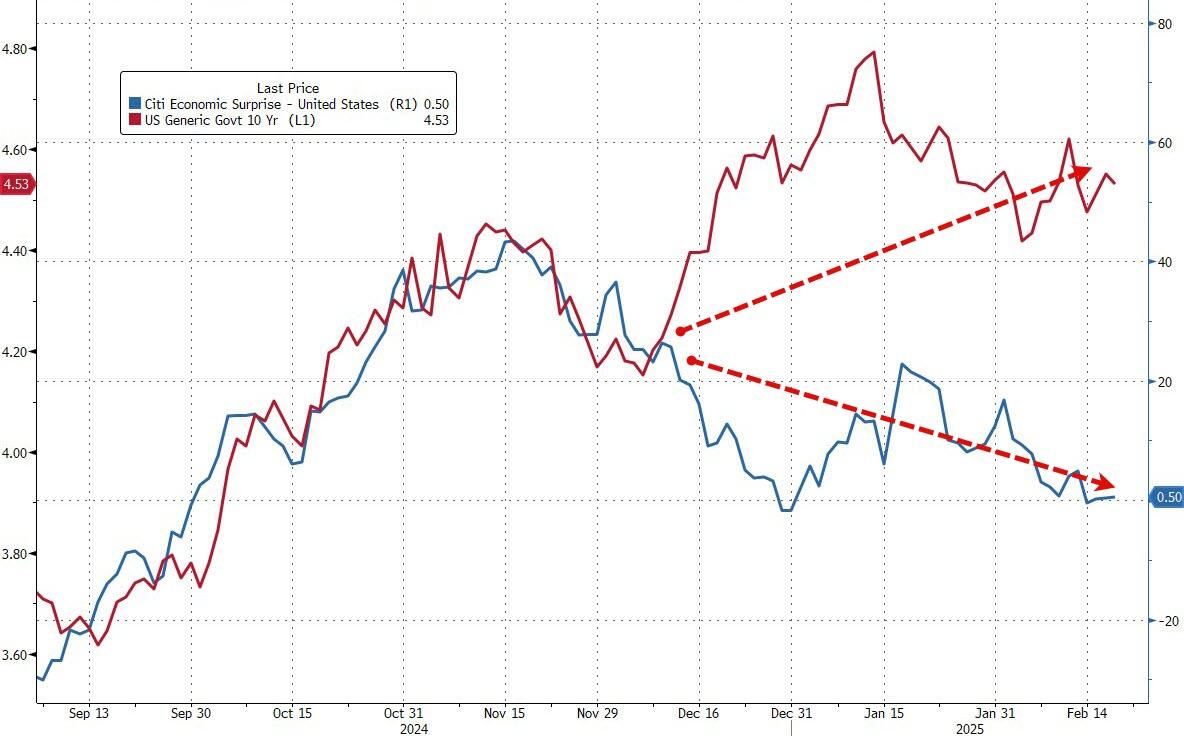
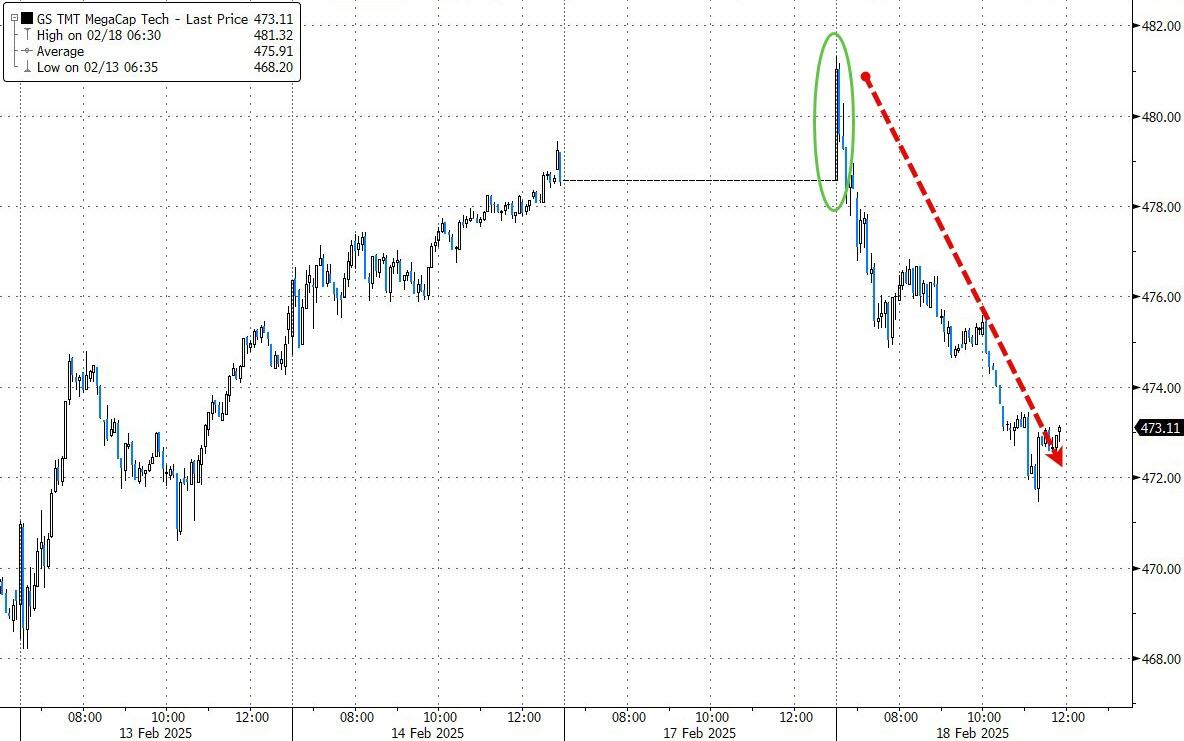
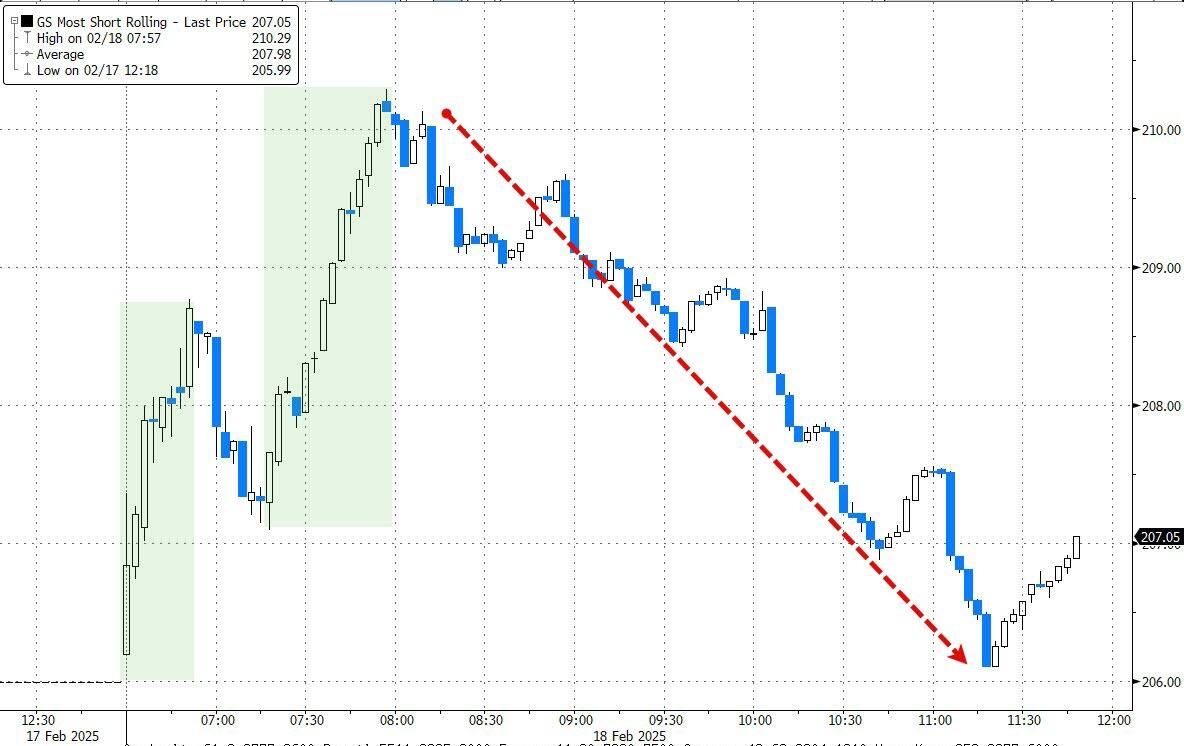
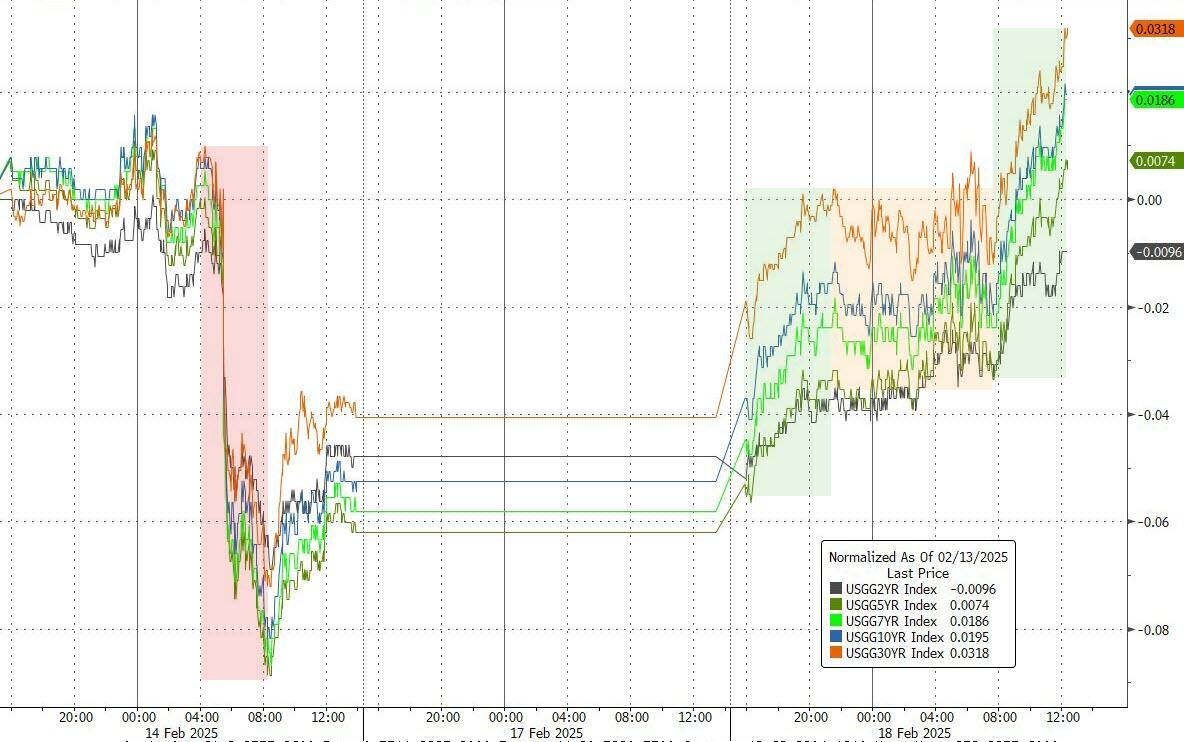
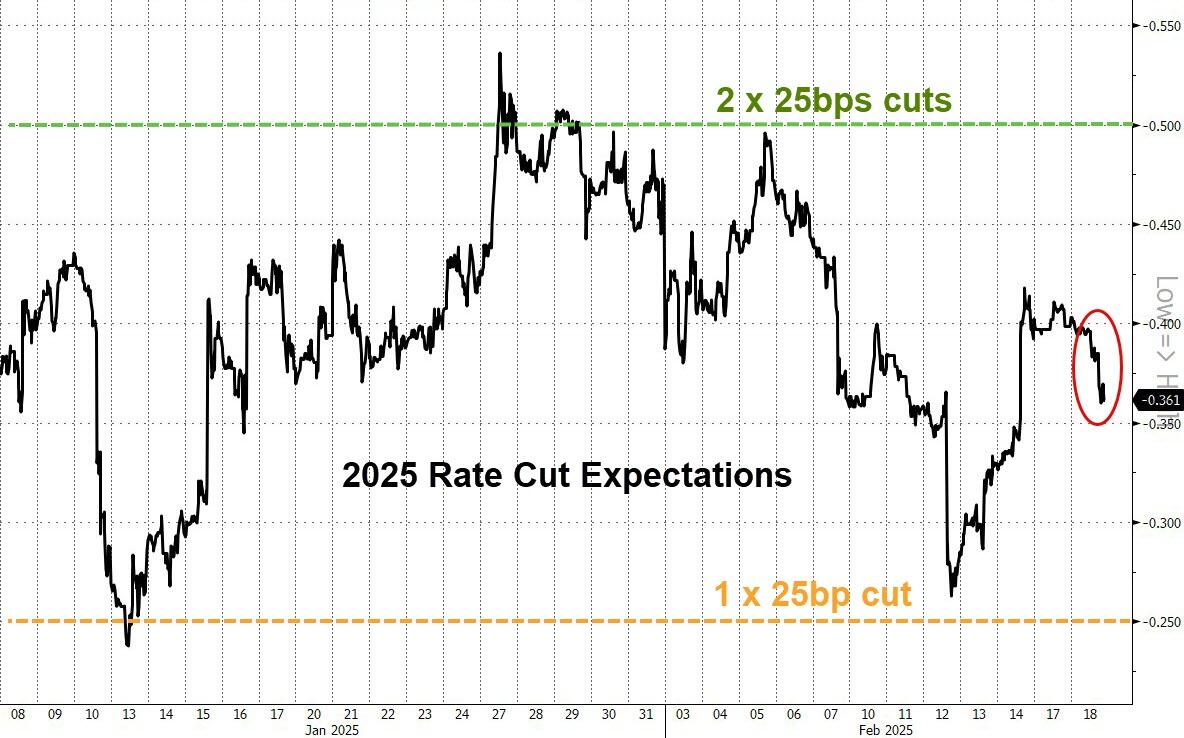
These factors pulled down the U.S. Macro Surprise Index, which neared six-month lows, with the much-feared “stagflation” premise reappearing. The most shorted stocks were slammed to five-week lows, while the mega-tech sector retreated to its recent trading range. Bond yields headed lower as rate-cut expectations rebounded from their recent sell-off.

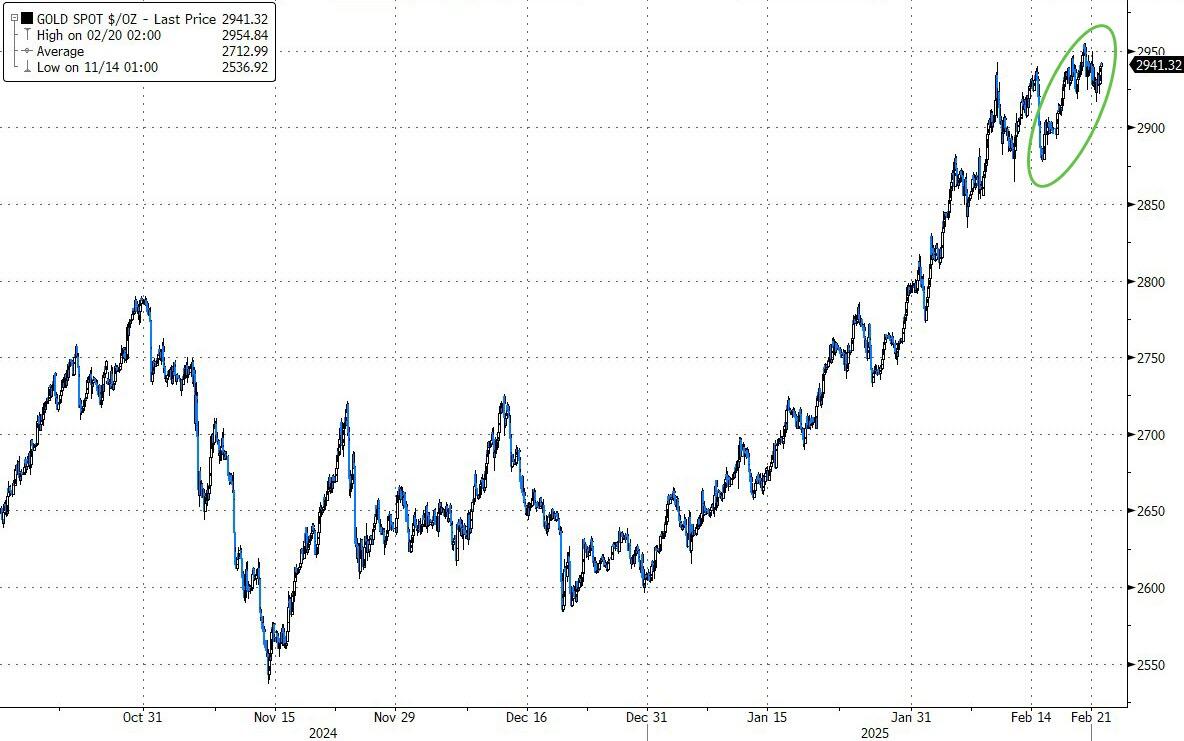
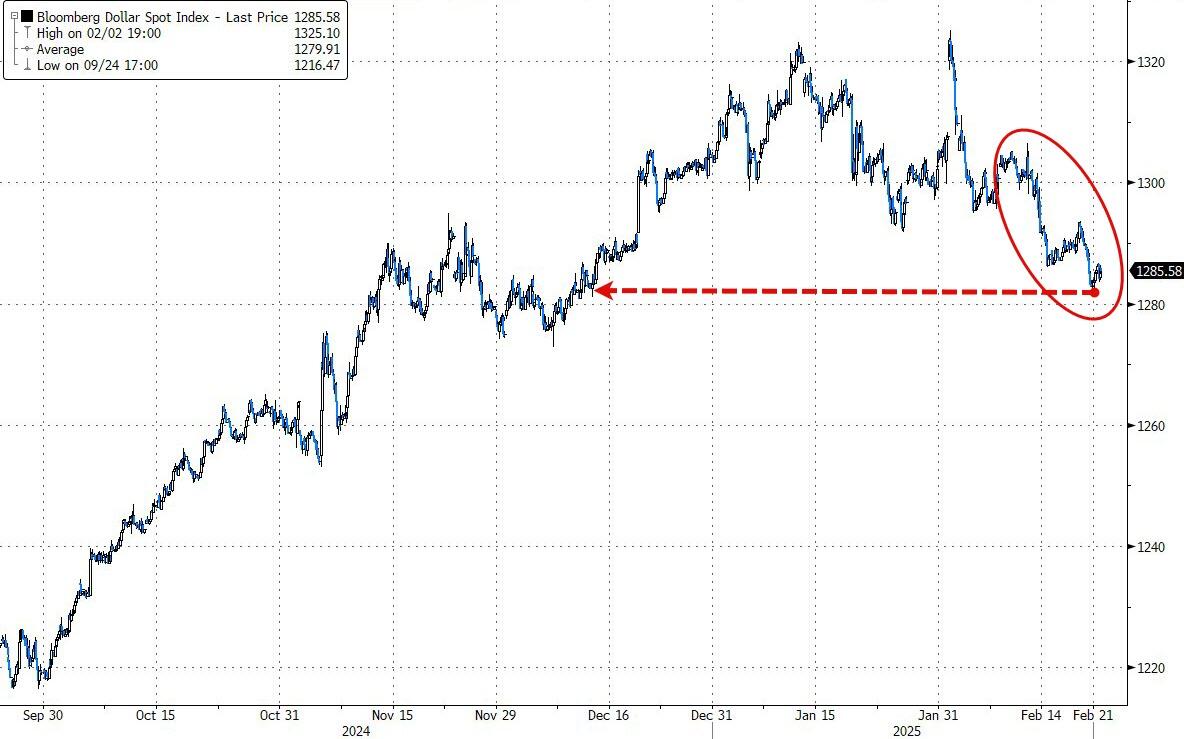
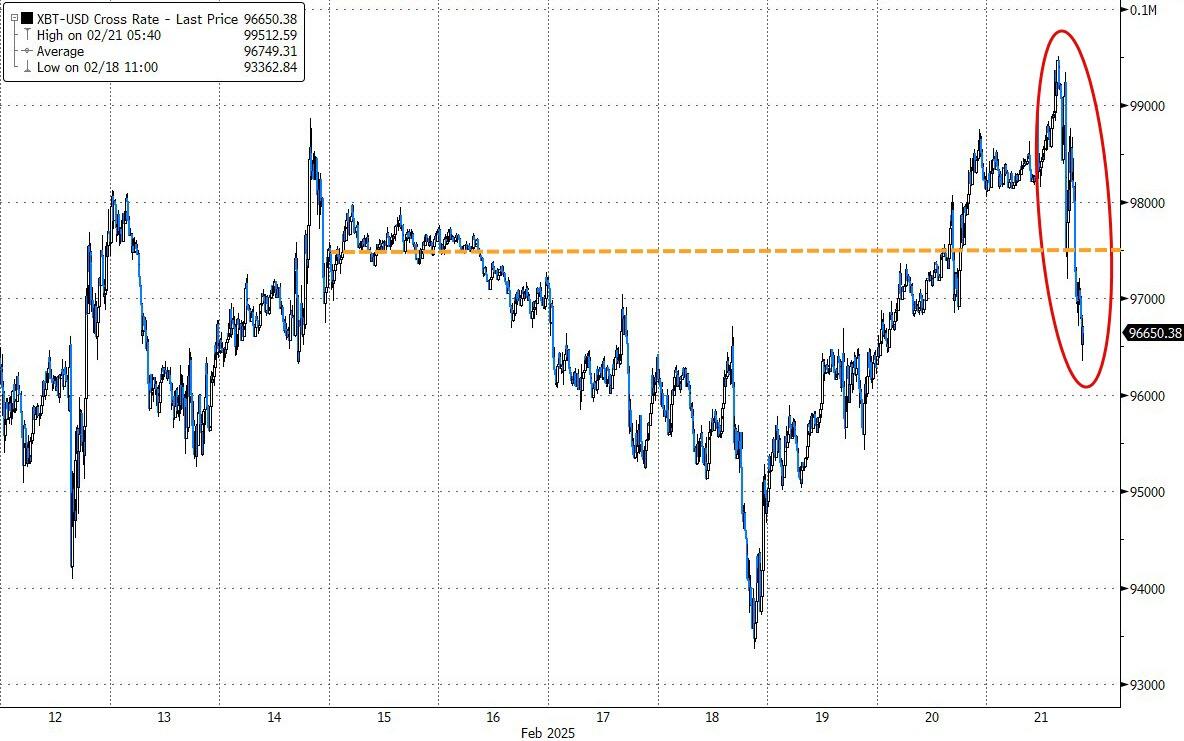
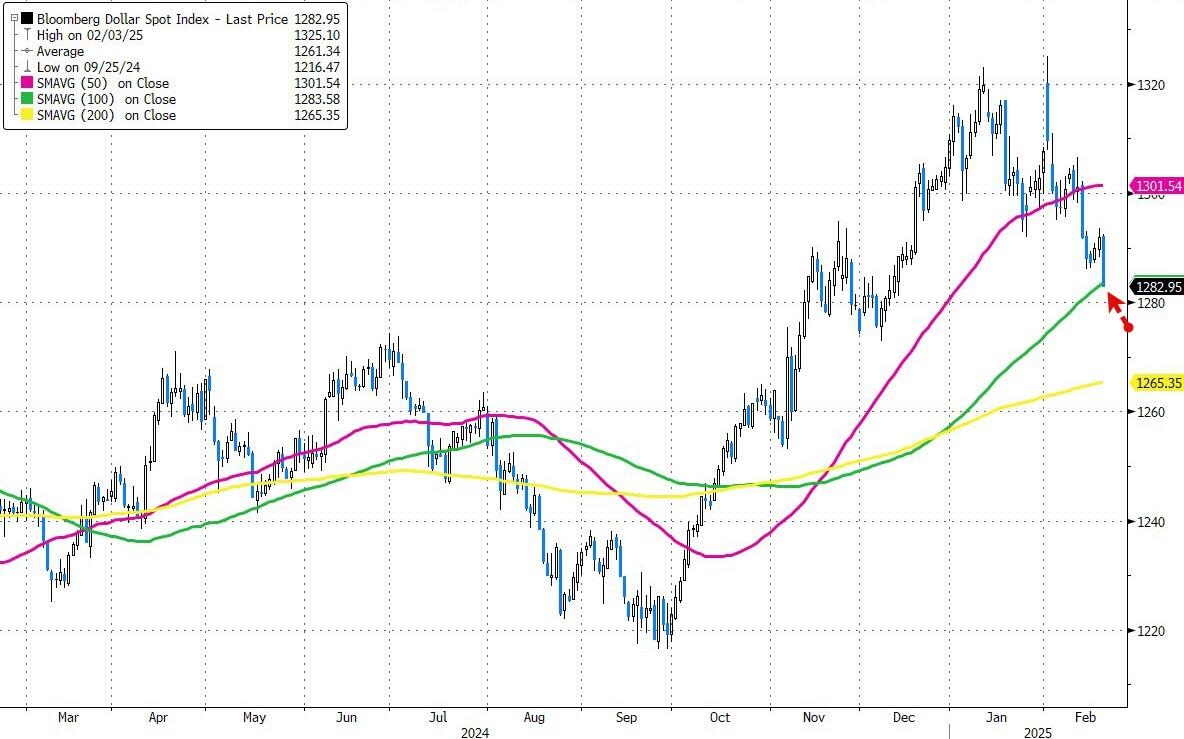
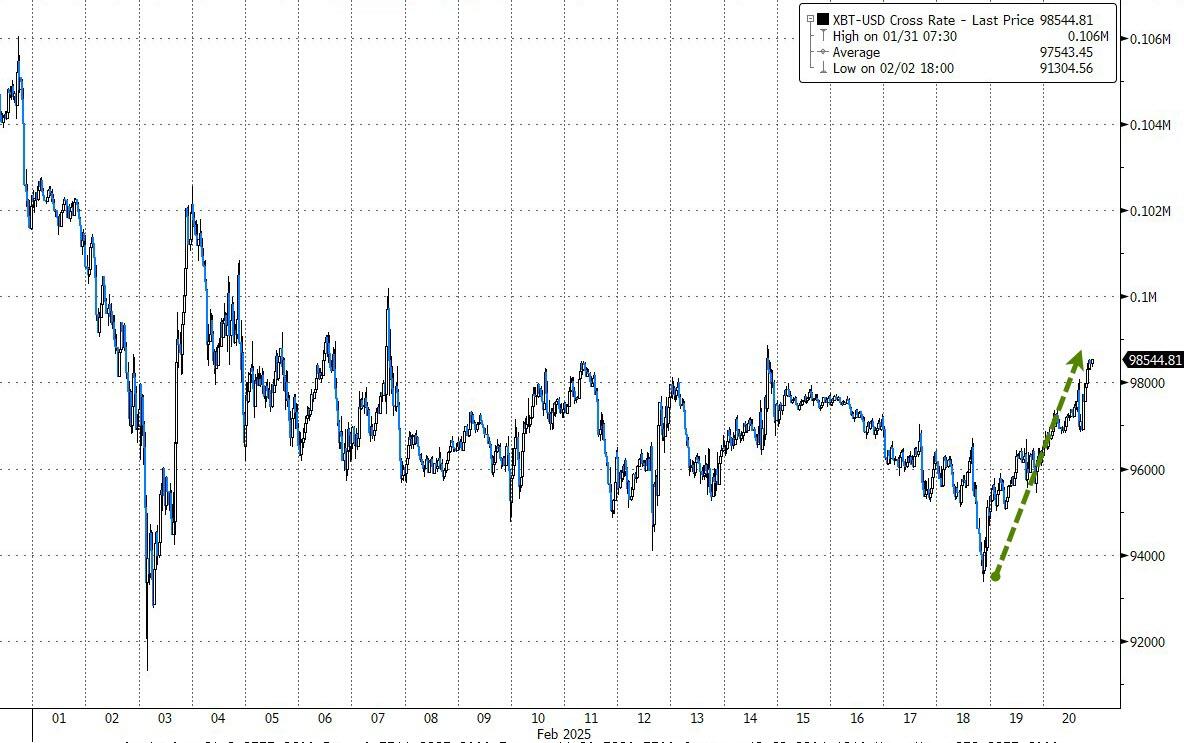
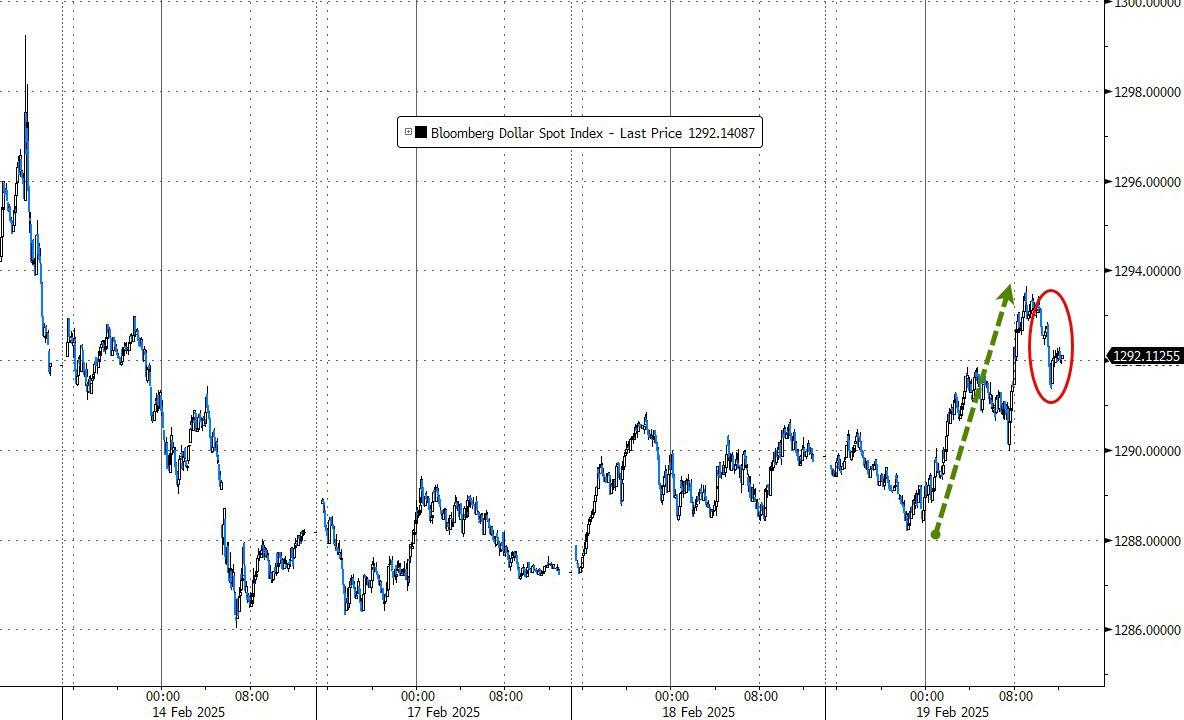
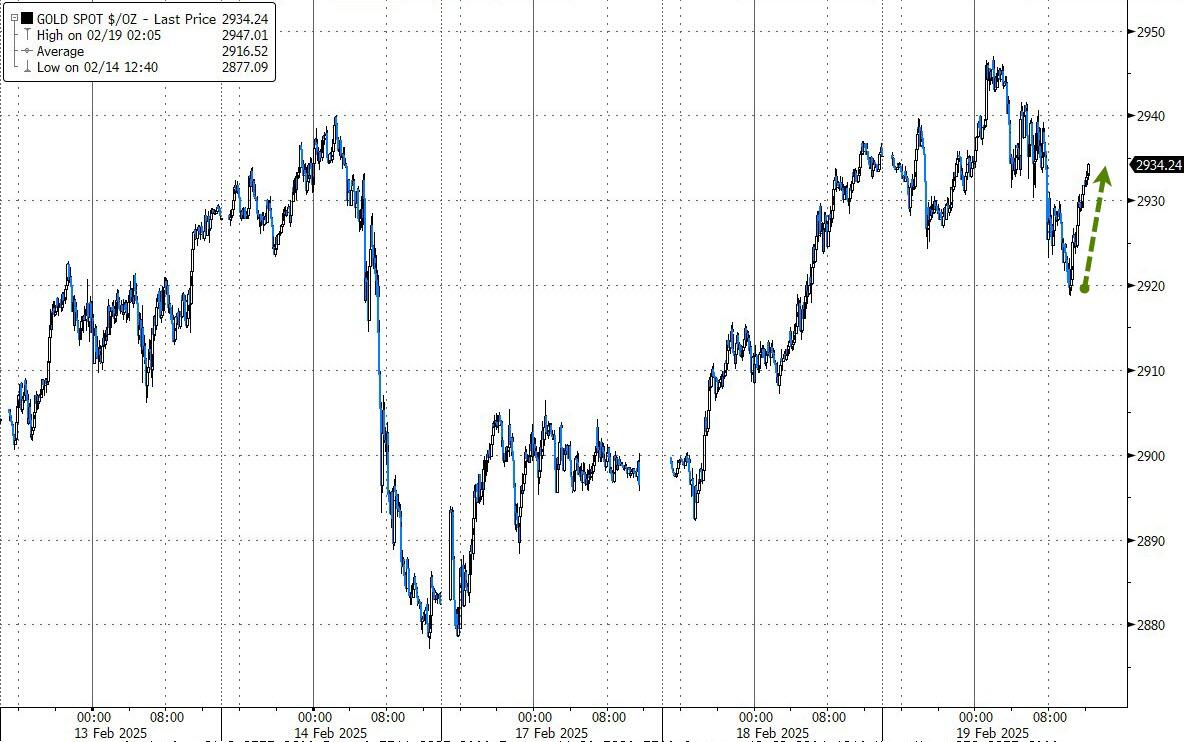
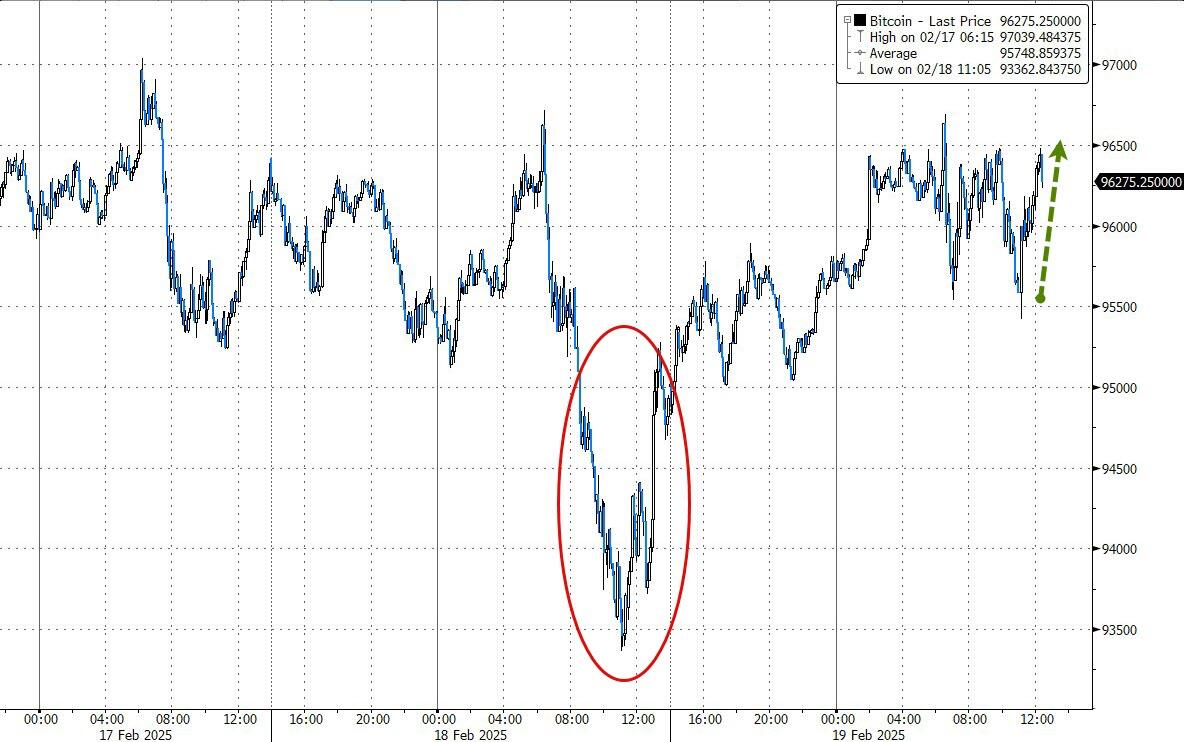
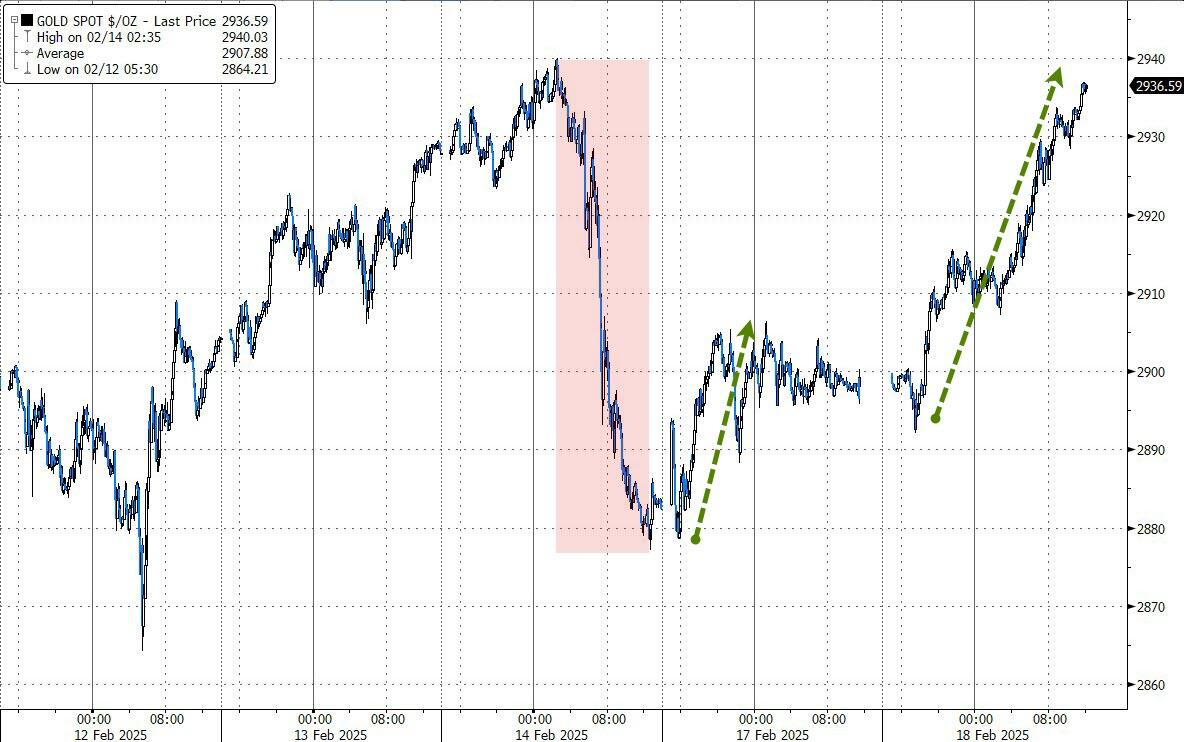
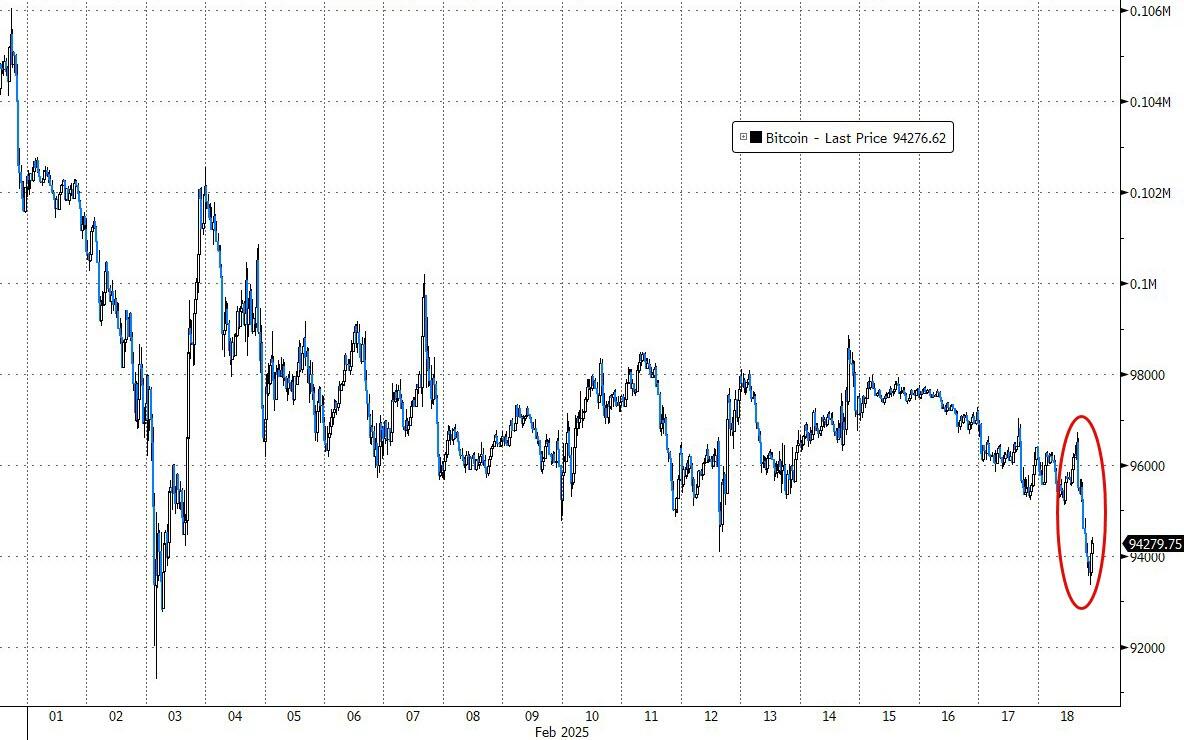
Gold remained the unshakable asset class, closing higher for the eighth straight week while scoring a new record high. The dollar lost momentum and dropped, while Bitcoin suffered a similar fate, crossing $99k to the upside before the China news pulled the rug out from early bullish sentiment.

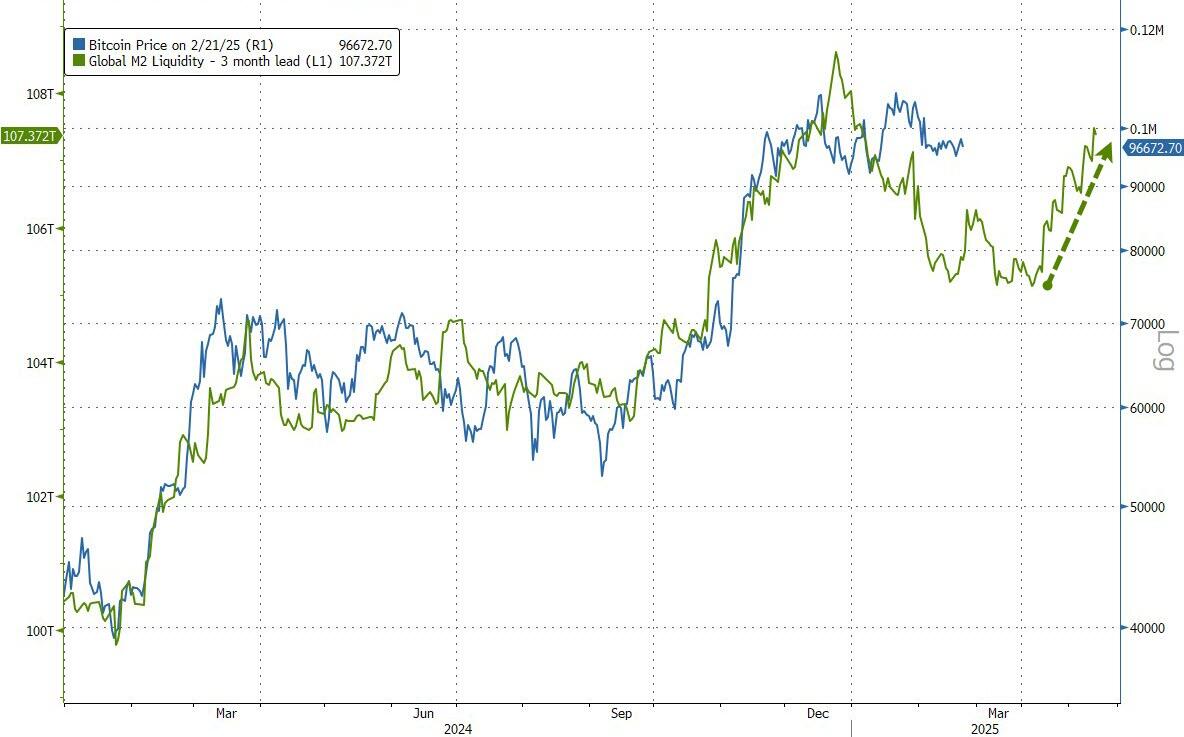
As Zero Hedge pointed out, Bitcoin follows global liquidity and may have more downside momentum left before racing back into record territory.

Read More

Weekly StatSheet For The ETF Tracker Newsletter – Updated Through 02/20/2025

Ulli ETF StatSheet Contact

ETF Data updated through Thursday, February 20, 2025

How to use this StatSheet:

  1. Out of the 1,800+ ETFs out there, I only pick the ones that trade over $5 million per day (HV ETFs), so you don’t get stuck with a lemon that nobody wants to buy or sell.
  1. Trend Tracking Indexes (TTIs)

These are the main indicators that tell you when to buy or sell Domestic and International ETFs (section 1 and 2). They do that by comparing their position to their long-term M/A (Moving Average). If they cross above, and stay there, it’s a green light to buy. If they fall below, and keep going, it’s a red light to sell. And to make sure you don’t lose your shirt if things go south, I also use a 12% trailing stop loss on all positions in these categories.

  1. All other investment areas don’t have a TTI and should be traded based on the position of each ETF relative to its own trend line (%M/A). That’s why I call them “Selective Buy.” In other words, if an ETF goes above its own trend line, you can buy it. But don’t forget to use a trailing sell stop of 12%, or less if you’re feeling nervous.

If some of these words sound like Greek to you, please check out the Glossary of Terms and new subscriber information in section 9.

  1. DOMESTIC EQUITY ETFs: BUY— since 11/21/2023

Click on chart to enlarge

This is our main compass, the Domestic Trend Tracking Index (TTI-green line in the above chart). It has broken above its long-term trend line (red) by +4.75% and is in “Buy” mode as posted.

Read More

Retailers Drag Markets Down Amid Economic Uncertainty

Ulli Market Commentary Contact

[Chart courtesy of MarketWatch.com]
  1. Moving the market

Equities dropped this morning as the S&P 500 retreated from yesterday’s new all-time high, following a disappointing forecast from Walmart.

The stock fell over 6.5% after the company announced lackluster fiscal year sales growth of 3-4% and a 2026 earnings outlook that fell below expectations. This weak guidance raised concerns about the health of the consumer.

The news dragged down fellow retailers Target, Palantir, and Costco, reducing risk appetite on Wall Street and leading to a down session. Adding to the economic uncertainty, the Leading Economic Index unexpectedly contracted in January.

The most shorted stocks gave back a portion of last week’s gains, as the major indexes managed to bounce off their worst levels of the day but still closed in the red, led by the Dow.

Bond yields slipped, the dollar weakened, while Bitcoin built on yesterday’s rebound and crossed the $98k level, with gold following suit and adding 0.56%.

The precious metal has continued last year’s strong performance, outperforming the S&P 500 year-to-date by a ratio of 2.9 to 1.

Read More

Equities Rebound On Fed Taper Hints; Dollar And Bitcoin Rally

Ulli Market Commentary Contact

[Chart courtesy of MarketWatch.com]

  1. Moving the market

After yesterday’s record session for the S&P 500, the major indexes pulled back moderately due to concerns about persistent inflation and proposed trade tariffs by Trump. He suggested imposing duties of up to 25% on imported autos, chips, and pharmaceuticals.

Among the S&P 500 sectors, Materials were the worst performers, losing around 1%, while Energy defied the trend with a 1.4% gain as today’s session began.

Despite the negative sentiment surrounding inflation and bond yields, the market’s resilience since Trump took office a month ago has been impressive.

Equities managed to recover and close in positive territory once again, spurred by the latest Fed Minutes hinting at a possible taper or pause in the Fed’s tightening program.

Falling bond yields, weak housing starts, and lower trending macro data also contributed to the market’s recovery. The dollar rallied for the second consecutive day, gold remained relatively unchanged, and oil prices fluctuated but ended with a small gain.

Bitcoin rebounded from yesterday’s decline, approaching the $97k level. Will it finally be able to conquer the $100k resistance again?

Read More

Strong Start To Weak Season: Can Market Momentum Continue?

Ulli Market Commentary Contact

[Chart courtesy of MarketWatch.com]

  1. Moving the market

The markets showed little activity early on, with the S&P 500 trading near its highs and eventually closing at a new all-time high.

Some tech stocks, including Intel, Nvidia, and Microsoft, posted gains, with Intel leading the pack and achieving its largest two-week increase on record. Meanwhile, Meta’s 20-day win streak came to an end, causing the mega-cap sector to retreat.

After a winning week, with the Nasdaq advancing 2.6% and the S&P 500 up 1.5%, a pause may be in order. The bullish trend was supported by Trump’s announcement on Thursday about reciprocal tariffs, which were less stringent than feared.

The markets have been in a consolidation period since early December, with a potential breakout likely influenced by the latest news from Washington, which remains unpredictable.

The most shorted stocks declined, while gold surged towards the $3,000 level. In contrast, Bitcoin hit a near three-week low, and oil prices continued their rebound from Friday.

Bond yields increased, reversing the previous day’s decline and lowering expectations for a 2025 rate cut.

Despite being in the seasonally weakest period of the year, today was a strong start. Can this momentum be maintained, or will historical precedent prevail?

Read More

ETFs On The Cutline – Updated Through 02/14/2025

Ulli ETFs on the Cutline Contact

Do you want to know which ETFs are hot and which ones are not? Then you need my High-Volume ETF Cutline report. It tells you how close or far each of the 311 ETFs I follow is from its long-term trend line (39-week SMA). These are the ETFs that trade more than $5 million a day, so they are not some obscure funds that nobody cares about.

The report is split into two parts: The winners that are above their trend line (%M/A), and the losers that are below it. The yellow line is the line of shame that separates them. You can see how many ETFs are in each group and how they have changed since the last report (182 vs. 215 current).

Take a peek:

The HV ETF Master Cutline Report

If you are confused by some of the terms we use, don’t panic. I have a helpful Glossary of Terms for you. If you want to learn more about the Cutline method and how it can make you rich (or at least less poor), read my original post here.