Uncertainty Reigns Ahead Of Jobs Report

Ulli Market Commentary Contact

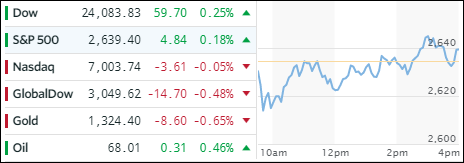
[Chart courtesy of MarketWatch.com]
  1. Moving the markets

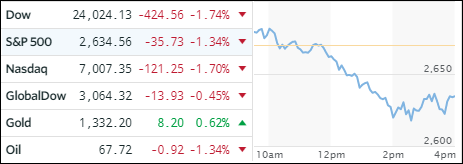
It was another roller coaster ride with the indexes vacillating around their unchanged lines. A nice mid-day rally fizzled out and accelerated to the downside in the last hour when dip buyers stepped in to limit the damage. Volatility picked up due to rising interest rates and inflation along with uncertainty ahead of tomorrow’s jobs report.

The mixed picture carried over to ETF land where winners and losers were just about evenly matched. Bucking the bearish trend were Financials (XLF +0.94%), Aerospace & Defense (ITA +0.57%) and International SmallCaps (SCHC +0.42%). On the other end of the spectrum, we saw Emerging Markets (SCHE -1.41%), Semiconductors (SMH -0.61%) and Transportations (IYT -0.56%) closing in the red.

The bond arena saw a bloodbath today with the yield on 10-year jumping 6 basis points to 2.78%, a level last seen in April 2014, while the 30-year climbed above the 3% level to end the session at 3.01%. As a result, bond prices plunged with the widely held 20-year (TLT) losing -1.45%, which it had last visited in May last year.

If you are wondering how the US dollar (UUP) fared in this environment, it should come as no surprise that it got spanked as well (-0.52%), or monkey hammered as some analysts referred to it. But, but, as President Trump recently confirmed, we have a strong dollar policy. Go figure…

Read More

Stumbling But Closing In The Green

Ulli Market Commentary Contact

[Chart courtesy of MarketWatch.com]
  1. Moving the markets

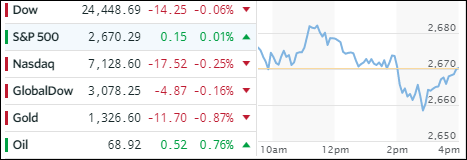
An early rebound faltered, and the major indexes declined below the unchanged line but managed to crawl back into positive territory to close out the month with solid gains. The Dow added +5.8%, its best January since 1997, while the S&P 500 and Nasdaq rallied +5.6% and +7.4% respectively. The culprit for the weakness was the Fed hinting that it is “set to raise interest rates as early as its next meeting in March.

As a result, bonds were spooked with the 10-year yield bouncing to 2.74%, which is its highest level since early 2014, but closing at 2.72%. In the end, equities closed mixed along with our ETFs. Emerging markets (SCHE) were the clear leader with a solid gain of +1.26%, which was closely followed by Semiconductors (SMH +0.84%). Closing in the red were US SmallCaps (SCHA -0.50%) and International SmallCaps (SCHC -0.10%).

Gold and Crude Oil both closed up, but the US Dollar (UUP) lost another -0.13% and had its worst January since 1987.

Read More

Major Indexes Down For 2nd Straight Day

Ulli Market Commentary Contact

[Chart courtesy of MarketWatch.com]
  1. Moving the markets

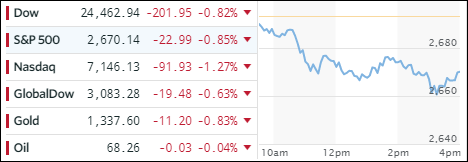
It should be no surprise to anyone that, given the tear the markets have been on over the past 14 months without much of an interruption, a correction or pullback was way overdue. Weakness was broad based with the main culprits being healthcare, technology, energy and financials. Especially, some of the diving healthcare stocks contributed some 40% of the Dow’s decline.

Not helping matters was another VIX spike to above the 15 handle, its highest level since August. Bond yields continued pushing up with the 30-year now honing in on the psychologically important 3% level, while the 10-year yield sported a gain of 3 basis points to end the session at 2.73%. Both, bond and stock holders, had the worst day since election when considering that the much hyped “safe” combination, stocks down and bonds up, failed.

However, in the end, a view of the big picture is important, which says equities are still on path to their best monthly gain in 2 years—and the 15th monthly gain in a row (thanks to ZH for this stat). The US dollar (UUP) took a dive despite Treasury Secretary Mnuchin desperately trying to take back his words at Davos that “a weaker dollar is good for us as it relates to trade and opportunities.” His jawboning today, that he “supports a strong greenback in the long term,” merely softened the dollar’s slide.

Read More

10-Year Bond Yield Pumps And Equities Dump

Ulli Market Commentary Contact

[Chart courtesy of MarketWatch.com]
  1. Moving the markets

A host of news events combined forces to pull equities off their lofty levels with the S&P 500 having its worst day in 5 months, while bonds had their worst day in 6 weeks. First, there were the NAFTA negotiations, which appeared to be progressing well, but the fly in the ointment was that there was no willingness to issue a joint statement thereby putting pressure on the stock market early on.

The VIX spiked and did not pull back and, with the market manipulators apparently asleep at the wheel, closed at its highest since August. Then rising interest rates kicked in with the 10-year bond yield jumping 4 basis points to close at 2.70% (intra-day to 2.72%) its highest level since April 2014. A variety of individual stocks took a noticeable dive such as WYNN (Steve Wynn sex scandal), AAPL (iPhone X orders slashed) and CAT (declining margins), all of which gave the bears the upper hand—at least for this day.

However, in the bigger scheme of things today’s pullback is hardly worth mentioning when considering the rapid market advances we’ve seen not only last year but during the first month of this year as well. With all this debacle going on, the US Dollar (UUP) managed to buck the overall negative trend by closing up +0.26%; a tiny bounce off its multi-year lows.

Read More

ETFs On The Cutline – Updated Through 01/26/2018

Ulli ETFs on the Cutline Contact

Below please find the latest High Volume ETFs Cutline report, which shows how far above or below their respective long-term trend lines (39 week SMA) my currently tracked ETFs are positioned.

This report covers the HV ETF Master List from Thursday’s StatSheet and includes 366 High Volume ETFs ETFs, defined as those with an average daily volume of more than $5 million, of which currently 249 (last week 244) are hovering in bullish territory. The yellow line separates those ETFs that are positioned above their trend line (%M/A) from those that have dropped below it.

Take a look:

The HV ETF Master Cutline Report

In case you are not familiar with some of the terminology used in the reports, please read the Glossary of Terms.

If you missed the original post about the Cutline approach, you can read it here.

ETF Tracker Newsletter For January 26, 2018

Ulli ETF Tracker Contact

ETF Tracker StatSheet

https://theetfbully.com/2018/01/weekly-statsheet-etf-tracker-newsletter-updated-01-25-2018/

 BEST START TO A YEAR FOR DOW AND S&P 500 SINCE 1987

[Chart courtesy of MarketWatch.com]
  1. Moving the markets

Another day with solid advances for the major indexes (in the face of a rising VIX) as  the Dow, Nasdaq and S&P 500 gained for the 4th week in a row (and 9 for the last 10 for Dow and S&P 500). At the same time, the S&P eclipsed Goldman Sachs’s 2018 year-end-target of 2,850, which clearly demonstrates the value of forecasting. Hat tip goes to ZH for these historical nuggets.

As a result, gains were broadly spread, and the ETF space was no exception with green being the color of the day. Heading the leaders were Semiconductors (SMH) with an impressive +3.18% move higher. Lagging behind, but with solid gains nonetheless, was the Dividend ETF (SCHD +1.70%), Aerospace& Defense (ITA +1.31%) and Emerging Markets (SCHE +1.30%). Low man on the totem pole was US SmallCaps (SCHA) with +0.38%.

Interest rates rose with 10-year bond yield climbing 3 basis points to end at 2.66%. Intra-day, it attempted to break through the 2.67% level, but the glass ceiling held. Oil managed to rally while gold took a breather and pulled back. Ah, yes, and then there is the whipping boy of the past twelve months, namely the US Dollar (UUP), which had its worst start to a year since 1987 and continued its bad fortune by dropping another -0.21% on the day. But, the administration confirmed that we have a strong dollar policy. Go figure…

Read More