Refueling The Bullish Gas Tank

Ulli Market Commentary Contact

[Chart courtesy of MarketWatch.com]
  1. Moving the markets

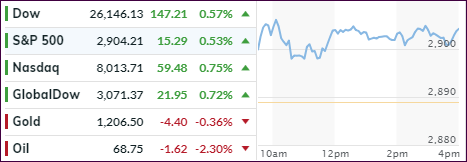
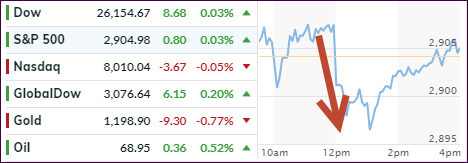
Just as quickly as trade war headlines pulled the markets off their lofty highs yesterday, negative sentiment reversed with the bulls refueling their gas tank and pushing the major indexes higher right after the opening bell.

It appears that global investors are favoring the US markets due to continued optimism about the outlook for not just corporate profits but also earnings growth, attributable in part due to the tax-cut bill of 2017.

Never mind that the 10-year bond yield knifed through the 3% level, after several attempts in the recent past, to close solidly above it at 3.05%, its highest point since May. That caused some pain for those holding bonds as part of their portfolio, as the 20-year bond ETF TLT got hammered at the tune of -1.05%. Remember, higher yields equal lower bond prices.

Investors chose to ignore the yield spike and simply kept on going with the bullish equity theme, as if higher bond yields were a good thing for stocks. Who knows how long that meme can last?

Wall Street traders also shrugged off the escalating trade tensions with China by focusing on one thing and one thing only and that was the assumption that this economy is “strong by any measures.” While this may seem odd in the face of previous market reactions, today nothing seemed to stand in the way of bullish sentiment.

While tomorrow may be an entirely different story, for this day, trade wars, imploding emerging market currencies, along with higher bond yields, were a non-event allowing the bulls to wipe out most of yesterday’s losses.
Read More

Markets Sink As Tech Gets Wrecked

Ulli Market Commentary Contact

[Chart courtesy of MarketWatch.com]
  1. Moving the markets

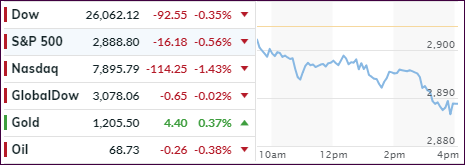
The tariff dispute with China intensified pulling the major indexes off their recent highs, as the tech sector got hammered with the Nasdaq dropping -1.43%, its worst day since late July.

The sudden re-appearance of the US/China trade battles rattled Wall Street, although the unveiling of the $200 billion in tariffs on Chinese products has not been exactly a secret, but with this looming threat not going away, investors decided enough is enough with this uncertainty and south we went.

Adding fuel to the fire was continued doubt as to how the Chinese might retaliate, especially while focusing their views on US corporations doing business in China. But, the fallout spread to the domestic arena as well, with some of the most influential companies, namely Apple and Amazon, getting punished at the tune of -2.7% and -3.2% respectively, which was their biggest loss since April.

This marks the first drop for the S&P 500 in five sessions, but the loss was a modest -0.56%. The FANGs led on the way down and experienced their biggest drop in 2 weeks while, at the same time, closing at a 1-month low.

The US 10-year Treasury yield meandered, crossed the glass ceiling of 3% intra-day but backed off to close below it. As this chart from ZH shows, the 10-year yield has closed higher only once since May 23rd. I believe that it will break through this resistance level soon which, once it does, may have a much-expected adverse impact on equities.

But, with computer algos overseeing the markets, you can never be sure these days about any potential outcome. Only time will tell…

Read More

ETFs On The Cutline – Updated Through 09/14/2018

Ulli ETFs on the Cutline Contact

Below, please find the latest High-Volume ETF Cutline report, which shows how far above or below their respective long-term trend lines (39-week SMA) my currently tracked ETFs are positioned.

This report covers the HV ETF Master List from Thursday’s StatSheet and includes 366 High Volume ETFs ETFs, defined as those with an average daily volume of more than $5 million, of which currently 172 (last week 161) are hovering in bullish territory. The yellow line separates those ETFs that are positioned above their trend line (%M/A) from those that have dropped below it.

Take a look:

The HV ETF Master Cutline Report

In case you are not familiar with some of the terminology used in the reports, please read the Glossary of Terms.

If you missed the original post about the Cutline approach, you can read it here.

ETF Tracker Newsletter For September 14, 2018

Ulli ETF Tracker Contact

TRADE WAR FEARS WIPE OUT EARLY GAINS

[Chart courtesy of MarketWatch.com]
  1. Moving the markets

An early rally ran into a brick wall, reversed with the major indexes heading south and below their respective unchanged lines. Causing this sudden change in sentiment was a report, released mid-day, indicating that Trump still intends to impose tariffs on China, despite recent words of reconciliation and apparent lessening of tensions.

That’s all it took to take the starch out of upward momentum, however, the indexes managed to crawl back with the Dow and S&P 500 ending up slightly in the green. For the week, the Dow gained +0.9%, the S&P added +1.2%, while the Nasdaq scored +1.4%.

On the economic front, the latest data points show mixed numbers. Retails sales missed across the board with auto sales sliding. Sentiment soared with economic optimism hitting a 14 year high while industrial production surged the most since 2010.

Summing it up, Treasury yields rose with the 10-year bond briefly touching the 3% level during the session before backing off and closing at 2.99%. While the US dollar ended the week lower, it remains stuck in a trading range when looking at the big picture. Some Emerging Market currencies rebounded but others stayed below their unchanged lines, as you can see here with especially Brazil and Argentina showing sharp losses.

Despite the ups and downs from the verbal ping pong, generated by the seemingly never-ending trade tug-of-war, we gladly accept this having turned out to be a positive week.

Read More

Weekly StatSheet For The ETF Tracker Newsletter – Updated Through 09/13/2018

Ulli ETF StatSheet Contact

ETF Data updated through Thursday, September 13, 2018

Methodology/Use of this StatSheet:

  1. From the universe of over 1,800 ETFs, I have selected only those with a trading volume of over $5 million per day (HV ETFs), so that liquidity and a small bid/ask spread are assured.
  2. Trend Tracking Indexes (TTIs)

Buy or Sell decisions for Domestic and International ETFs (section 1 and 2), are made based on the respective TTI and its position either above or below its long-term M/A (Moving Average). A crossing of the trend line from below accompanied by some staying power above constitutes a “Buy” signal. Conversely, a clear break below the line constitutes a “Sell” signal. Additionally, I use a 7.5% trailing stop loss on all positions in these categories to control downside risk.

  1. All other investment arenas do not have a TTI and should be traded based on the position of the individual ETF relative to its own respective trend line (%M/A). That’s why those signals are referred to as a “Selective Buy.” In other words, if an ETF crosses its own trendline to the upside, a “Buy” signal is generated. Since these areas tend to be more volatile, I recommend a wider trailing sell stop of 7.5% -10% depending on your risk tolerance.

If you are unfamiliar with some of the terminology, please see Glossary of Terms and new subscriber information in section 9.


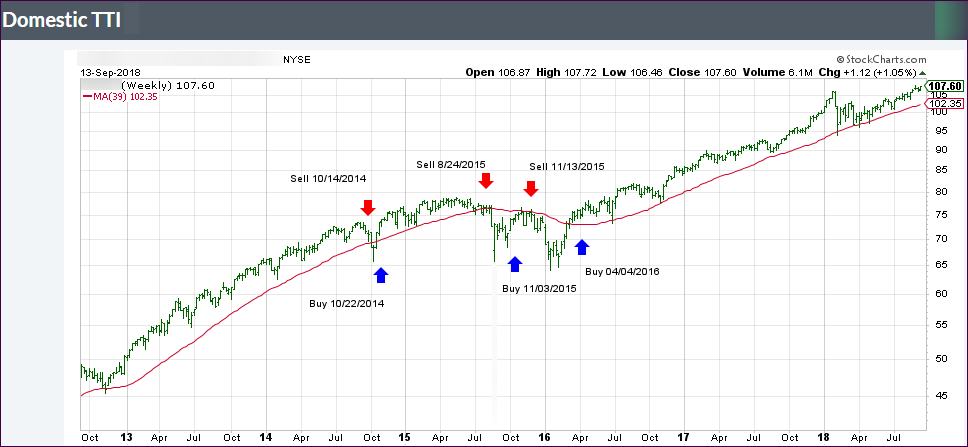
  1. DOMESTIC EQUITY ETFs: BUY — since 4/4/2016

Click on chart to enlarge

Our main directional indicator, the Domestic Trend Tracking Index (TTI-green line in the above chart) is positioned above its long-term trend line (red) by +5.35% after having generated a new Domestic Buy signal effective 4/4/2016 as posted.

Read More

Bulls Dominate For Fourth Straight Day

Ulli Market Commentary Contact

[Chart courtesy of MarketWatch.com]
  1. Moving the markets

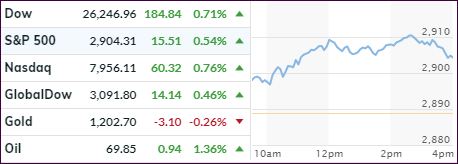
The bulls dominated again and pushed the major indexes higher with the S&P 500 scoring its fourth straight win. Yesterday’s laggard turned into today’s leader, as the tech sector picked up steam with the Nasdaq adding +0.75%, after spiking during the last few minutes of the session.

Helping set the bullish tone were reports suggesting that China was more receptive to the latest propositions from the US regarding trade talk issues. Of course, as we’ve seen in the past, these types of headlines tend to come and go and have, so far, not produced any tangible results.

In Europe, the ECB made no change to interest rates and announced that it has no plans to do so till summer 2019. That seemed to sooth markets despite them trimming the GDP forecast for 2018 and next year as well. Market reaction was muted.

Looking at the big picture, we see that US stocks continue to decouple from the rest of the world. That simply means that the US markets are still considered the least dirty shirt in the dirty laundry basket.

Again, as trend followers, we don’t really care about that. We are only concerned with one thing, which is the major direction of the domestic markets, as calculated by our Domestic TTI (section 3), and that remains “up,” so we’ll stay invested until that fact changes.

Read More