Gold Shines As Major Indexes Falter; Bitcoin Slips To $81K

Ulli Market Commentary Contact

[Chart courtesy of MarketWatch.com]

  1. Moving the market

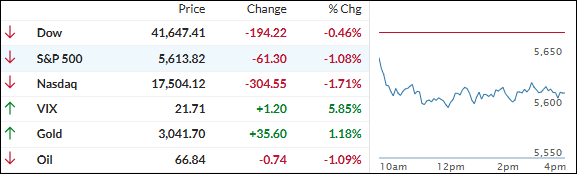
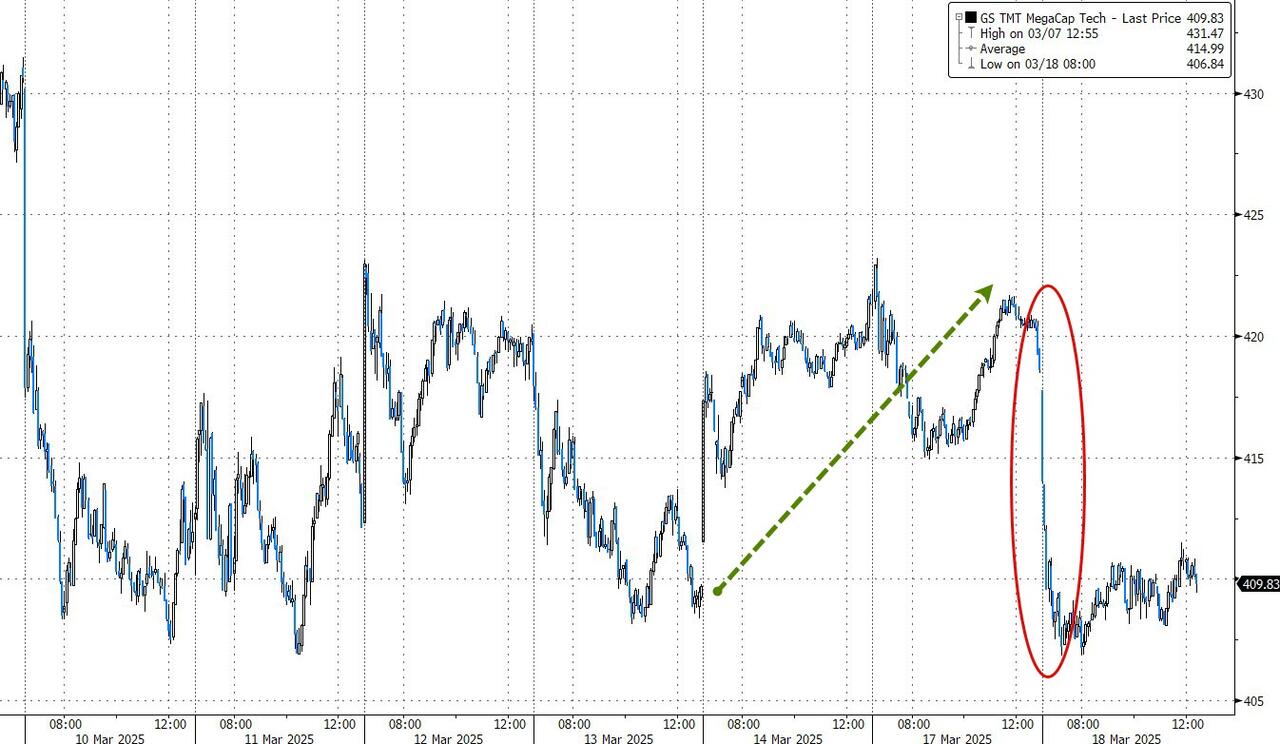
The two-day comeback rally hit a brick wall today, with the major indexes retreating, led by the Nasdaq.

Tesla was one of the hardest-hit stocks, falling over 5% after an analyst lowered its price target due to rising competition in the EV space. The company’s stock has declined about 36% over the past month.

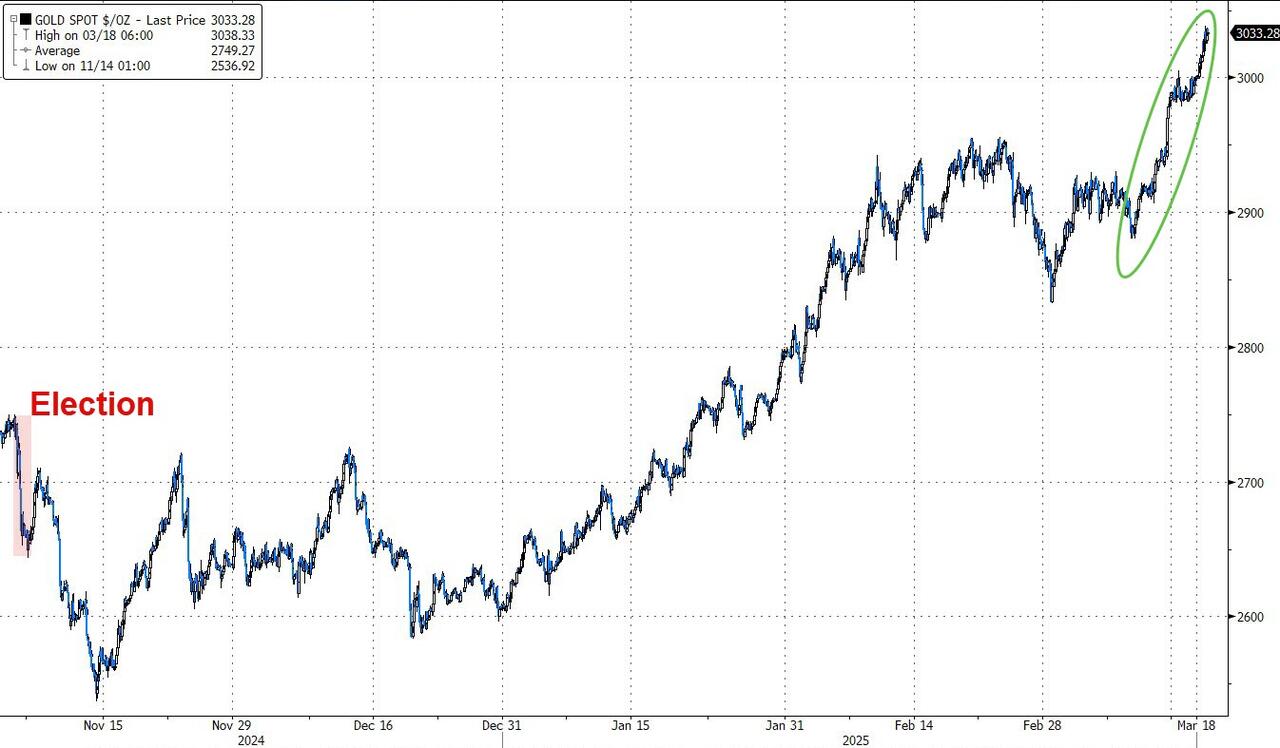
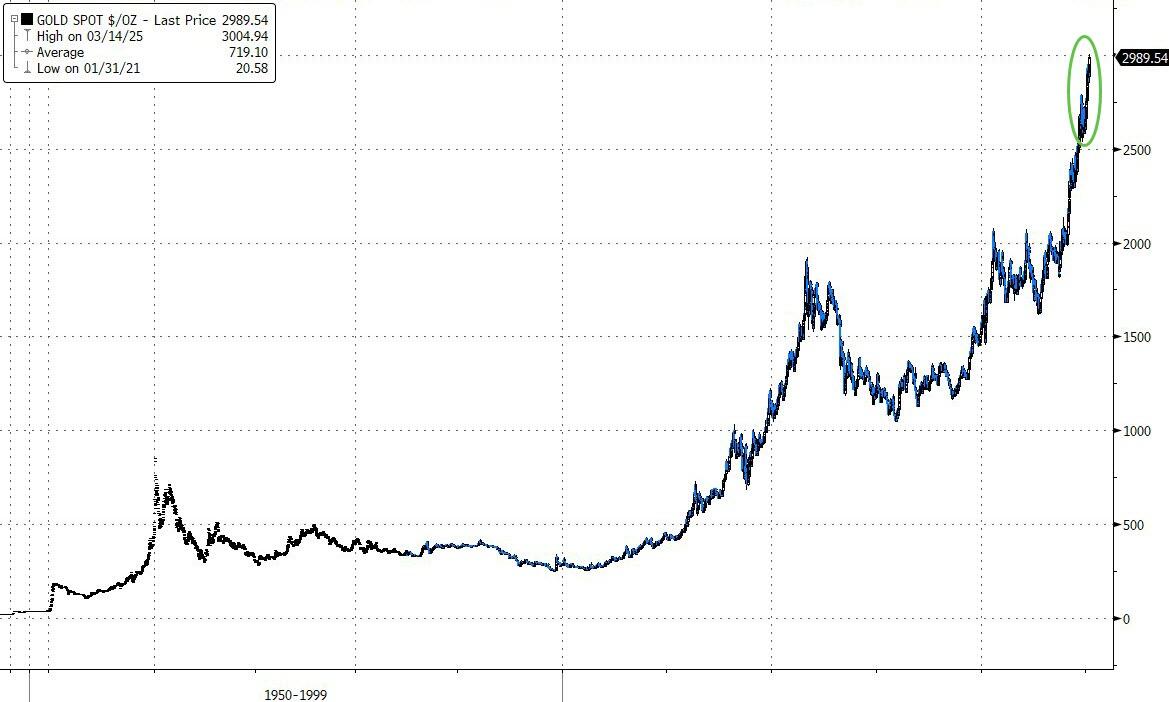
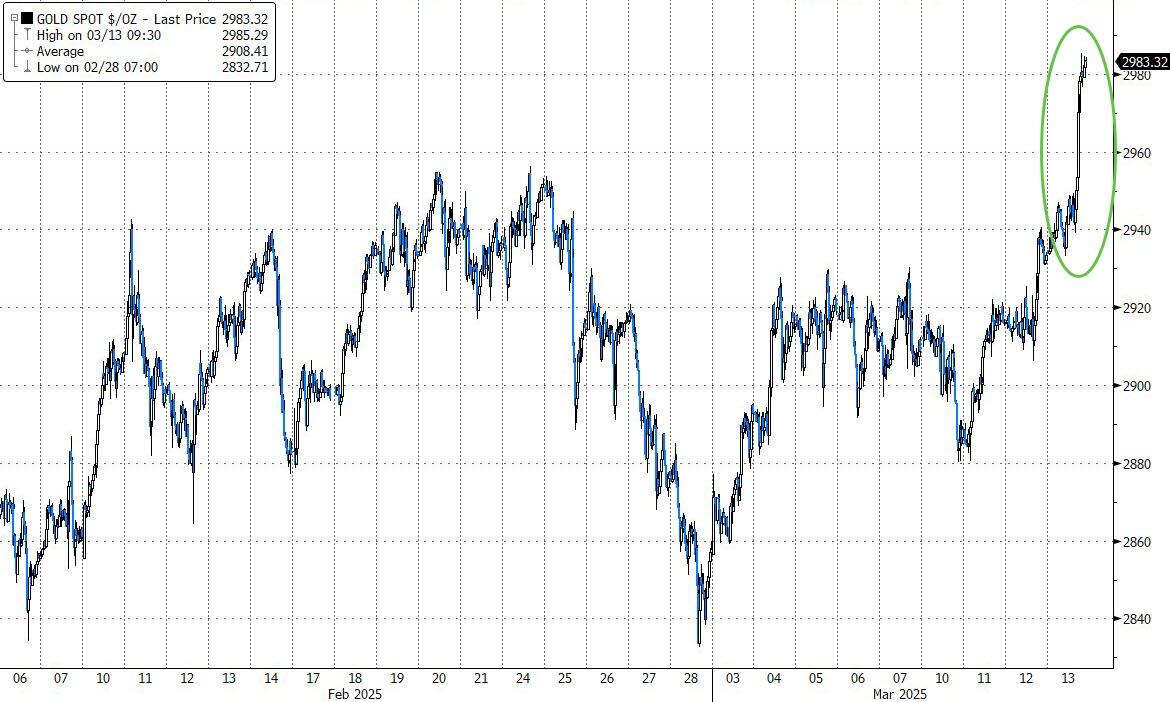
The S&P 500 officially entered correction territory last week, dropping 10% from its recent high. It now sits on the cusp of either breaking out to the upside or breaking down further. The three major indexes are down year-to-date and have been outperformed by gold, which has gained almost 15% over the same period.

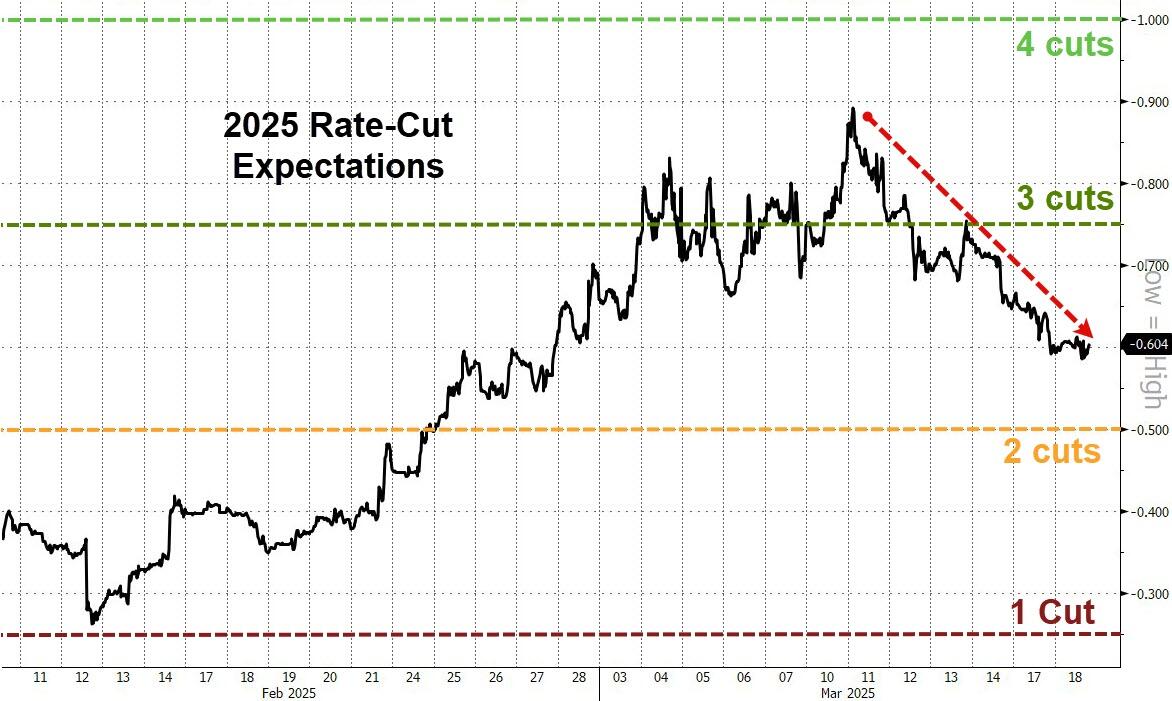
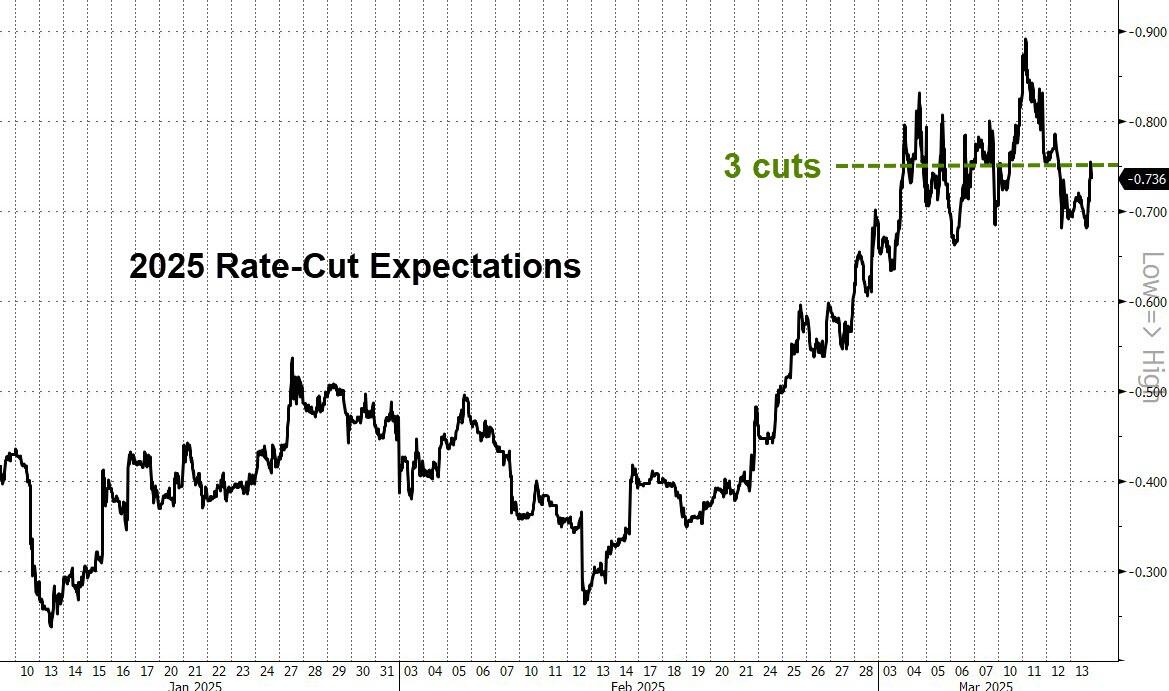
Traders are anxiously observing the Fed’s two-day policy meeting, which concludes tomorrow afternoon with a press conference. Current odds are 99% that the central bank will hold rates steady, despite wishful thinking on Wall Street that the recent “growth scare” might sway the Fed to lower rates.

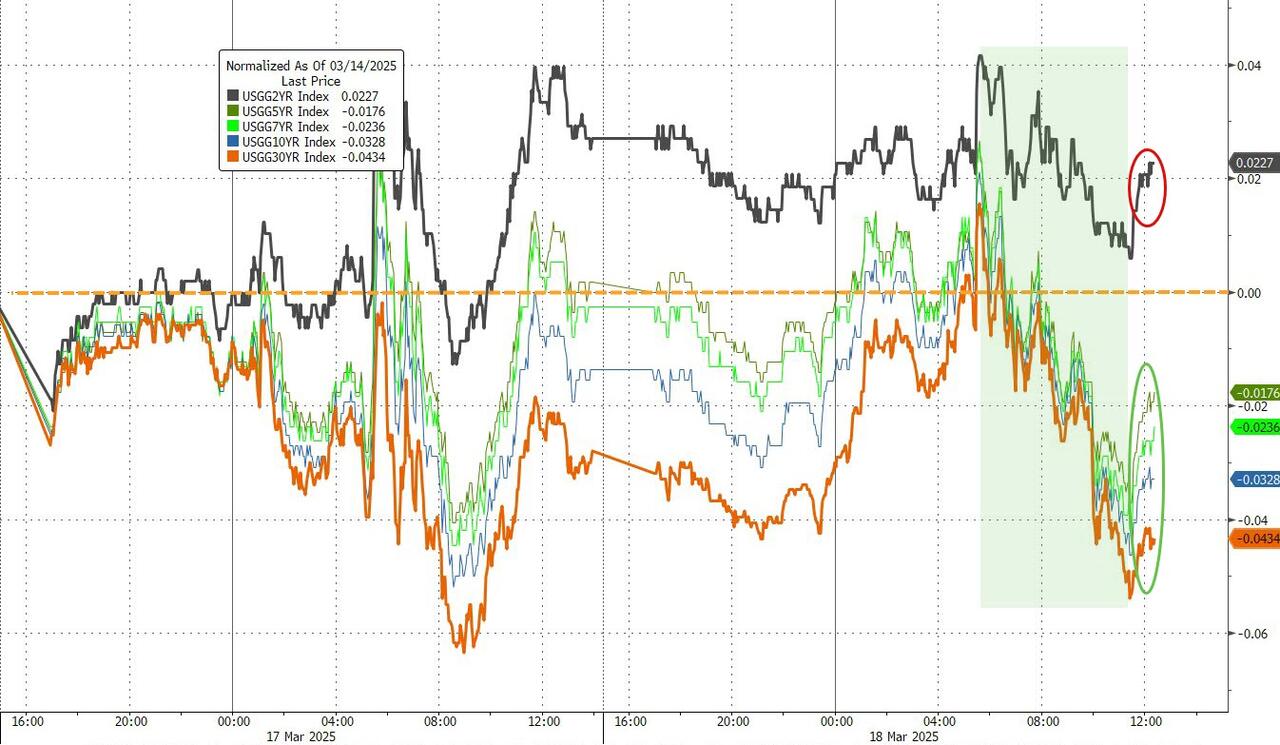
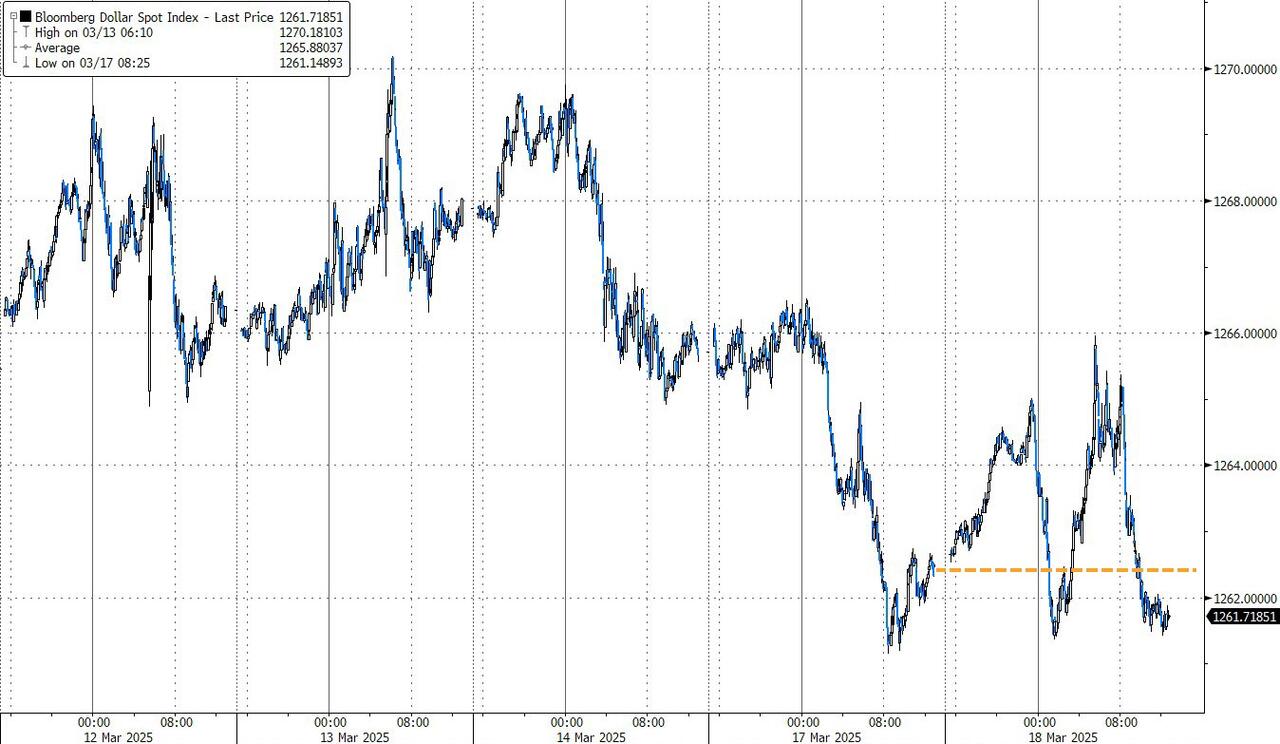
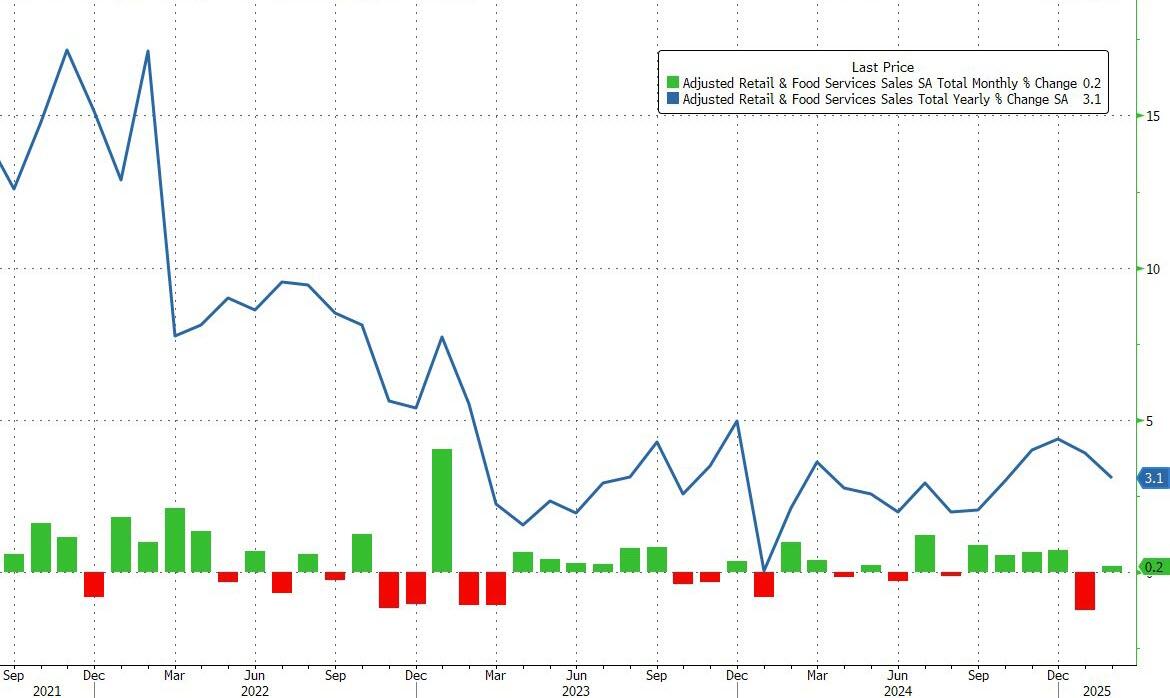
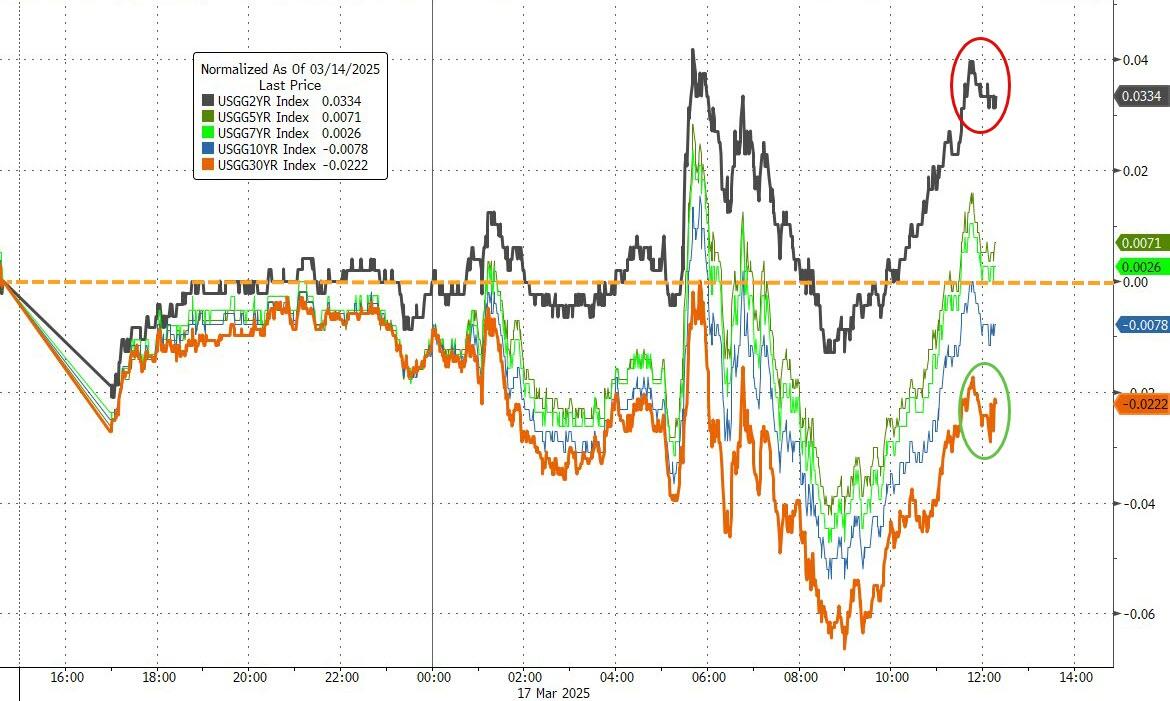
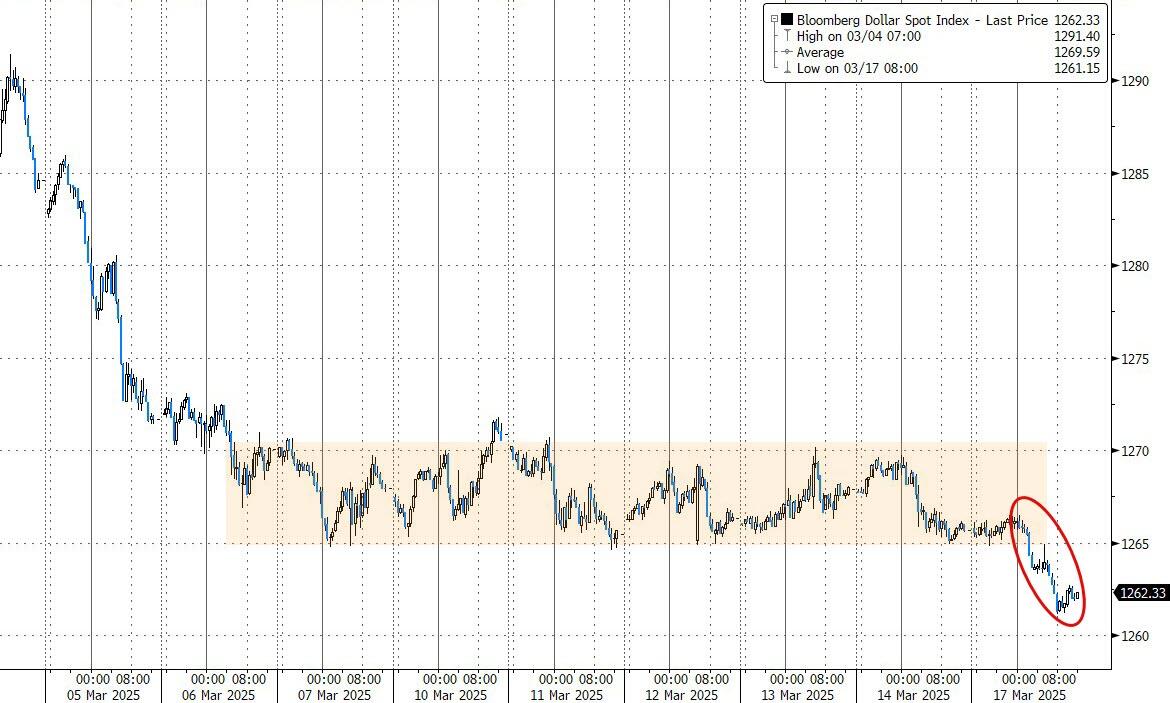
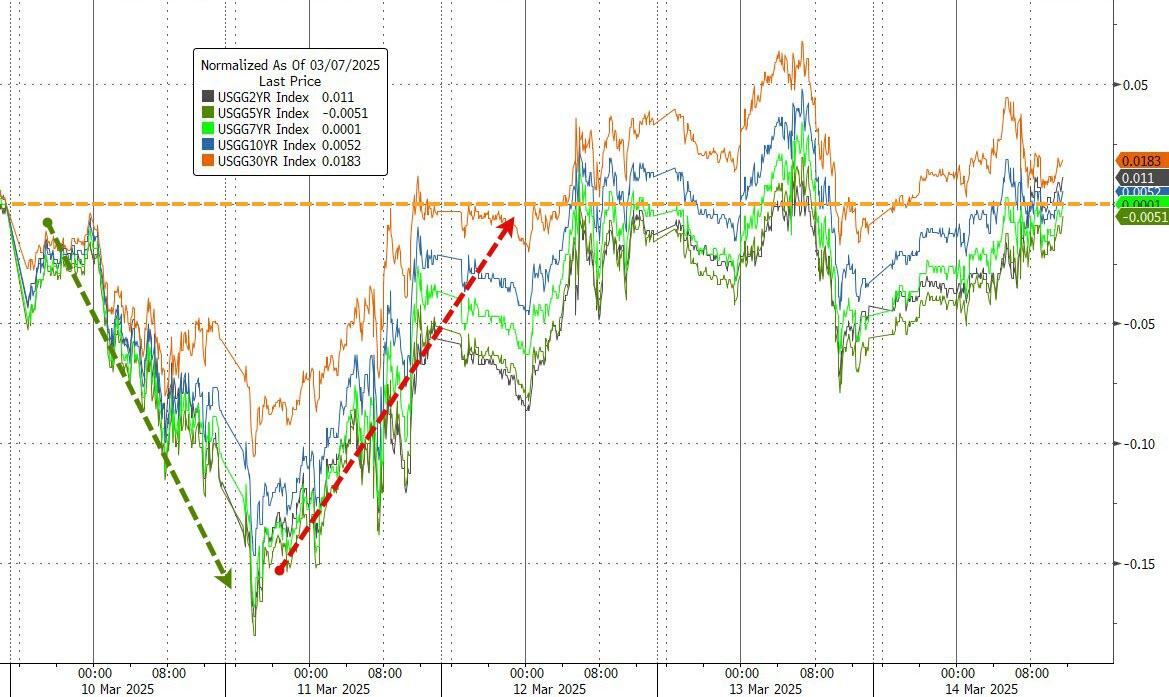
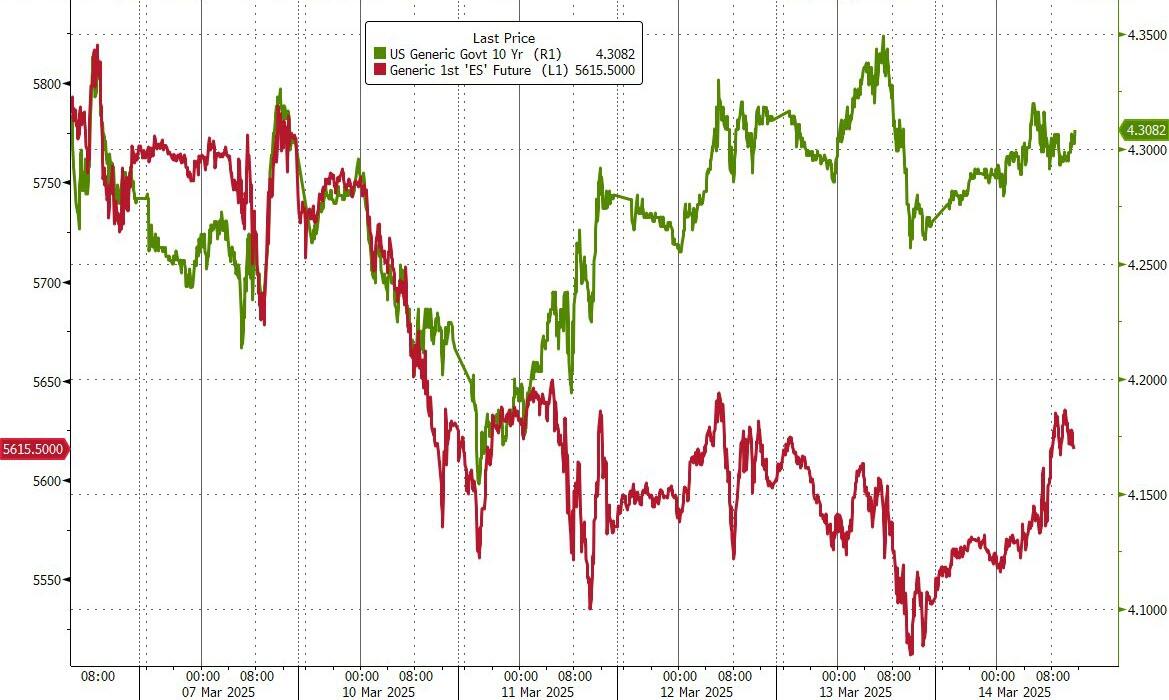
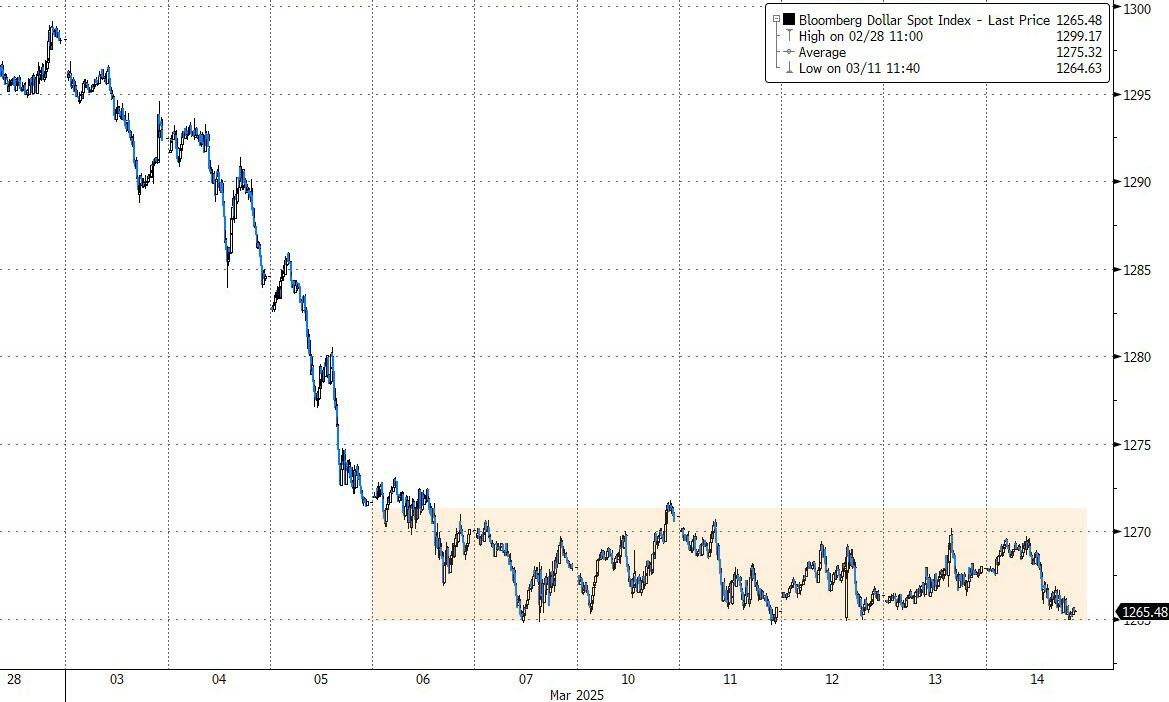
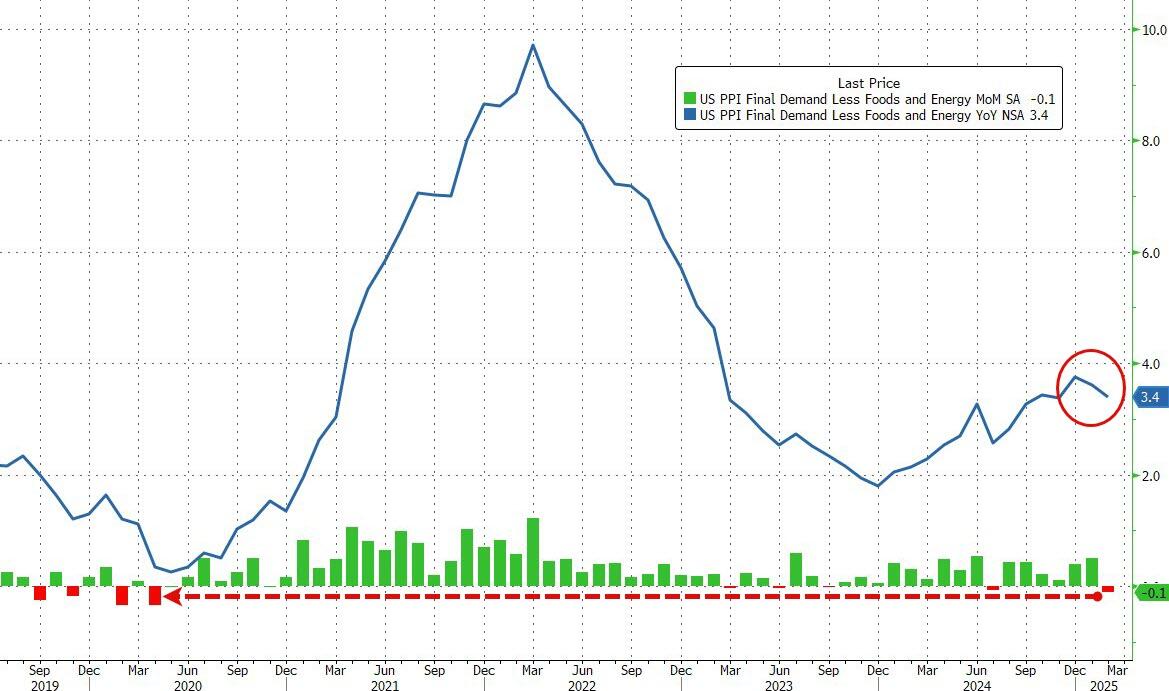
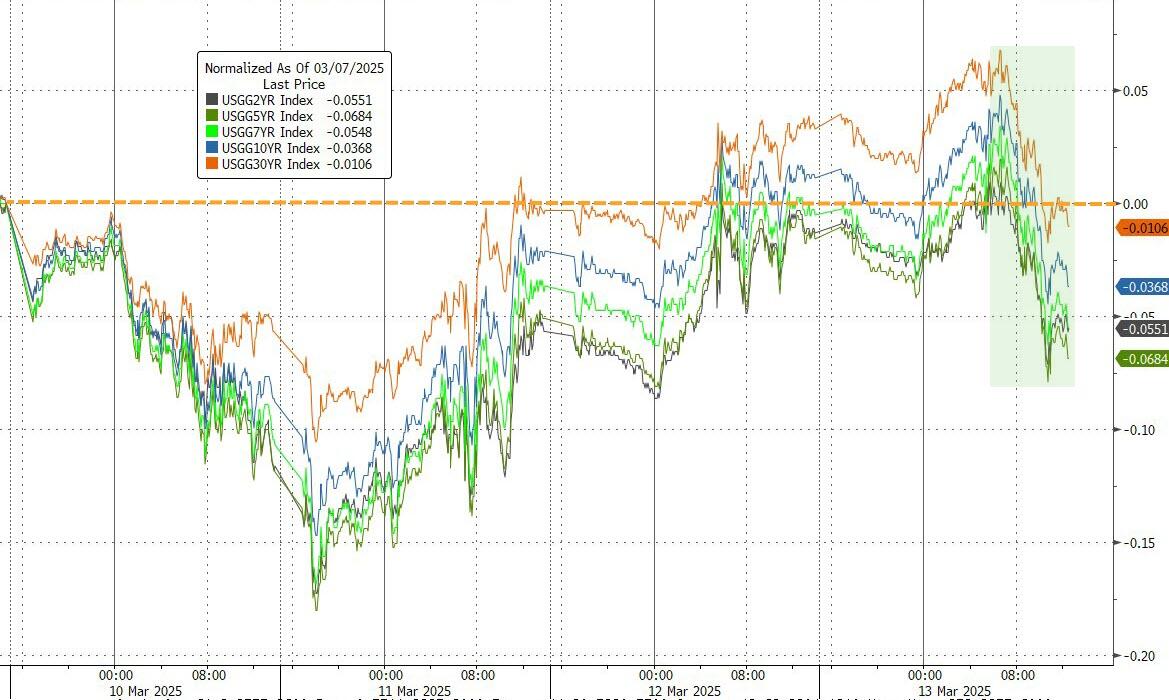
Offsetting that scare somewhat were positive housing starts and record-high industrial production, though rising import prices have dampened expectations for a rate cut. Big tech stocks took a dive today, bond yields were mixed, and the dollar swung wildly before ending only modestly lower.

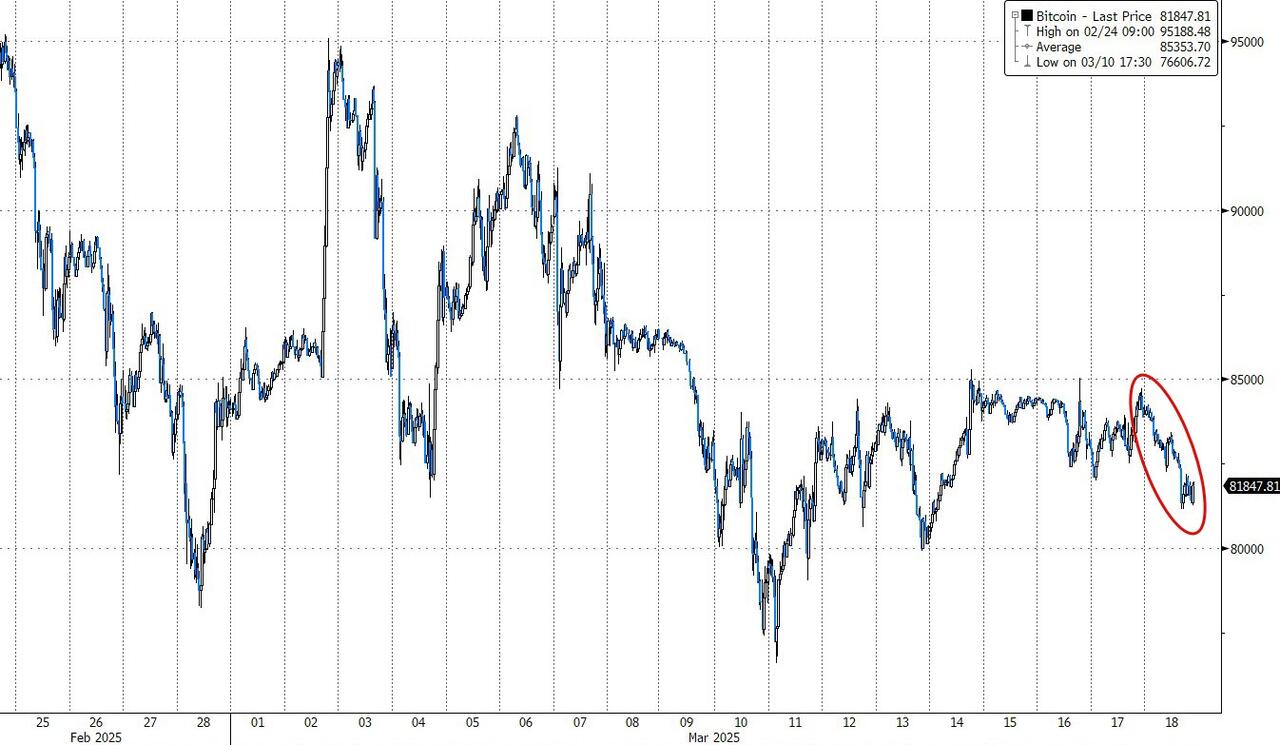
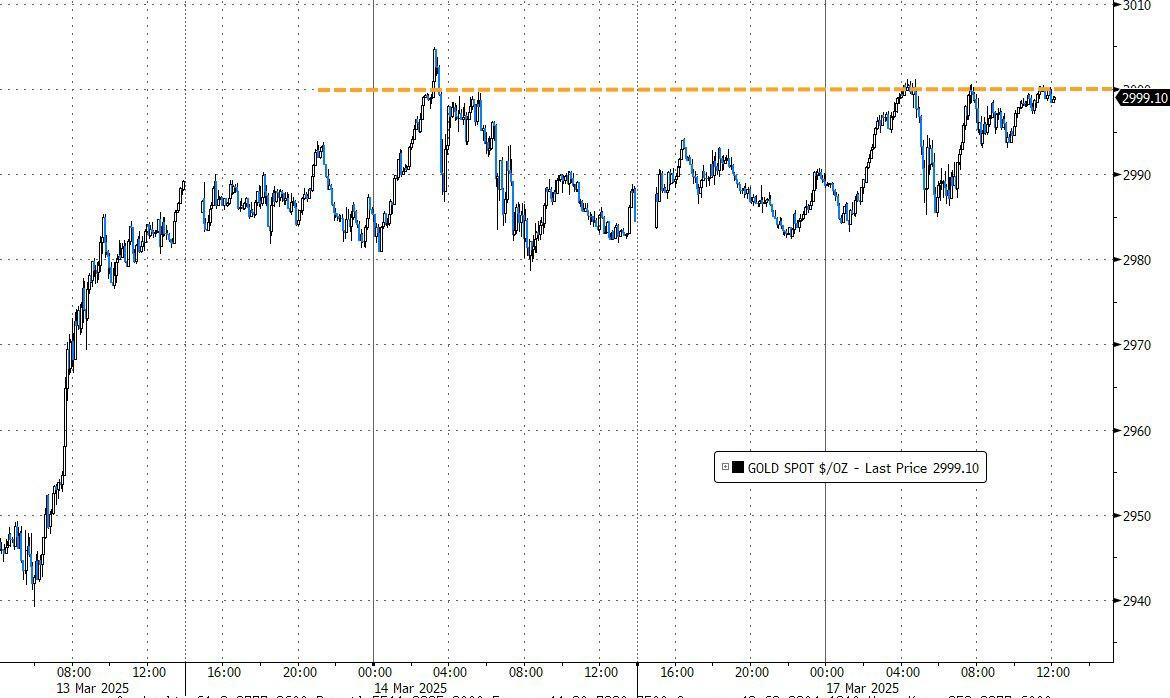
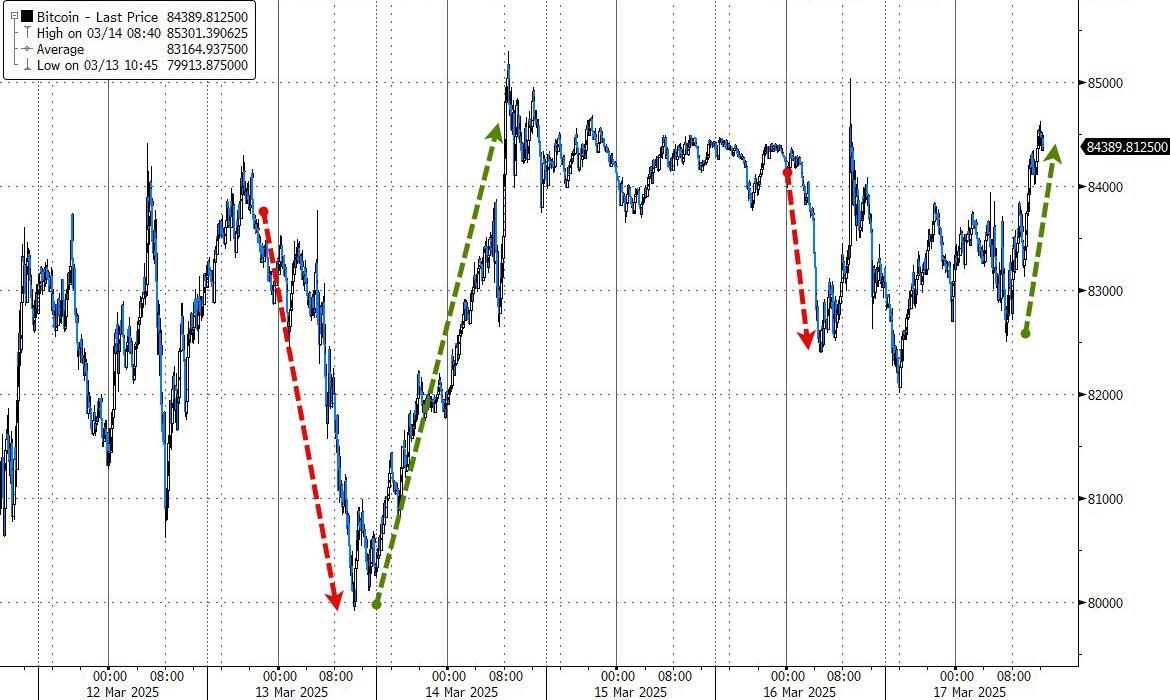
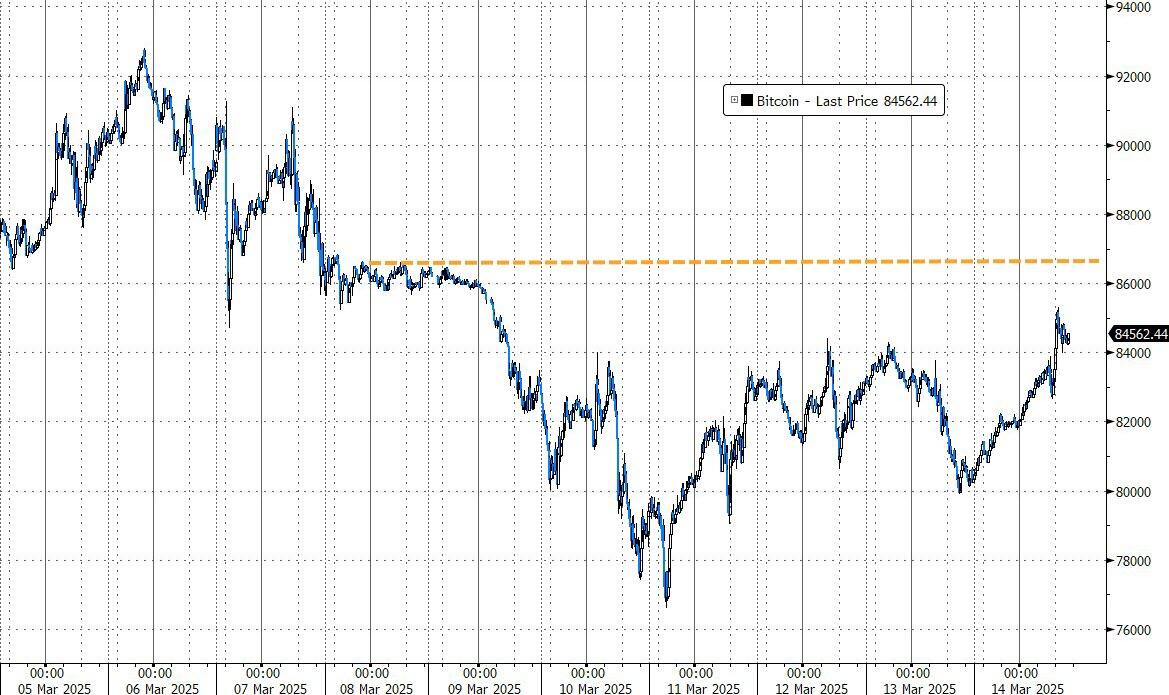
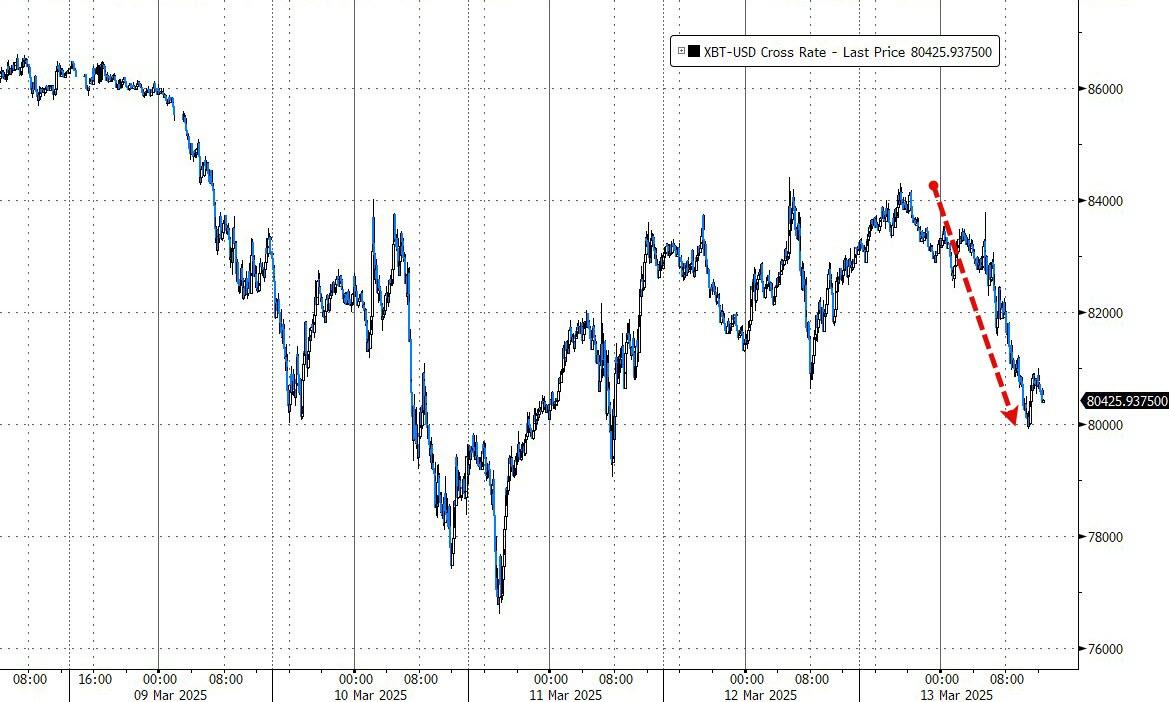
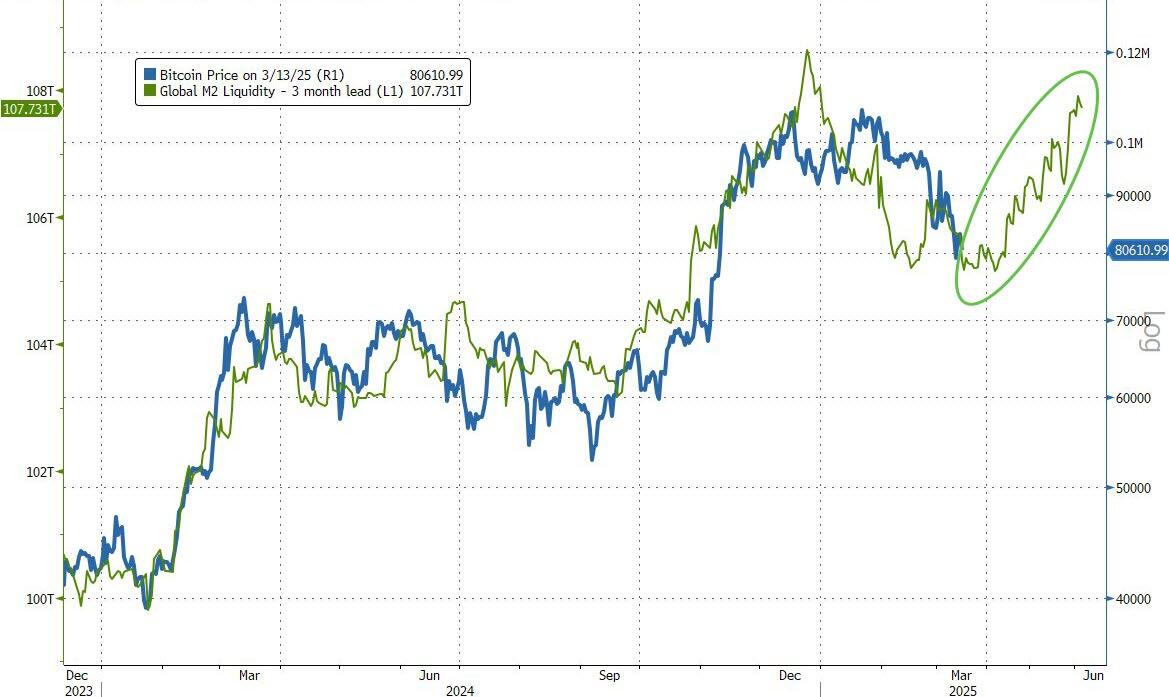
Gold continued its strong performance, advancing deeper into the $3,000 territory, while Bitcoin lost its footing and fell back to the $81,000 level.

All eyes are now on the Fed’s announcement on interest rates tomorrow, but traders will be closely analyzing Fed Chair Powell’s commentary to determine if we are facing a “risk on” or “risk off” scenario moving forward.

Read More

Equities Rebound As Major Indexes Build On Friday’s Recovery

Ulli Market Commentary Contact

[Chart courtesy of MarketWatch.com]

  1. Moving the market

Equities rose early in the session as major indexes attempted to build on Friday’s recovery from correction territory. The latest retail sales report showed a 0.2% increase for February, which, although below the estimated 0.6% rise, relieved traders as the outcome was not worse.

Last Thursday, the S&P 500 entered correction territory, dropping more than 10% from its February high. Dip buyers stepped in on Friday, driving the index 2% higher and helping us delay our “Sell” signal.

Despite this, anxiety persists as traders struggle to keep up with Trump’s rapidly changing tariff policies and the cost-cutting efforts of the DOGE department, which impact the economy and corporate and consumer confidence.

The biggest 2-day short squeeze since last July helped stocks stay on an upward path, despite mixed bond yields. Gold bounced against its $3,000 overhead ceiling and managed to close above it, while the dollar broke below its recent trading range.

Bitcoin exhibited its usual volatility over the weekend, first falling to $82k before rebounding to nearly $85k.

Our domestic Trend Tracking Index (TTI) surged during the past two sessions, recovering almost all losses from the recent sell-off. See section 3 for more details.

Read More

ETFs On The Cutline – Updated Through 03/14/2025

Ulli ETFs on the Cutline Contact

Do you want to know which ETFs are hot and which ones are not? Then you need my High-Volume ETF Cutline report. It tells you how close or far each of the 311 ETFs I follow is from its long-term trend line (39-week SMA). These are the ETFs that trade more than $5 million a day, so they are not some obscure funds that nobody cares about.

The report is split into two parts: The winners that are above their trend line (%M/A), and the losers that are below it. The yellow line is the line of shame that separates them. You can see how many ETFs are in each group and how they have changed since the last report (162 vs. 115 current).

Take a peek:

The HV ETF Master Cutline Report

If you are confused by some of the terms we use, don’t panic. I have a helpful Glossary of Terms for you.

If you want to learn more about the Cutline method and how it can make you rich (or at least less poor), read my original post here.

ETF Tracker Newsletter For March 14, 2025

Ulli ETF Tracker Contact

ETF Tracker StatSheet          

You can view the latest version here.

GOLD TOPS $3,000 AS MAJOR INDEXES SURGE DESPITE WEAK CONSUMER SENTIMENT

[Chart courtesy of MarketWatch.com]

  1. Moving the market

After falling into correction territory, the S&P 500 and other major indexes bounced back solidly this morning.

Yesterday, I announced a “domestic Sell signal” but added that if there was a sharp rebound today, I would hold off for another day; otherwise, the “Sell” signal would be executed. As it turned out, bullish sentiment prevailed throughout the session, invalidating my signal.

Boosting the mood on Wall Street was the apparent avoidance of a government shutdown, as Chuck Schumer (D) stated he would not block a Republican government funding bill.

Despite this, the major indexes have rapidly moved from record highs to correction territory, with the S&P 500 achieving this in about three weeks. Tariff wars, consumer confidence, and economic growth concerns have been the main contributors to Wall Street’s weakness.

However, today, none of that mattered as the major indexes powered higher, coinciding with the end of the seasonally weakest period of the year and the day gold topped $3,000 for the first time. Traders also shrugged off weaker consumer sentiment.

Although volume was light and the major indexes still ended lower for the week, this could have been just a one-day outlier in a bearish trend that may gain more momentum.

Bond yields remained unchanged for the week, as stocks and bonds decoupled, and the dollar slipped to the low end of its trading range.

Bitcoin also dropped but found strong support at the $80k level and is poised to benefit from increased global liquidity.

I am pondering whether today’s rebound marks the beginning of a new trend, or was it just a temporary blip?

Read More

Weekly StatSheet For The ETF Tracker Newsletter – Updated Through 03/13/2025

Ulli ETF StatSheet Contact

ETF Data updated through Thursday, March 13, 2025

How to use this StatSheet:

  1. Out of the 1,800+ ETFs out there, I only pick the ones that trade over $5 million per day (HV ETFs), so you don’t get stuck with a lemon that nobody wants to buy or sell.
  1. Trend Tracking Indexes (TTIs)

These are the main indicators that tell you when to buy or sell Domestic and International ETFs (section 1 and 2). They do that by comparing their position to their long-term M/A (Moving Average). If they cross above, and stay there, it’s a green light to buy. If they fall below, and keep going, it’s a red light to sell. And to make sure you don’t lose your shirt if things go south, I also use a 12% trailing stop loss on all positions in these categories.

  1. All other investment areas don’t have a TTI and should be traded based on the position of each ETF relative to its own trend line (%M/A). That’s why I call them “Selective Buy.” In other words, if an ETF goes above its own trend line, you can buy it. But don’t forget to use a trailing sell stop of 12%, or less if you’re feeling nervous.

If some of these words sound like Greek to you, please check out the Glossary of Terms and new subscriber information in section 9.

  1. DOMESTIC EQUITY ETFs: BUY— since 11/21/2023

Click on chart to enlarge

This is our main compass, the Domestic Trend Tracking Index (TTI-green line in the above chart). It has broken below its long-term trend line (red) by -3.34% and will change to “Sell” mode likely tomorrow.

Read More

Equities Slide As Tariff Wars Intensify—Domestic Sell Signal Generated

Ulli Market Commentary Contact

[Chart courtesy of MarketWatch.com]

  1. Moving the market

Equities began the session slightly below their respective unchanged lines but accelerated to the downside late in the day, as market volatility continued. Traders focused on the latest tariff threats, with 200% import duties on all alcoholic products from EU countries in retaliation for the bloc’s 50% tariff on whiskey.

The Producer Price Index (PPI) was encouraging, showing its largest decline since April 2020, contrary to expectations of an increase. Combined with yesterday’s softer Consumer Price Index (CPI), traders’ concerns about the impact of tariffs have eased somewhat, but not enough to lift the major indexes out of their current slump.

The key question remains whether current import duties will have a greater impact on economic growth or prices. Traders generally believe that weaker growth is the overriding factor, leading to the pricing in of three rate cuts for 2025.

Despite the tariff-related struggles, the decline in equities this week has been gradual rather than a crash. This suggests that any easing of trade policy could lead to a sharp rebound, which is why I have been giving the TTI a bit more room to move.

However, as of today’s close, the domestic TTI has dropped 3.34% below its long-term trend line, signaling the end of the current “Buy” cycle that began on November 21, 2023.

Effective tomorrow, our “Sell” signal for broadly diversified domestic equity funds/ETFs will be in effect. In my advisory practice, I will liquidate our remaining domestic ETFs, which were well-hedged during the recent downturn, as our exposure to gold mitigated most of the equity drop.

If there is a sharp rebound tomorrow, I will hold off for another day; otherwise, the “Sell” signal will be executed.

Bond yields dipped slightly, but the overall uncertainty benefited gold, pushing the precious metal close to the $3,000 mark. Bitcoin, on the other hand, fell back towards $80,000, nearing a point that could signal a bullish move.

As ZH noted, global liquidity will lift many boats.

Read More