Equities Surge As Trump Signals Possible Tariff Delay

Ulli Market Commentary Contact

[Chart courtesy of MarketWatch.com]

  1. Moving the market

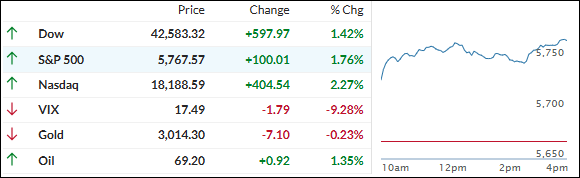
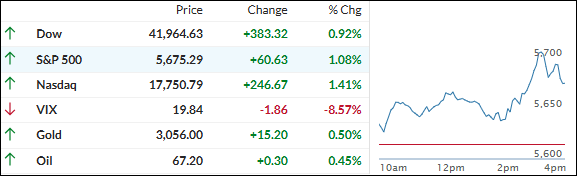
Equities surged after the opening bell as reports suggested that Trump might delay some of his broad tariff plans. Traders and algorithms quickly shifted to “Buy” mode, fueled by hopes that a global trade war could be averted.

Trump has indicated that tariffs target any country imposing duties on U.S. imports. However, the Wall Street Journal noted that the tariffs might be narrower in scope, focusing more on specific industries rather than broad impositions, with some nations potentially being excluded.

While Trump may show more flexibility in his approach, the situation remains fluid. For now, the effect on major indexes is positive and supportive. The markets also received a boost from Fed Chair Powell last week, who commented that any negative impacts from Trump’s tariffs would likely be short-lived.

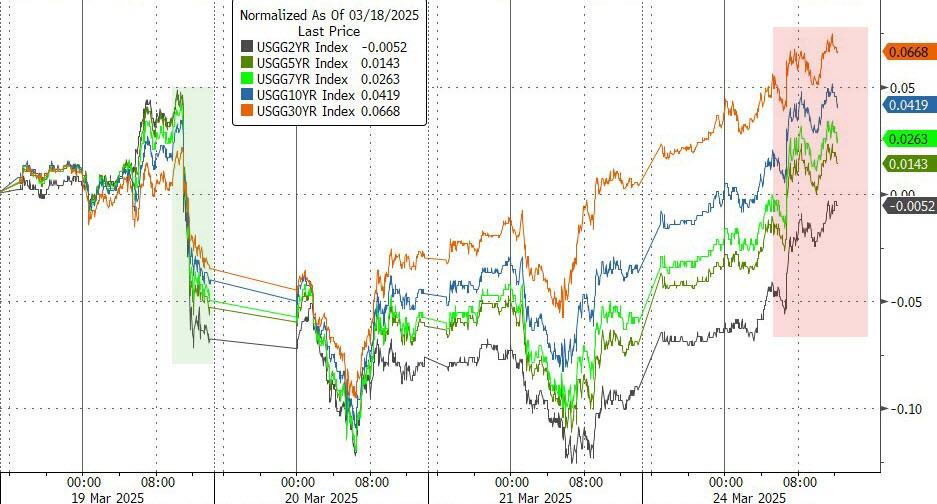
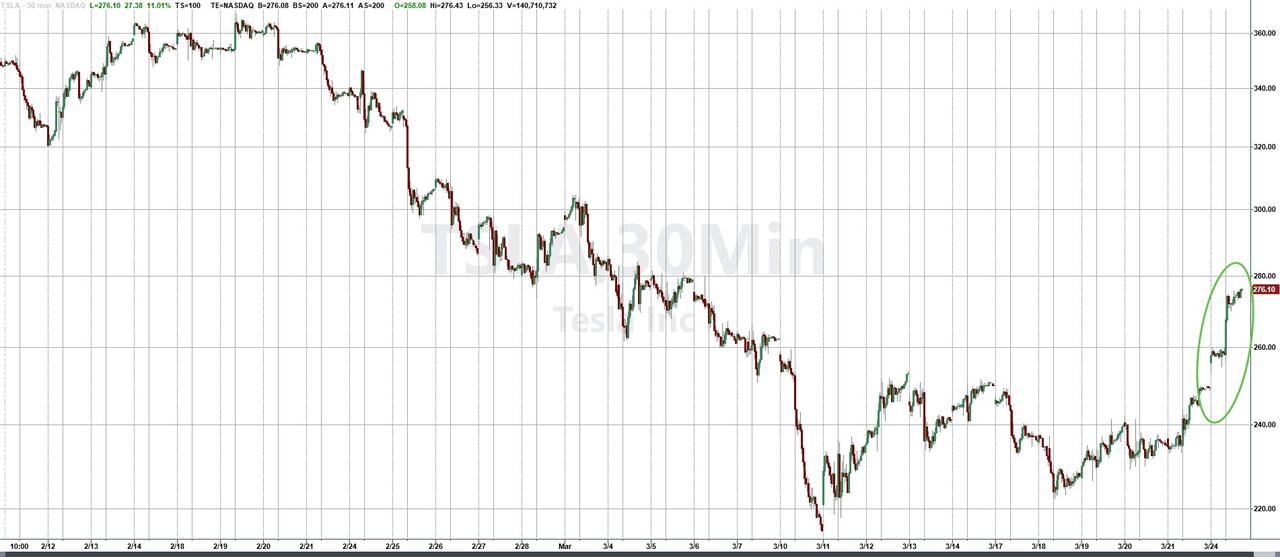
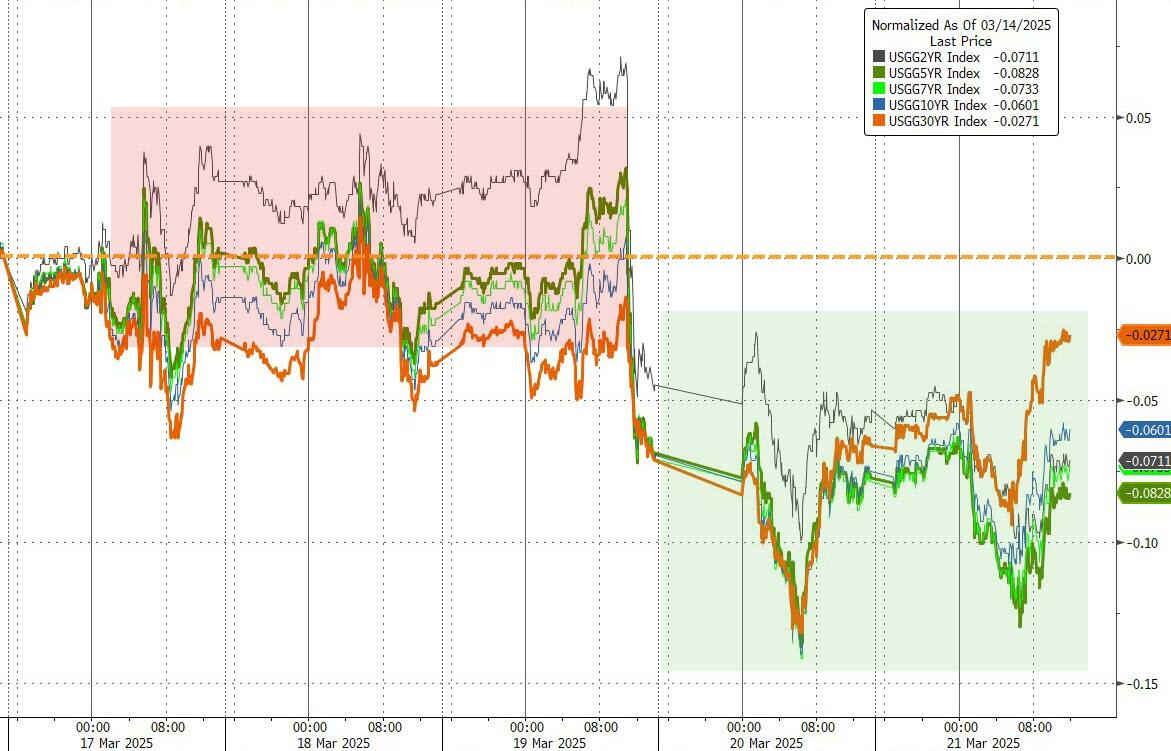
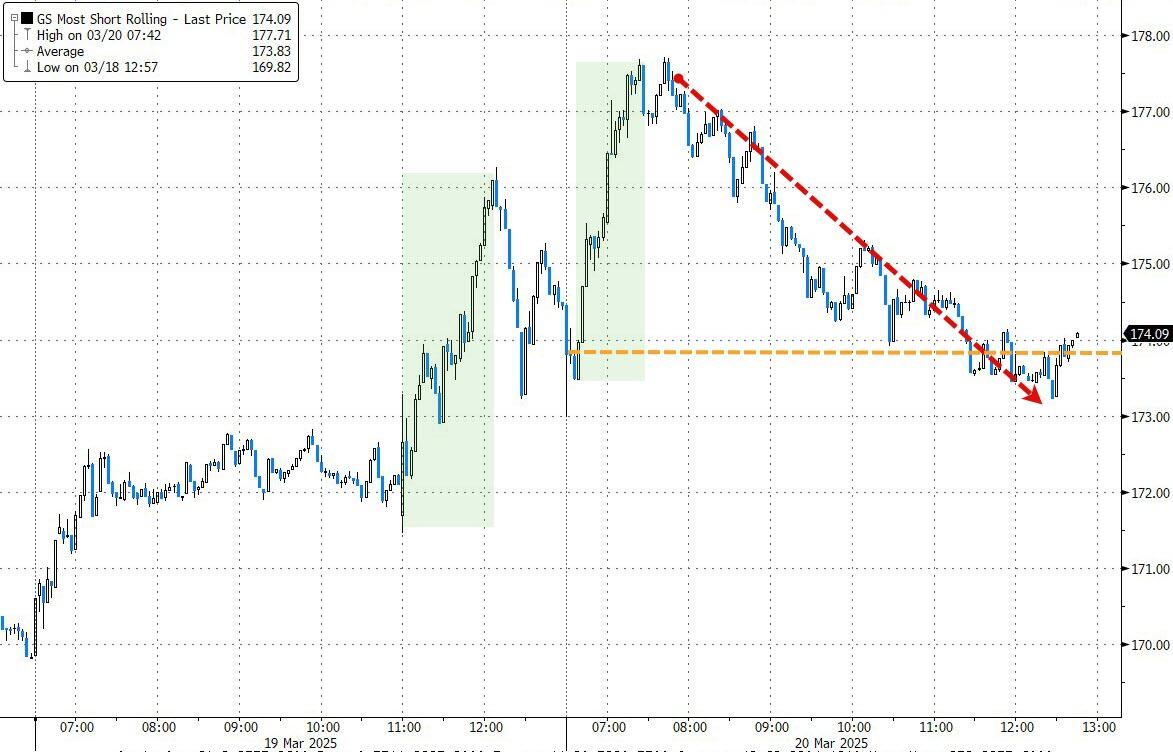
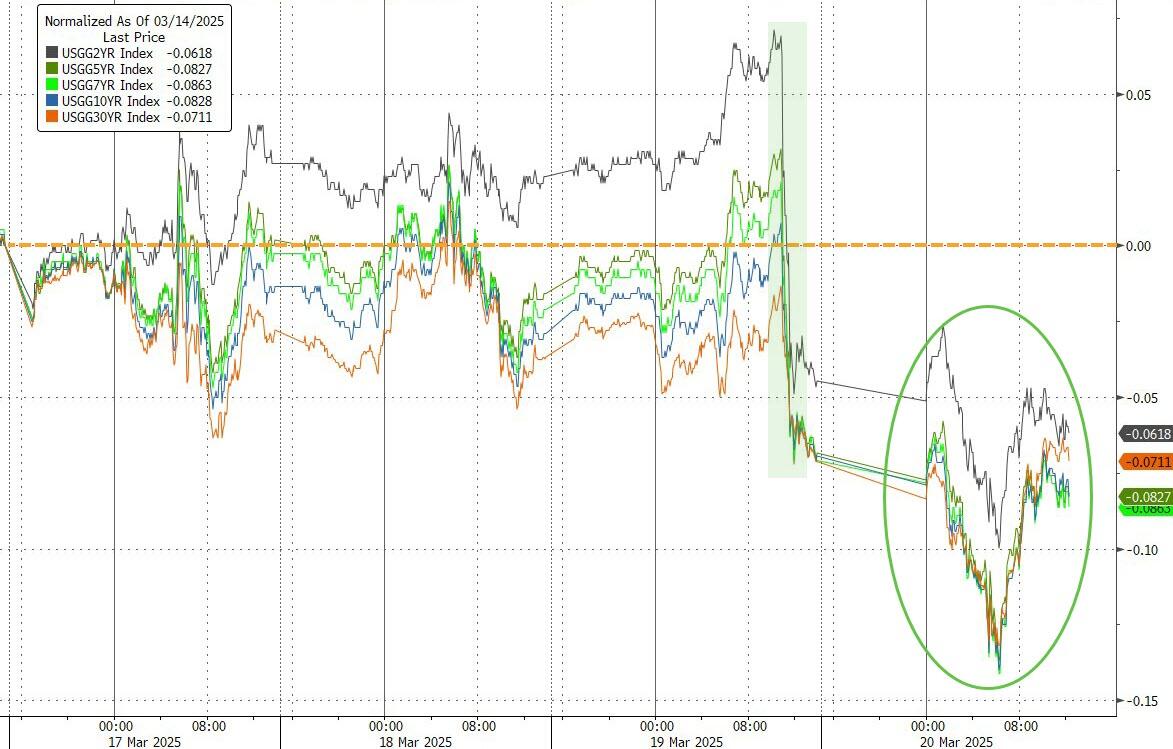
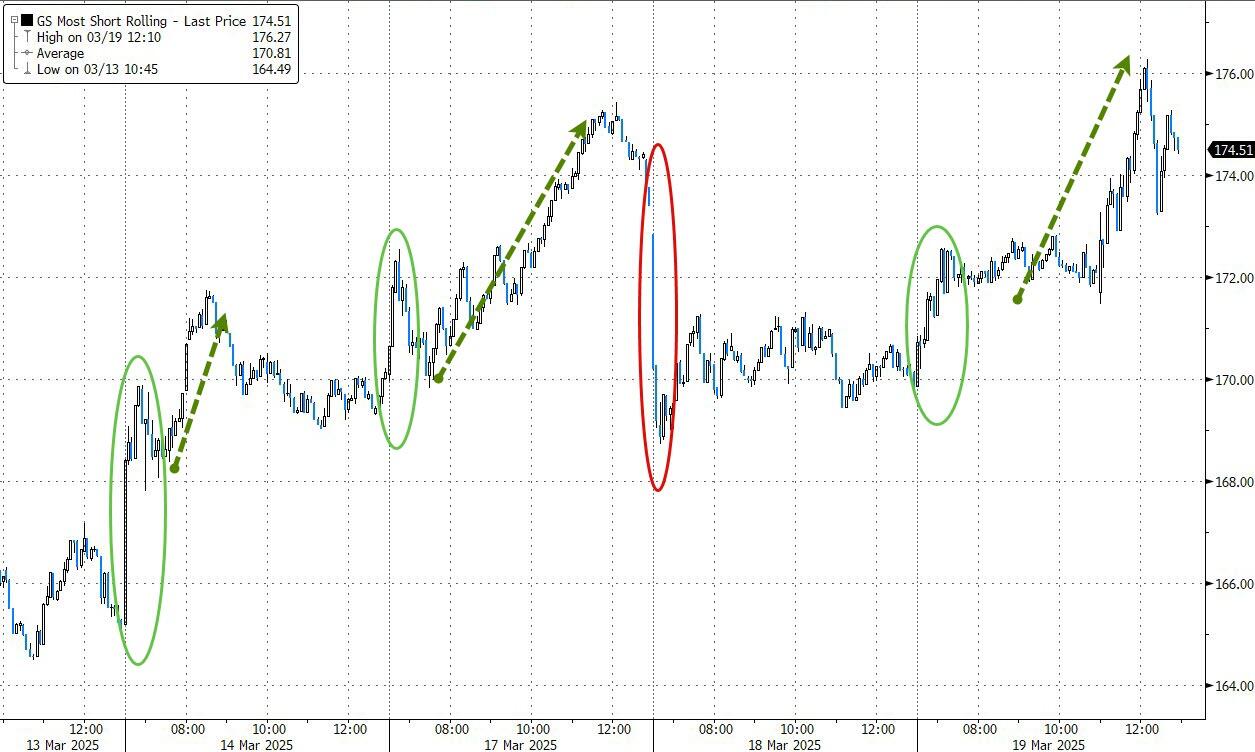
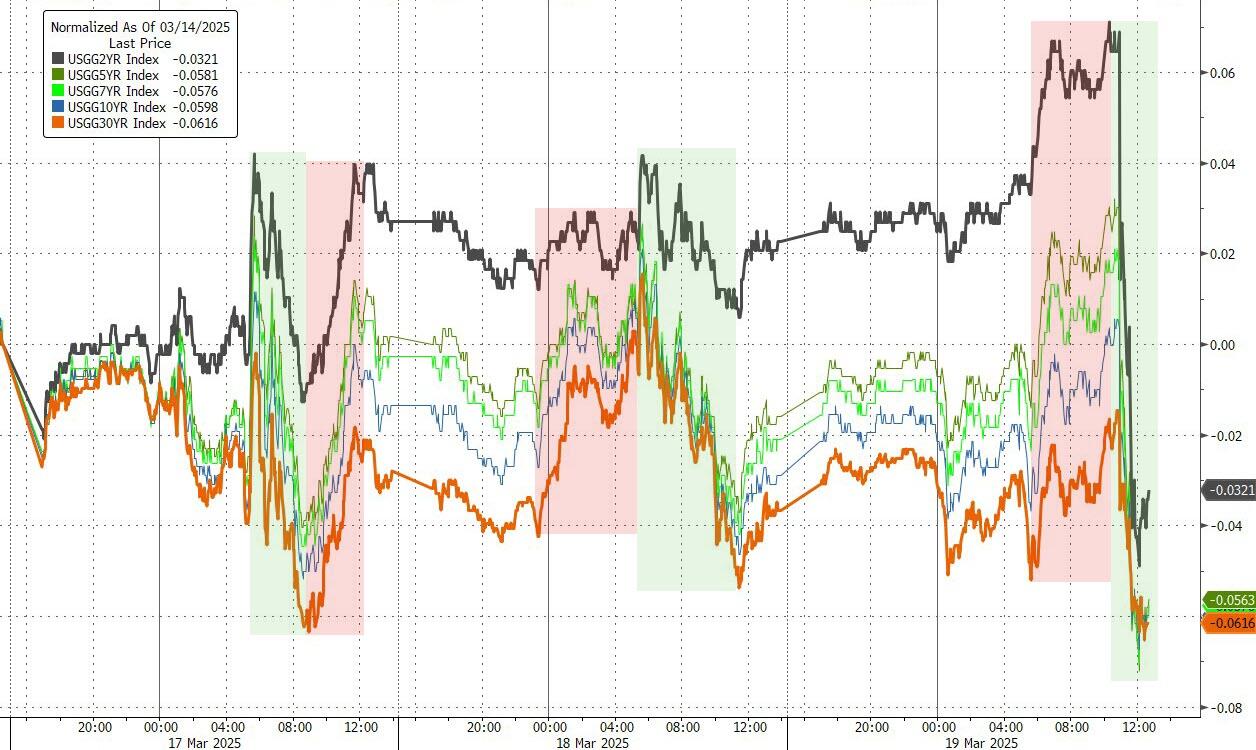
Despite mixed results from the Services and Manufacturing PMIs, bond yields rose, and the indexes closed at their session highs, driven by an explosive short squeeze. Tesla, which had been struggling, managed a 12% comeback following reports that the FBI launched a task force to investigate the terror attacks.

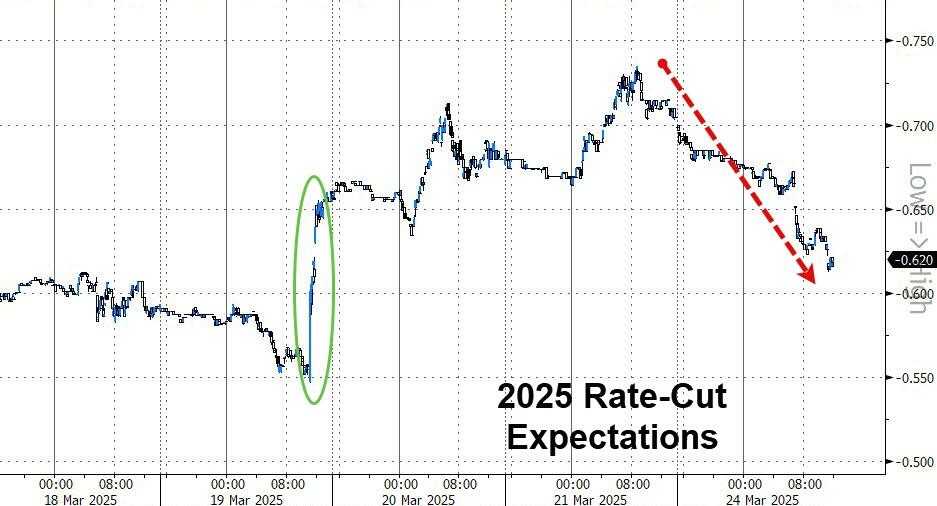
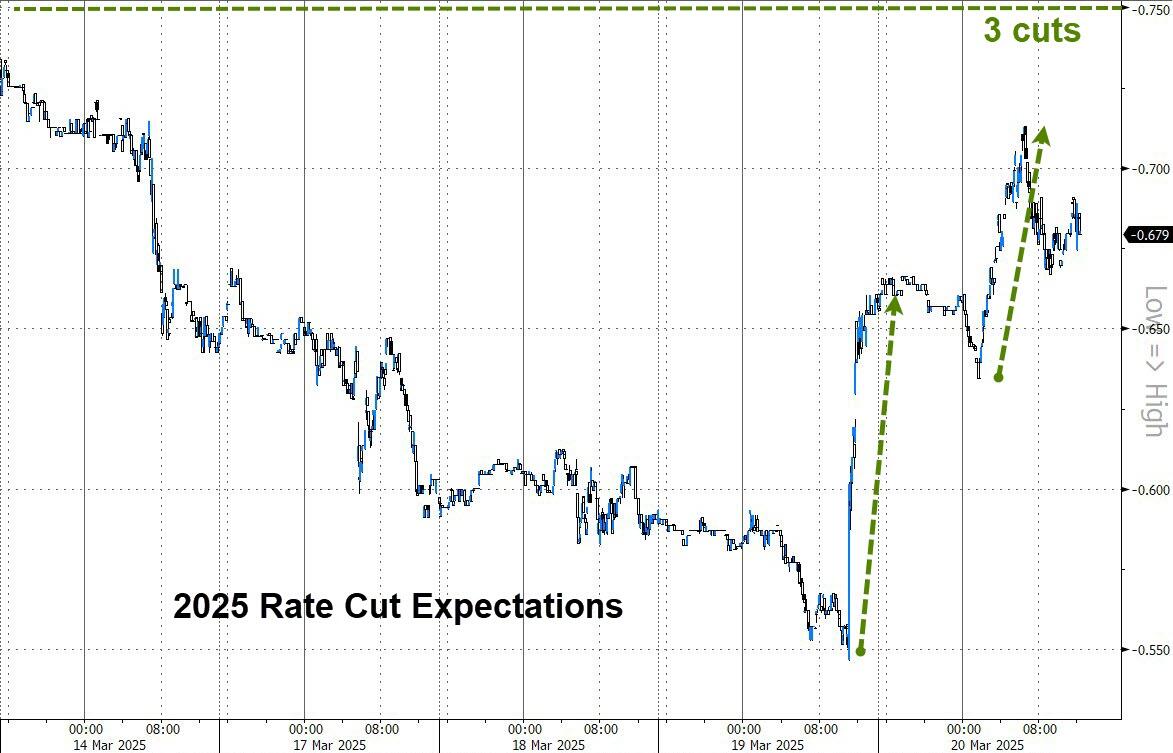
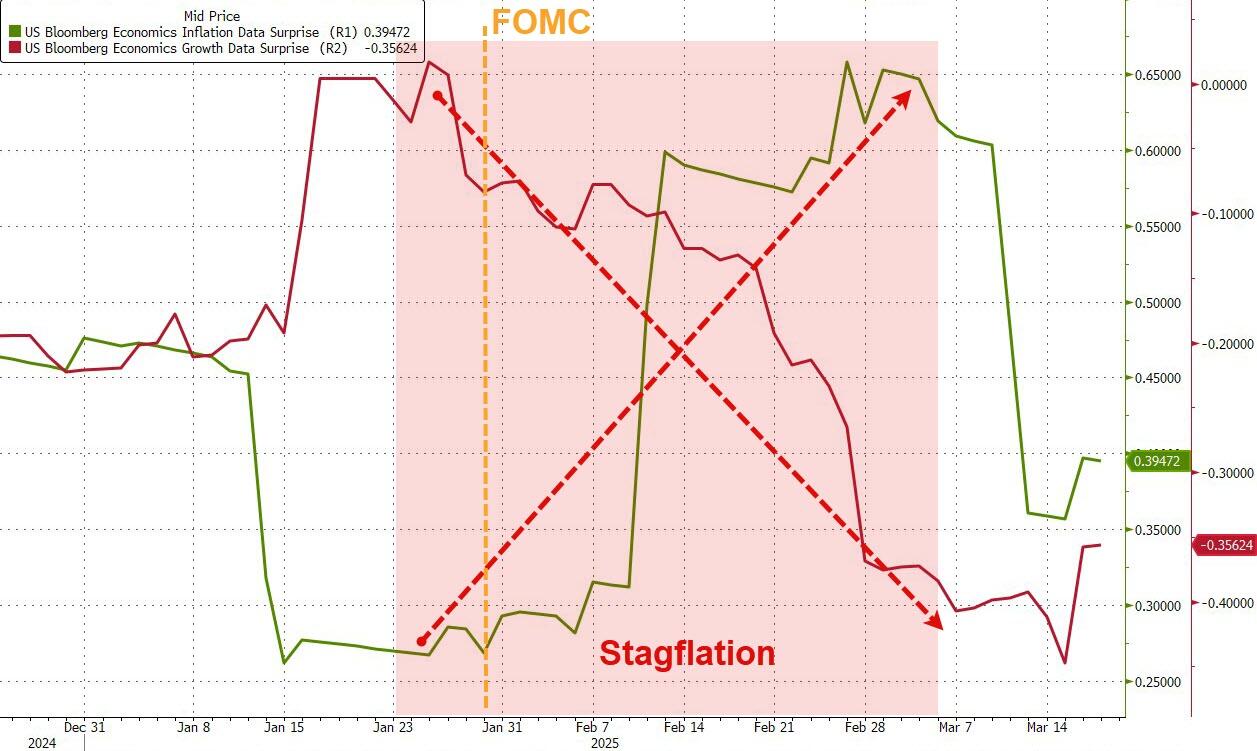
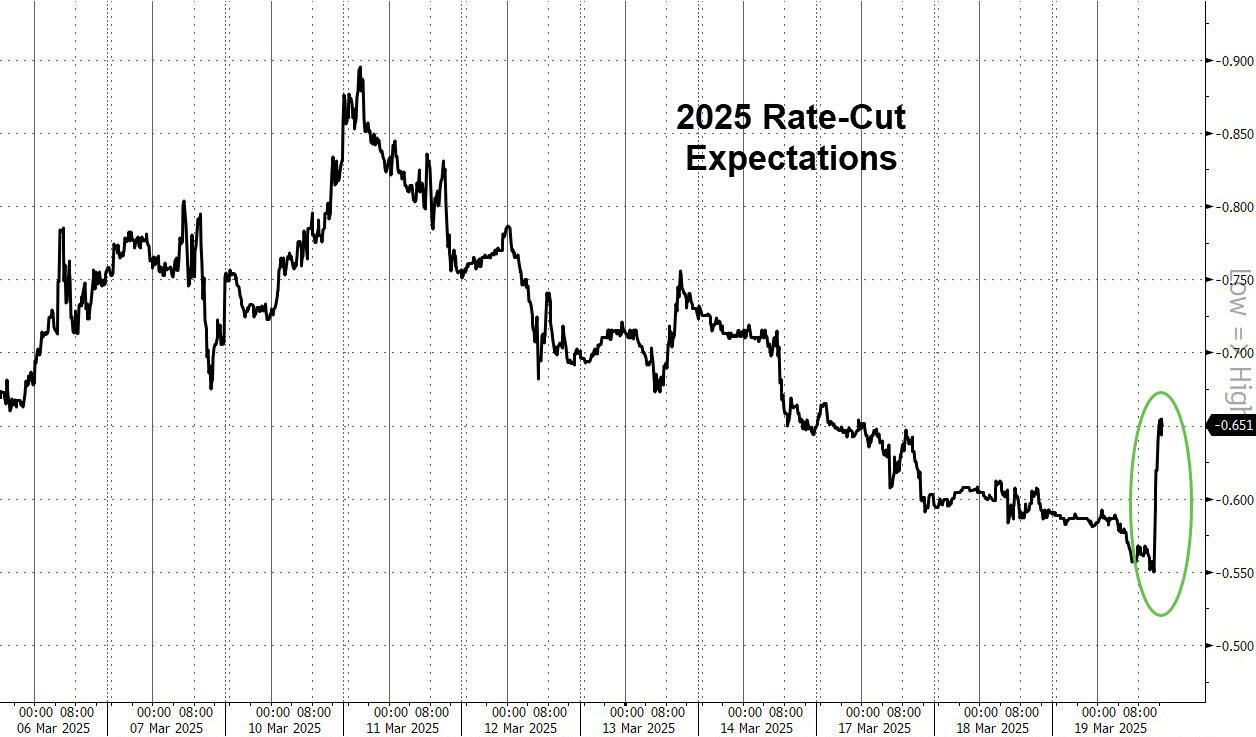
Atlanta Fed President Bostic stated that inflation would be bumpy and not move dramatically towards its 2% target, which reduced expectations for rate cuts.

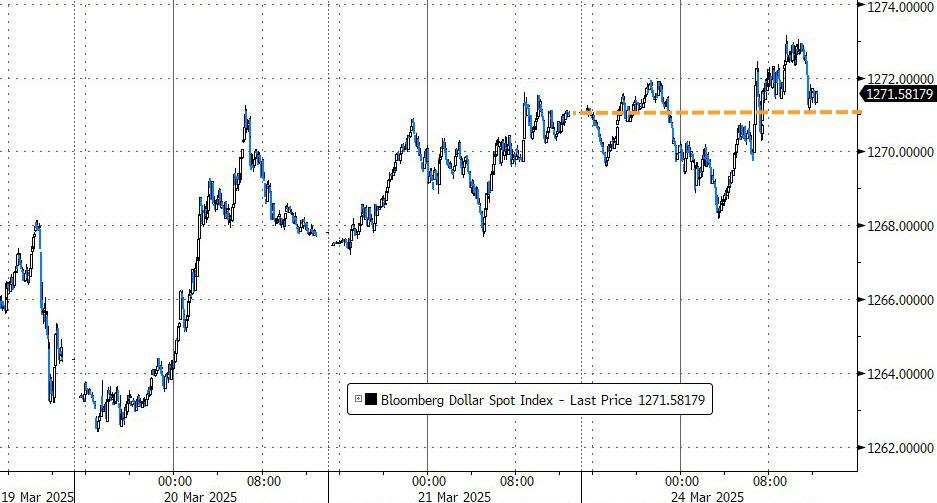
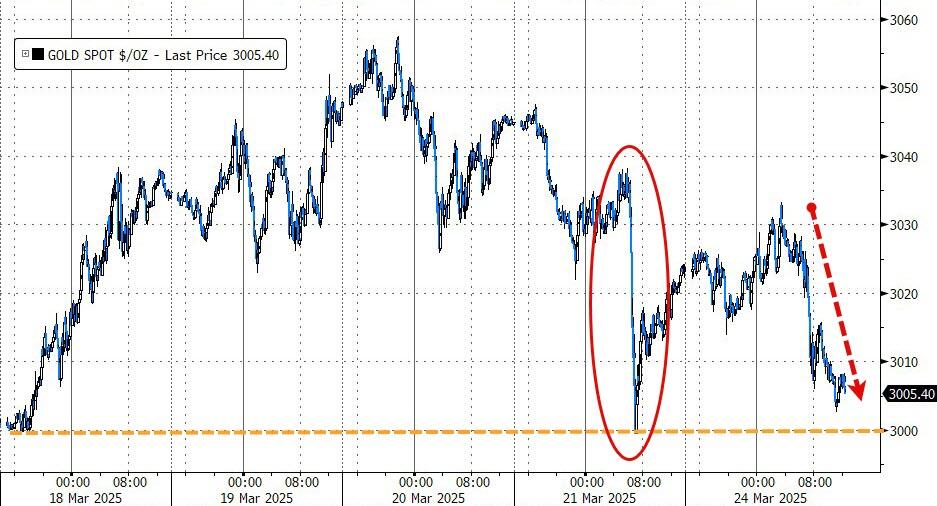
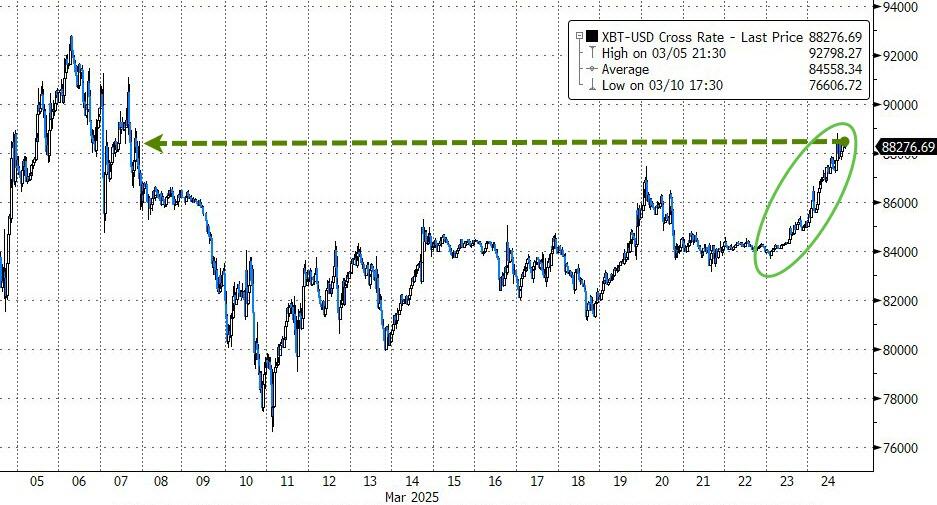
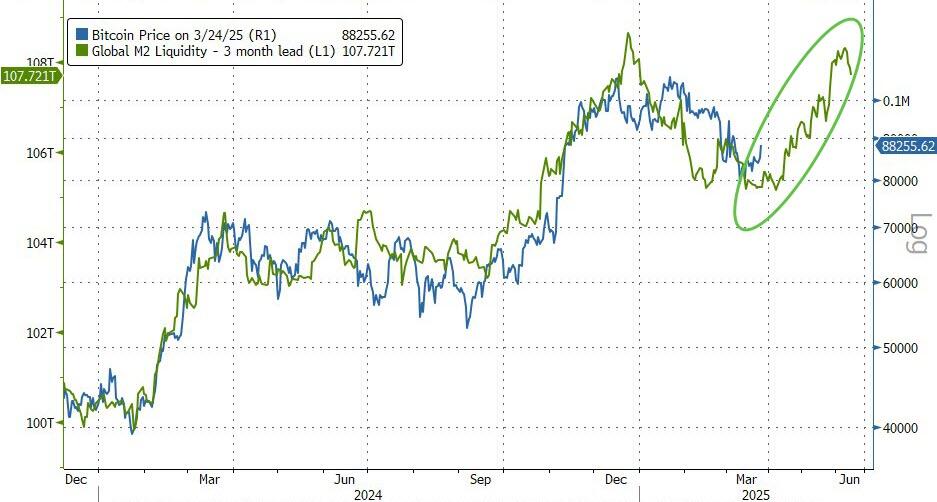
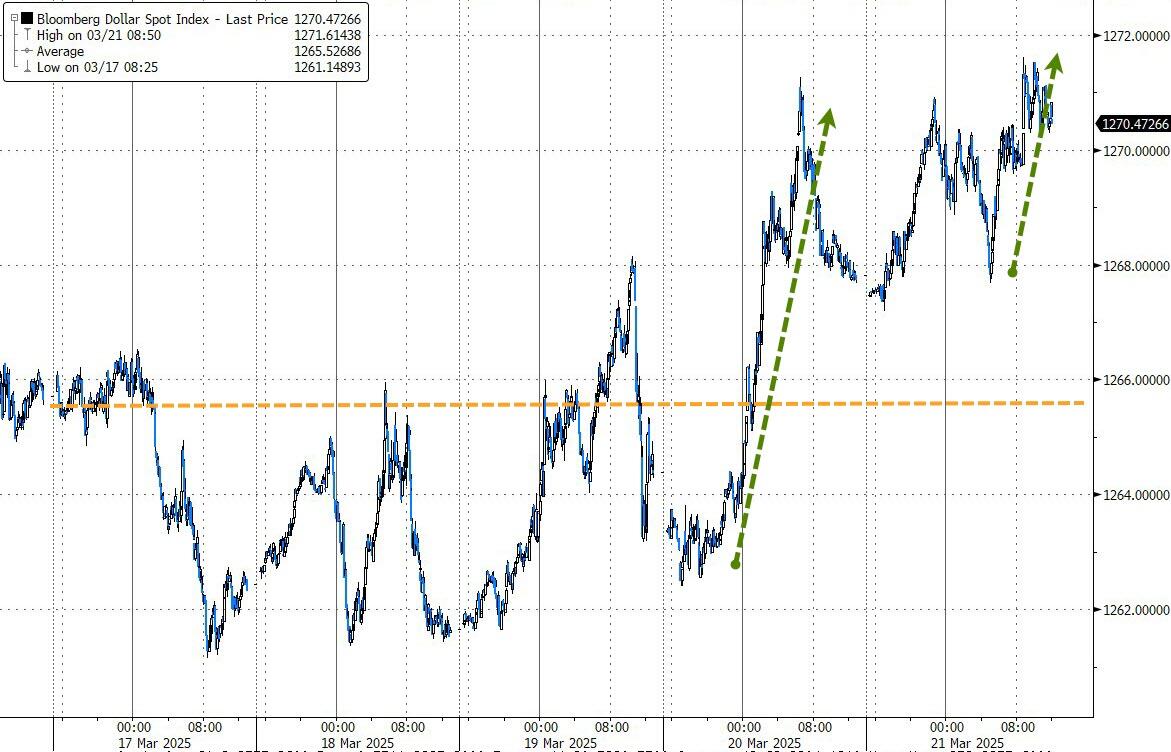
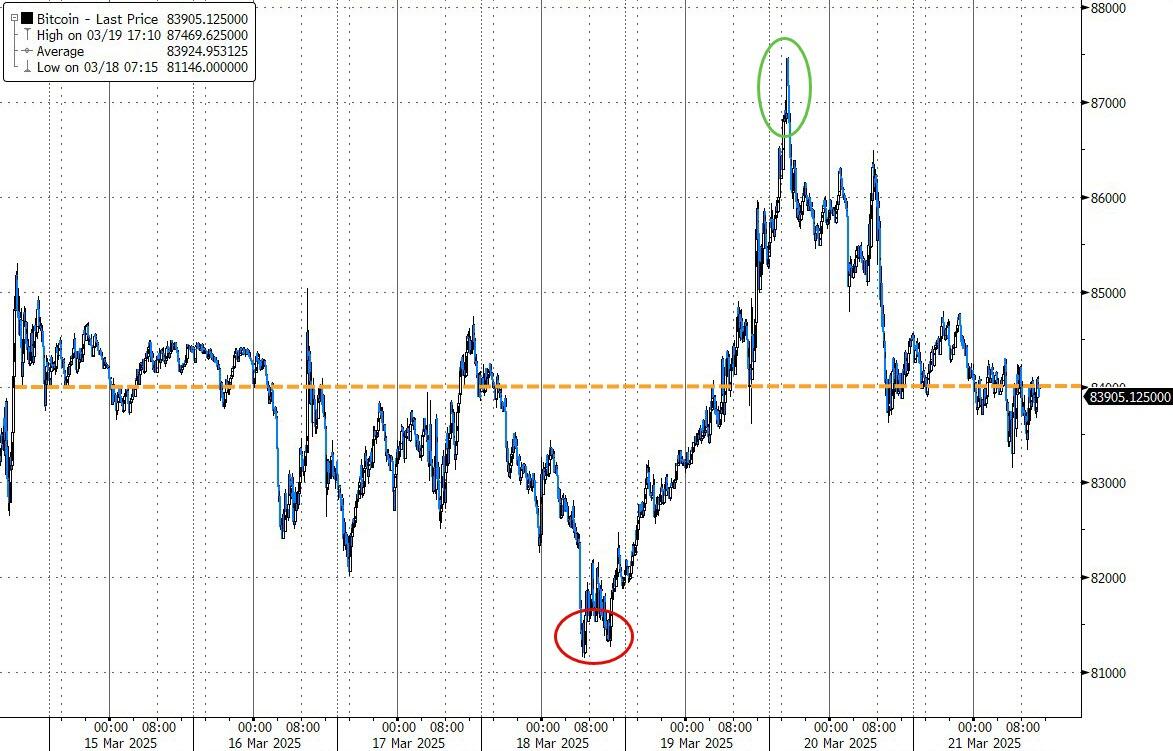
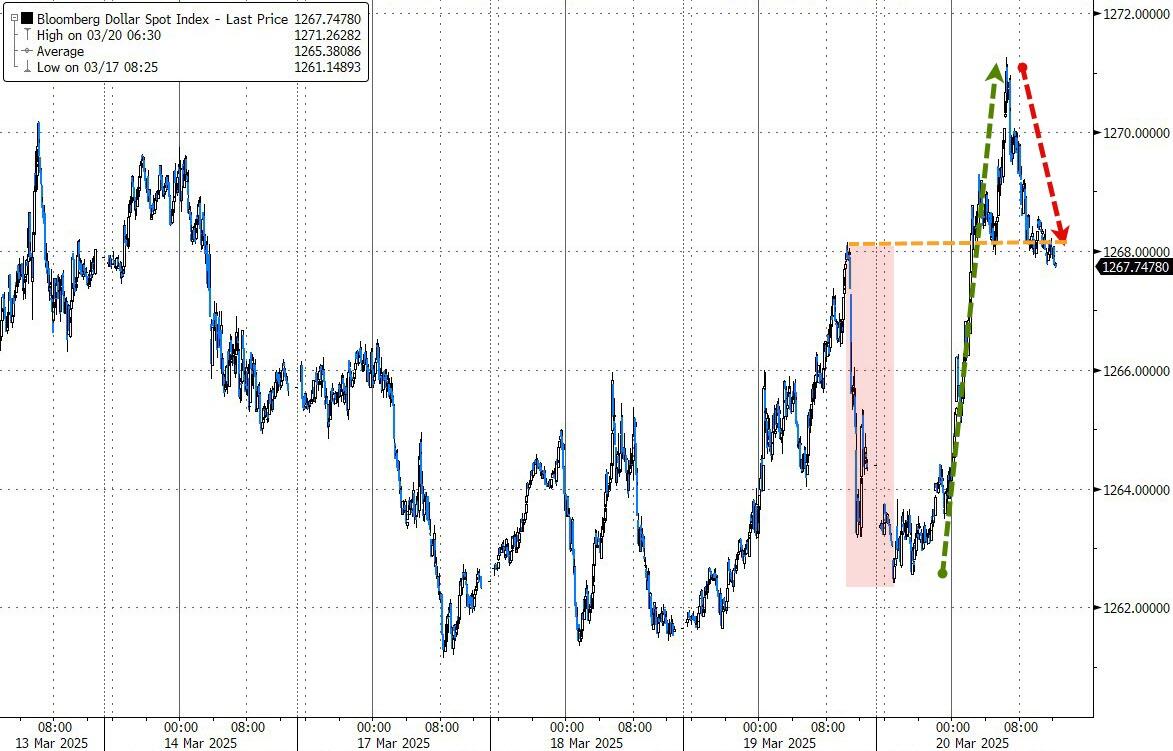
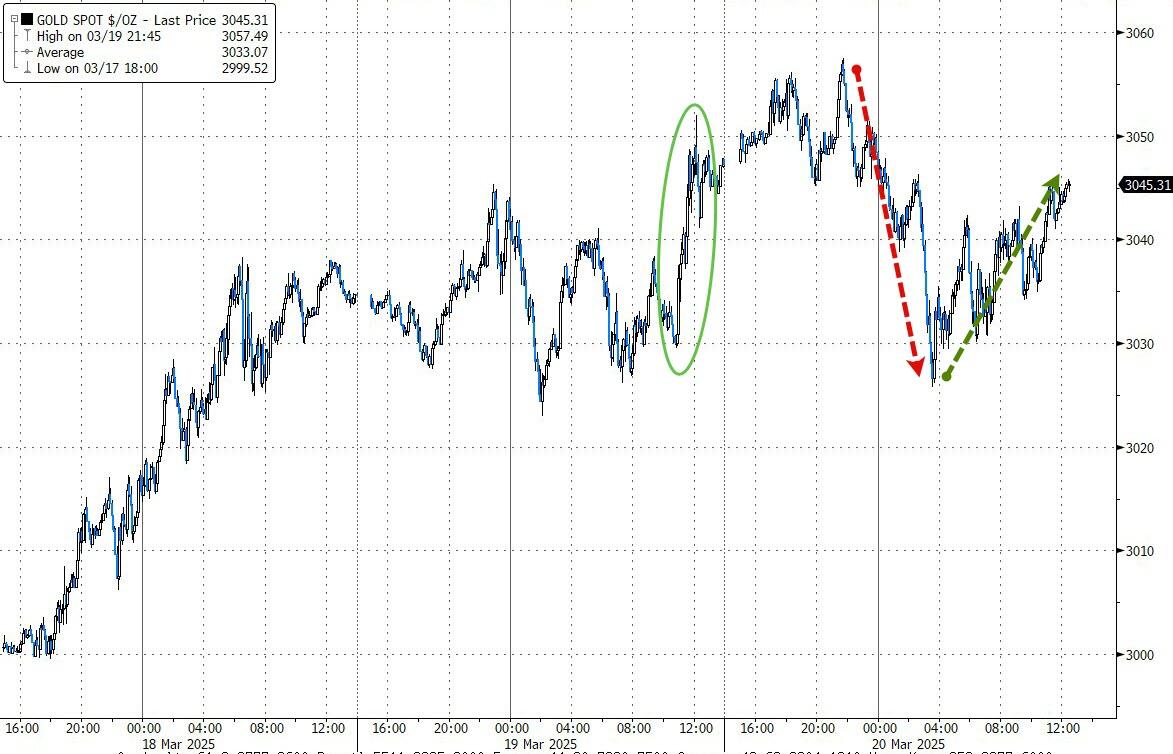
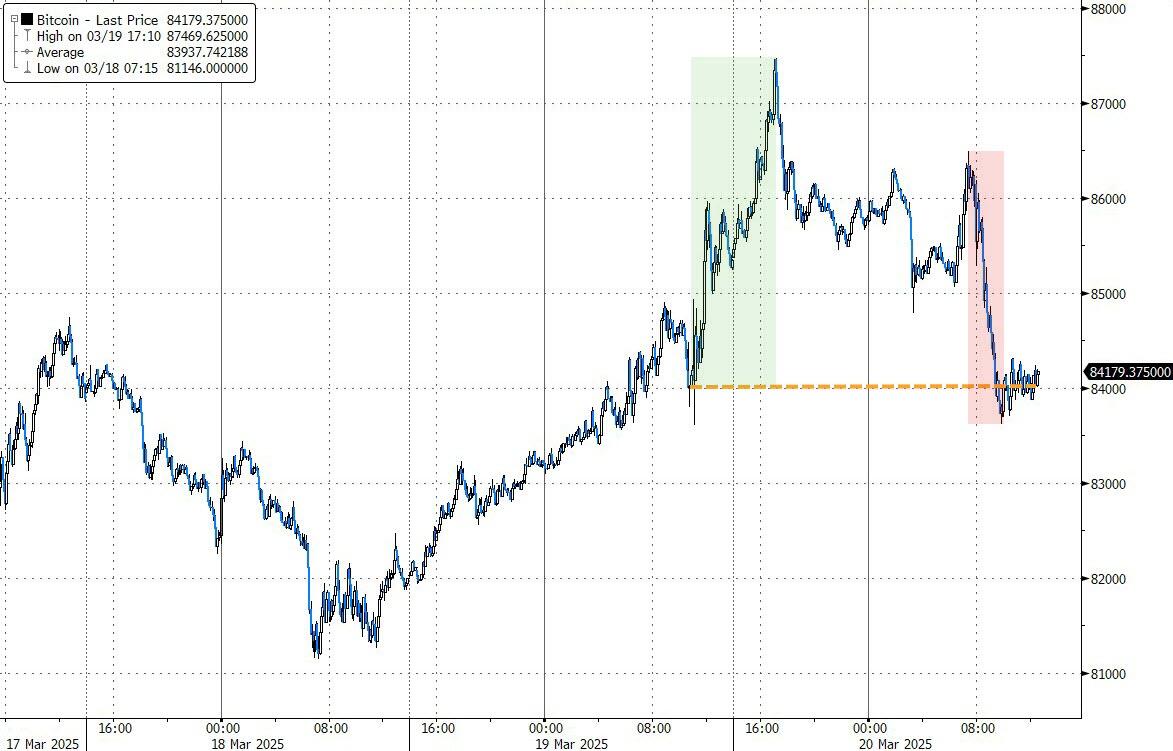
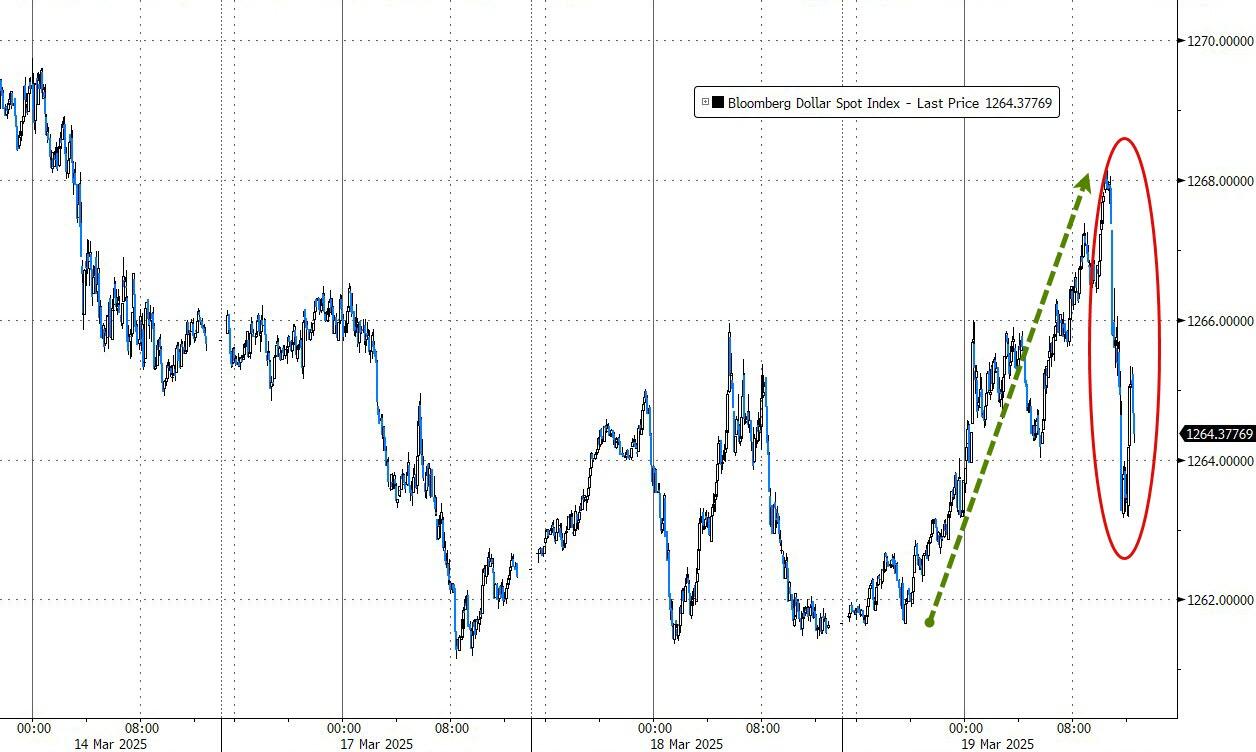
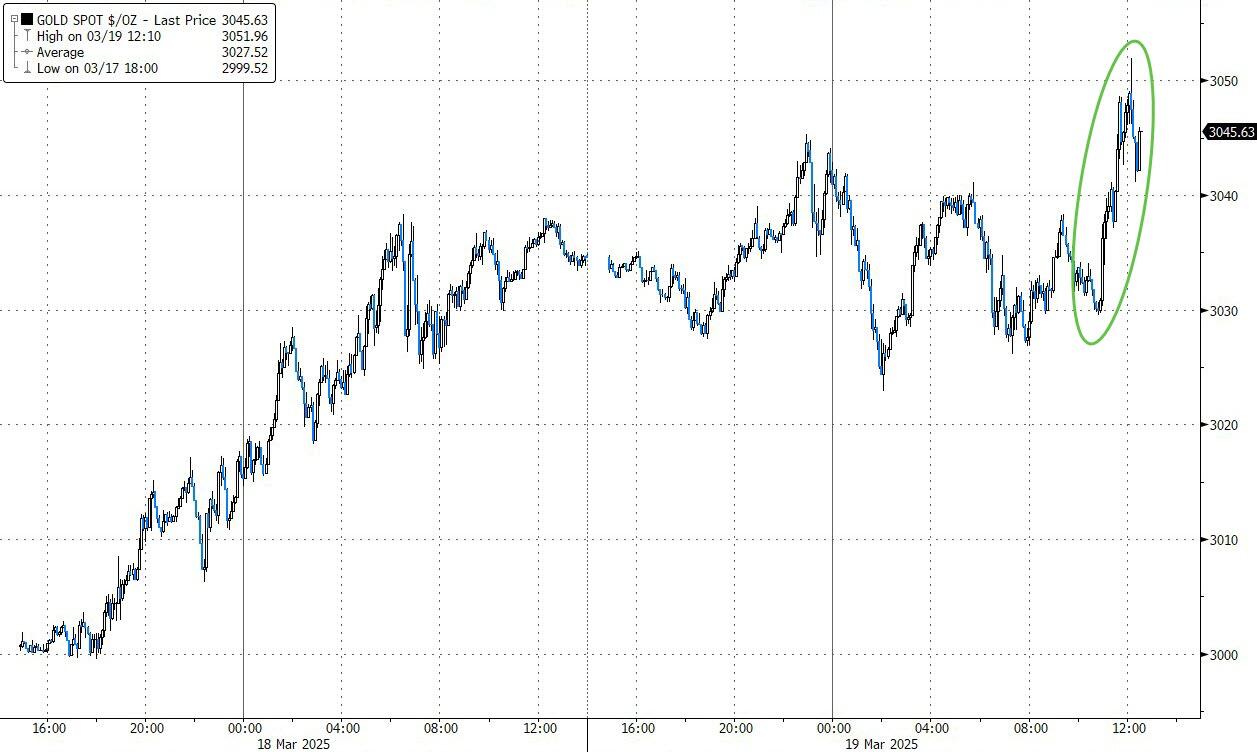
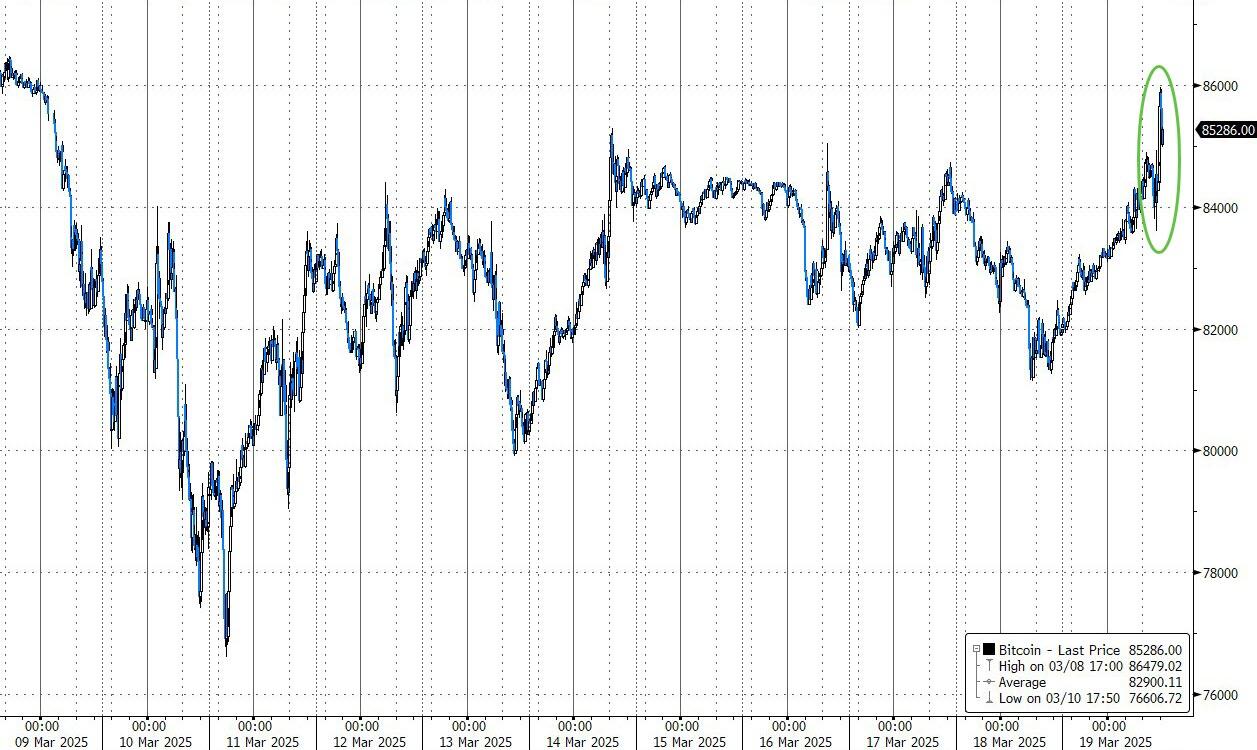
The dollar closed unchanged, gold slipped but found support at $3,000, and Bitcoin surged back above $88k to a three-week high.

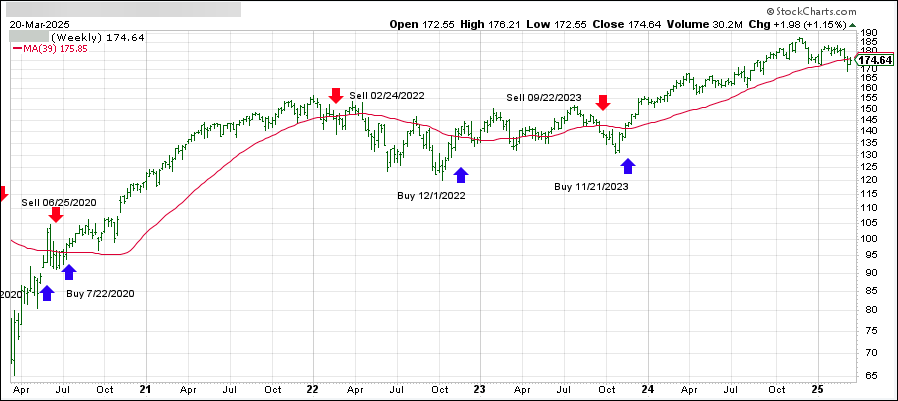
Could this be the beginning of the next leg higher based on historical precedent?

Read More

ETFs On The Cutline – Updated Through 03/21/2025

Ulli ETFs on the Cutline Contact

Do you want to know which ETFs are hot and which ones are not? Then you need my High-Volume ETF Cutline report. It tells you how close or far each of the 311 ETFs I follow is from its long-term trend line (39-week SMA). These are the ETFs that trade more than $5 million a day, so they are not some obscure funds that nobody cares about.

The report is split into two parts: The winners that are above their trend line (%M/A), and the losers that are below it. The yellow line is the line of shame that separates them. You can see how many ETFs are in each group and how they have changed since the last report (115 vs. 136 current).

Take a peek:

The HV ETF Master Cutline Report

If you are confused by some of the terms we use, don’t panic. I have a helpful Glossary of Terms for you.

If you want to learn more about the Cutline method and how it can make you rich (or at least less poor), read my original post here.

ETF Tracker Newsletter For March 21, 2025

Ulli ETF Tracker Contact

ETF Tracker StatSheet          

You can view the latest version here.

LATE REBOUND HELPS S&P 500 AVOID FIVE-WEEK LOSING STREAK

[Chart courtesy of MarketWatch.com]

  1. Moving the market

The major indexes started the last trading day of the week on a downward trend, erasing the modest gains from earlier in the week.

Volatility was high due to options expirations and the looming April 2nd tariff deadline set by Trump. Recession fears and weakness in the mega-cap tech sector also played significant roles.

Despite a recent recovery from correction territory—a 10% drop from recent highs—the S&P 500 remains 8% below that level. However, a late-session rebound helped it avoid its first five-week losing streak in over two years.

Overall market weakness has dampened sentiment, with bellwether companies like FedEx and Nike taking hits of 6% and over 5%, respectively. Microsoft experienced an eight-day losing streak, while Tesla fared worse, down for nine consecutive weeks, as reported by ZH.

The Mag7 basket closed lower for the seventh week out of the last eight, with even lower bond yields providing little support. The dollar rallied, posting gains for the past three straight days.

Bitcoin ended the week unchanged, seemingly stuck to its 200-day moving average and possibly awaiting a liquidity stimulus. Gold lost support intraday but ended the week higher, marking gains in 11 of the past 12 weeks.

With options expiration volatility now subsided, will we see a change in market direction next week?

Our TTI remains in the neutral zone, indicating it could break out either way, so we will let the markets dictate our next move.

Read More

Weekly StatSheet For The ETF Tracker Newsletter – Updated Through 03/20/2025

Ulli ETF StatSheet Contact

ETF Data updated through Thursday, March 20, 2025

How to use this StatSheet:

  1. Out of the 1,800+ ETFs out there, I only pick the ones that trade over $5 million per day (HV ETFs), so you don’t get stuck with a lemon that nobody wants to buy or sell.
  1. Trend Tracking Indexes (TTIs)

These are the main indicators that tell you when to buy or sell Domestic and International ETFs (section 1 and 2). They do that by comparing their position to their long-term M/A (Moving Average). If they cross above, and stay there, it’s a green light to buy. If they fall below, and keep going, it’s a red light to sell. And to make sure you don’t lose your shirt if things go south, I also use a 12% trailing stop loss on all positions in these categories.

  1. All other investment areas don’t have a TTI and should be traded based on the position of each ETF relative to its own trend line (%M/A). That’s why I call them “Selective Buy.” In other words, if an ETF goes above its own trend line, you can buy it. But don’t forget to use a trailing sell stop of 12%, or less if you’re feeling nervous.

If some of these words sound like Greek to you, please check out the Glossary of Terms and new subscriber information in section 9.

  1. DOMESTIC EQUITY ETFs: BUY— since 11/21/2023

Click on chart to enlarge

This is our main compass, the Domestic Trend Tracking Index (TTI-green line in the above chart). It has broken below its long-term trend line (red) by -0.53% but currently remains in “Buy” mode.

Read More

Late-Session Uncertainties Push Major Indexes To Red Close

Ulli Market Commentary Contact

[Chart courtesy of MarketWatch.com]

  1. Moving the market

Equities continued their recovery from the recent selloff, buoyed by some positive economic data.

However, late-session uncertainties led to a red close for the major indexes, as concerns grew that the Fed might not be able to significantly cut rates in 2025 due to potentially inflationary trade tariffs starting on “Liberation Day,” April 2nd.

Some traders believe these economic concerns are exaggerated. Fed Chair Powell stated that the economy is “strong overall” and that his policy is “in a good place” to respond to any signs of weakness. He also described the potentially inflationary effects of tariffs as temporary.

Sales of existing homes in February rose 4.2% from January, defying expectations of a 3% drop. Jobless claims increased only slightly from last week, with layoffs remaining low. However, Leading Indicators fell to their lowest level since November 2016, as noted by ZH.

After an early bounce, the Mega-Cap tech sector reversed yesterday’s gains, mirroring the pattern of the most shorted stocks. Bond yields were mixed, rate cut expectations rose, and the dollar advanced.

Despite the dollar’s gains, gold closed higher, reaching the $3,050 level. Bitcoin surged early on but gave back its gains late in the session.

Today’s trading was largely uneventful, but the positive takeaway is that we are nearing the end of the seasonally weakest period of the year.

Will April align with its historically bullish trend?

Read More

Markets Rally As Fed Chair Powell Balances Dovish And Hawkish Remarks

Ulli Market Commentary Contact

[Chart courtesy of MarketWatch.com]

  1. Moving the market

In anticipation of the Fed’s policy announcement, equities climbed higher early in the session and continued their upward trend, joined by bonds, gold, and cryptocurrencies.

While no change in rates is expected, traders are keen to hear the Fed’s outlook on two potential rate cuts this year. They will also be listening for insights on how the Fed evaluates the current economy, given the trade tensions created by tariffs.

Alongside the interest rate decision, Fed Chair Powell commented on GDP, inflation, unemployment, and the possibility of “stagflation.” His remarks were both dovish and hawkish, but traders interpreted them positively, leading to a broad market rally.

Powell also addressed Trump’s tariff agenda, stating that tariff inflation can be transitory if inflation expectations are anchored.

The most shorted stocks were squeezed for the third time in four days, bond yields retreated, rate cut expectations increased, and even the dollar ended slightly higher despite a midday dip.

Gold surged above $3,050, Bitcoin approached $86,000, and crude oil recovered some of its previous losses.

It was a strong comeback day for all markets, with our domestic TTI now close to crossing back above its long-term trend line.

Is the bull market about to resume its trend again?

Read More