Nvidia’s Earnings Blowout Lifts Tech And Market To New Highs

Ulli Market Commentary Contact

[Chart courtesy of MarketWatch.com]
  1. Moving the markets

Nvidia, the king of chips, smashed earnings expectations and sent its stock soaring to new heights. The tech giant reported a staggering 265% increase in revenue from a year ago, thanks to its thriving artificial intelligence business. It also predicted another strong quarter ahead, despite already high expectations.

The news lifted the whole tech sector, as well as the broader market. Meta, Amazon, Microsoft, and Netflix all rose more than 1%. The MAG7 group of tech titans added $500 billion to their combined value.

Nvidia and its Big Tech peers have been on a tear for the past year, fueled by AI hype and innovation. The stock market followed Nvidia’s lead, with the Nasdaq surging 3% and the S&P 500 hitting a record high. Small Caps trailed behind with a modest gain. Most shorted stocks were flat, despite the bullish mood.

The market is enjoying strong earnings and economic growth, but it could face headwinds from rising bond yields. Higher yields reflect higher expectations for growth, but they also make stocks less attractive.

Treasury yields rose across the board, while the dollar and gold were little changed. Oil prices rebounded after a weak start.

The market seems to be ignoring the economic reality, as ZeroHedge noted, with the Nasdaq diverging from bond yields.

How long can this party last?

Read More

Nvidia’s Earnings: The Make-Or-Break Moment For The Stock Market

Ulli Market Commentary Contact

[Chart courtesy of MarketWatch.com]

  1. Moving the markets

The stock market was in a slump for the third consecutive day on Wednesday, as investors awaited Nvidia’s earnings report after the market closed. Nvidia, the leading chipmaker, had seen its stock price skyrocket by 230% in the past year, but some analysts worried that it was overvalued. The stock dropped 2% on Wednesday.

The market needed a spark to ignite a rally, and some hoped that Nvidia could provide it. But the prospects of interest rate cuts, which had boosted the market earlier, had faded away.

The Federal Reserve seemed reluctant to lower rates, especially after the economy showed signs of heating up last week. The Fed released the minutes of its January meeting on Wednesday, which confirmed its cautious stance on rates. The Fed was more concerned about cutting rates too early than keeping them too low for too long.

This dampened the market’s expectations of rate cuts in 2024, which fell to a 50-50 chance of 3 or 4 cuts.

The bond market reacted to the Fed’s hawkish tone, pushing the yields higher. The 10-year yield reached its highest level since Thanksgiving. The dollar weakened, while gold was flat. Oil prices rebounded to $78 a barrel.

The market managed to recover most of its losses in the last half-hour of trading, thanks to a surge of buying and a short squeeze.

But the fate of the market still depended on Nvidia’s earnings. Will Nvidia deliver a stellar performance and lift the market’s mood?

Or will Nvidia disappoint and drag the market down?

Read More

Nvidia Weighs On Us Stocks As Investors Fret Over Valuation And Fed Outlook

Ulli Market Commentary Contact

[Chart courtesy of MarketWatch.com]

  1. Moving the markets 

Today was a bad day for the US stock market, especially for the smaller companies. Nvidia dragged down the tech sector as investors worried about its high price before its earnings report tomorrow.

Even the big names like Amazon, Microsoft, and Meta couldn’t escape the sell-off and lost more than 1% each.

The financial sector had some excitement with the news that Capital One Financial will buy Discover Financial Services for $35.3 billion in stock. The deal is expected to close sometime between late 2024 and early 2025, so don’t hold your breath.

This comes after a week of losses on Wall Street, as economic data showed that the Fed may not lower interest rates as much or as soon as the market hoped this year. Some indicators were disappointing and pushed up the expectations for a rate cut in 2024.

The MAG7 stocks (Microsoft, Amazon, Google, and Meta) suffered a breakdown from their previous uptrend, while the most hated stocks also fell.

The bond market was mixed, with the 10-year yield dropping slightly, which made the dollar weaker and gold stronger, but oil prices slid below $78 a barrel.

And as we wait for NVDA’s earnings report, this chart that compares the AI Boom with the Covid bust may come back to haunt us.

Or will NVDA surprise us all and break the pattern?

Read More

ETFs On The Cutline – Updated Through 02/16/2024

Ulli ETFs on the Cutline Contact

Do you want to know which ETFs are hot and which ones are not? Then you need my High-Volume ETF Cutline report. It tells you how close or far each of the 311 ETFs I follow is from its long-term trend line (39-week SMA). These are the ETFs that trade more than $5 million a day, so they are not some obscure funds that nobody cares about.

The report is split into two parts: The winners that are above their trend line (%M/A), and the losers that are below it. The yellow line is the line of shame that separates them. You can see how many ETFs are in each group and how they have changed since the last report (251 vs. 258 current).

Take a peek:

The HV ETF Master Cutline Report

If you are confused by some of the terms we use, don’t panic. I have a helpful Glossary of Terms for you.

If you want to learn more about the Cutline method and how it can make you rich (or at least less poor), read my original post here.

Hot Inflation Report Burns Stocks, No Rate Cuts Soon

Ulli ETF Tracker Contact

[Chart courtesy of MarketWatch.com]

  1. Moving the markets 

Stocks took a hit on Friday, as another spicy inflation report raised doubts about the timing of Fed rate cuts this year.

The PPI for January, which tracks wholesale inflation, rose 0.3%, beating the expected 0.1% increase. Without food and energy, the core-PPI jumped 0.5%, much higher than the forecasted 0.1% rise.

The 10-year Treasury yield spiked above 4.3% after the hot PPI report but cooled down to 4.29% by the end of the day. The 2-year Treasury yield reached 4.7%, the highest since December.

It was a wild week for stocks, as traders tried to figure out where the U.S. economy was heading and when the Fed might lower rates. On Tuesday, the Dow had its worst day in almost a year, after January’s CPI, which measures consumer inflation, came in at 3.1%, above the 2.9% that was expected.

The market shrugged off the report for the next two days, with the S&P 500 bouncing back on Thursday to close at a new record high.

But today’s wholesale inflation report added to the worries that the Fed might delay rate cuts until later in the year. The market swings show the struggle between high sticky inflation — which means no rate cuts soon — and strong earnings and other signs of a healthy economy, which boost investors’ confidence that stocks have more room to grow.

The S&P 500 was on track for its 15th positive week out of the last 16, but a late-day sell-off ruined the historic run that hadn’t happened since March 1972.

Looking at the economic data of higher-than-expected inflation (CPI and PPI), but lower-than-expected retail sales, industrial production, and housing activity – the outcome looks like stagflation to me.

Rate-cut chances dropped this week, with June now only a 60% probability of being the first cut, while traders are betting on only a 50-50 chance of 3 or 4 rate cuts for the year.

While the indexes recovered from the CPI shock on Tuesday, they failed to make more gains, which left the Nasdaq as the week’s biggest loser, Small Caps as the biggest winner, while the S&P edged lower, and The Dow barely broke even.

Bond yields went up, and so did mortgage rates, which hit two-month highs. The MAG7 stocks slipped, the dollar ended the week higher, while gold dipped but rebounded and stayed above $2,000. Oil prices rose for the 4th week out of 5 and got back to over $79.

Will gas prices at the pump follow suit, as this chart suggests?

Read More

Weekly StatSheet For The ETF Tracker Newsletter – Updated Through 02/15/2024

Ulli ETF StatSheet Contact

ETF Data updated through Thursday, February 15, 2024

How to use this StatSheet:

  1. Out of the 1,800+ ETFs out there, I only pick the ones that trade over $5 million per day (HV ETFs), so you don’t get stuck with a lemon that nobody wants to buy or sell.
  1. Trend Tracking Indexes (TTIs)

These are the main indicators that tell you when to buy or sell Domestic and International ETFs (section 1 and 2). They do that by comparing their position to their long-term M/A (Moving Average). If they cross above, and stay there, it’s a green light to buy. If they fall below, and keep going, it’s a red light to sell. And to make sure you don’t lose your shirt if things go south, I also use a 12% trailing stop loss on all positions in these categories.

  1. All other investment areas don’t have a TTI and should be traded based on the position of each ETF relative to its own trend line (%M/A). That’s why I call them “Selective Buy.” In other words, if an ETF goes above its own trend line, you can buy it. But don’t forget to use a trailing sell stop of 12%, or less if you’re feeling nervous.

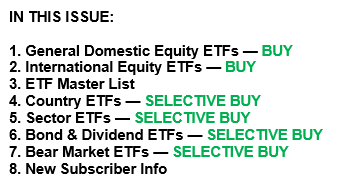
If some of these words sound like Greek to you, please check out the Glossary of Terms and new subscriber information in section 9.

  1. DOMESTIC EQUITY ETFs: BUY— since 11/21/2023

Click on chart to enlarge

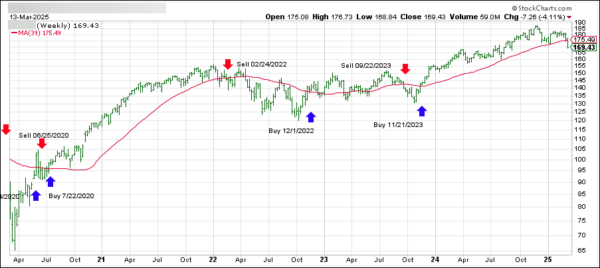
This is our main compass, the Domestic Trend Tracking Index (TTI-green line in the above chart). It has broken above its long-term trend line (red) by +8.84% and is in “Buy” mode as posted.

Read More