

- Moving the markets
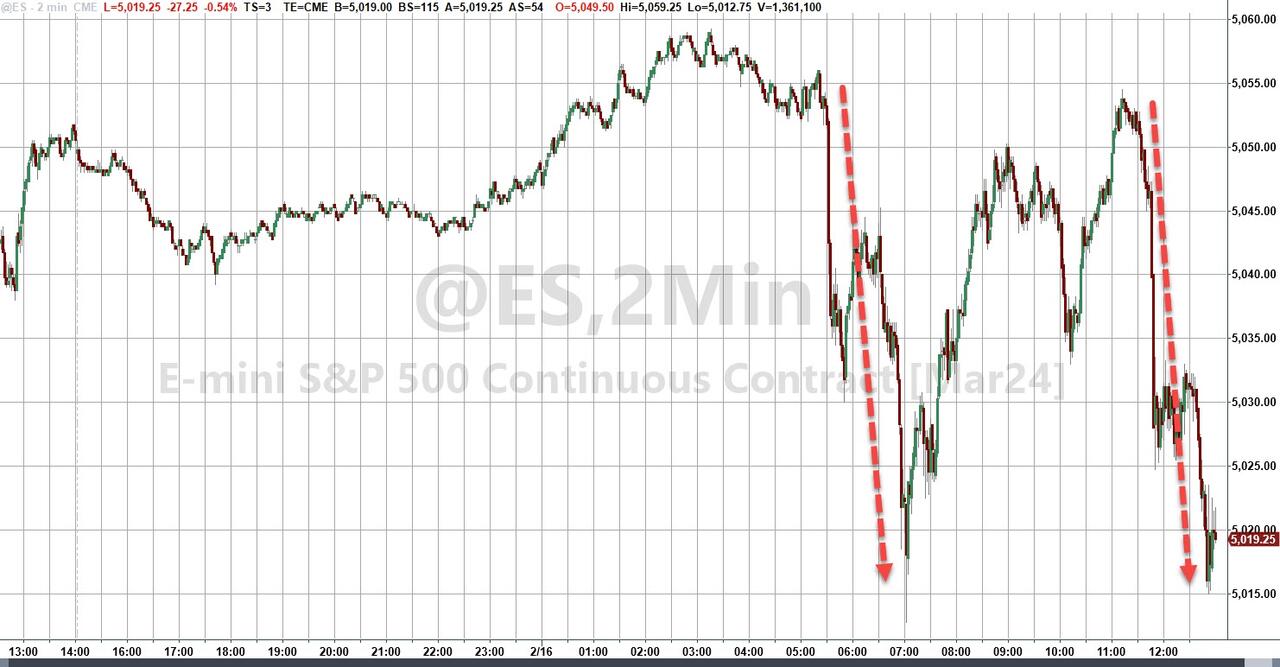
Stocks took a hit on Friday, as another spicy inflation report raised doubts about the timing of Fed rate cuts this year.
The PPI for January, which tracks wholesale inflation, rose 0.3%, beating the expected 0.1% increase. Without food and energy, the core-PPI jumped 0.5%, much higher than the forecasted 0.1% rise.
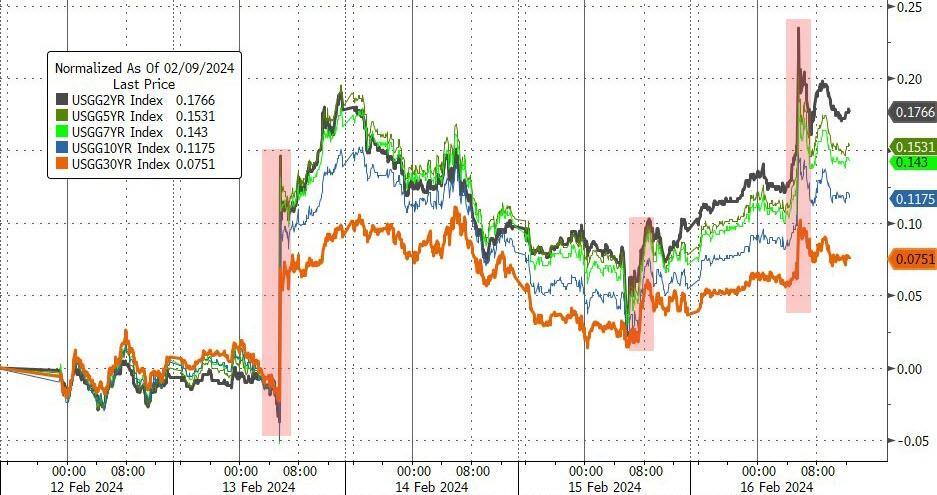
The 10-year Treasury yield spiked above 4.3% after the hot PPI report but cooled down to 4.29% by the end of the day. The 2-year Treasury yield reached 4.7%, the highest since December.
It was a wild week for stocks, as traders tried to figure out where the U.S. economy was heading and when the Fed might lower rates. On Tuesday, the Dow had its worst day in almost a year, after January’s CPI, which measures consumer inflation, came in at 3.1%, above the 2.9% that was expected.
The market shrugged off the report for the next two days, with the S&P 500 bouncing back on Thursday to close at a new record high.
But today’s wholesale inflation report added to the worries that the Fed might delay rate cuts until later in the year. The market swings show the struggle between high sticky inflation — which means no rate cuts soon — and strong earnings and other signs of a healthy economy, which boost investors’ confidence that stocks have more room to grow.
The S&P 500 was on track for its 15th positive week out of the last 16, but a late-day sell-off ruined the historic run that hadn’t happened since March 1972.
Looking at the economic data of higher-than-expected inflation (CPI and PPI), but lower-than-expected retail sales, industrial production, and housing activity – the outcome looks like stagflation to me.
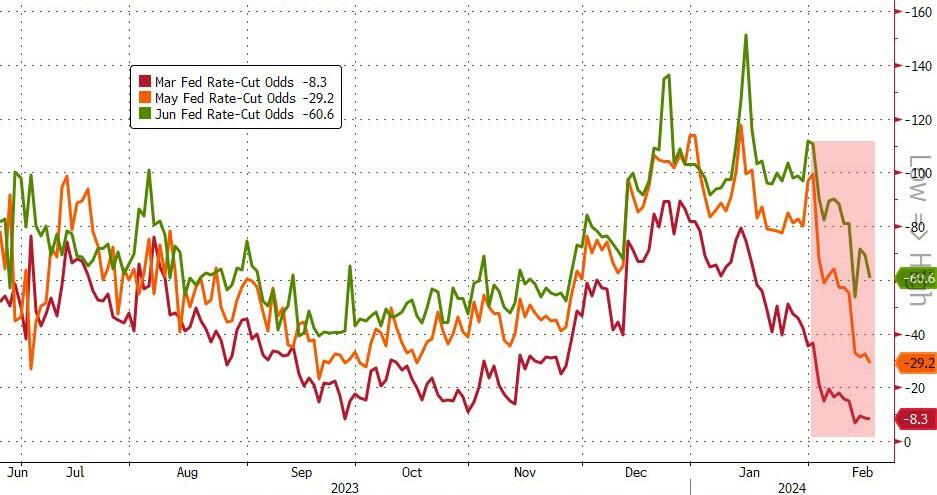
Rate-cut chances dropped this week, with June now only a 60% probability of being the first cut, while traders are betting on only a 50-50 chance of 3 or 4 rate cuts for the year.
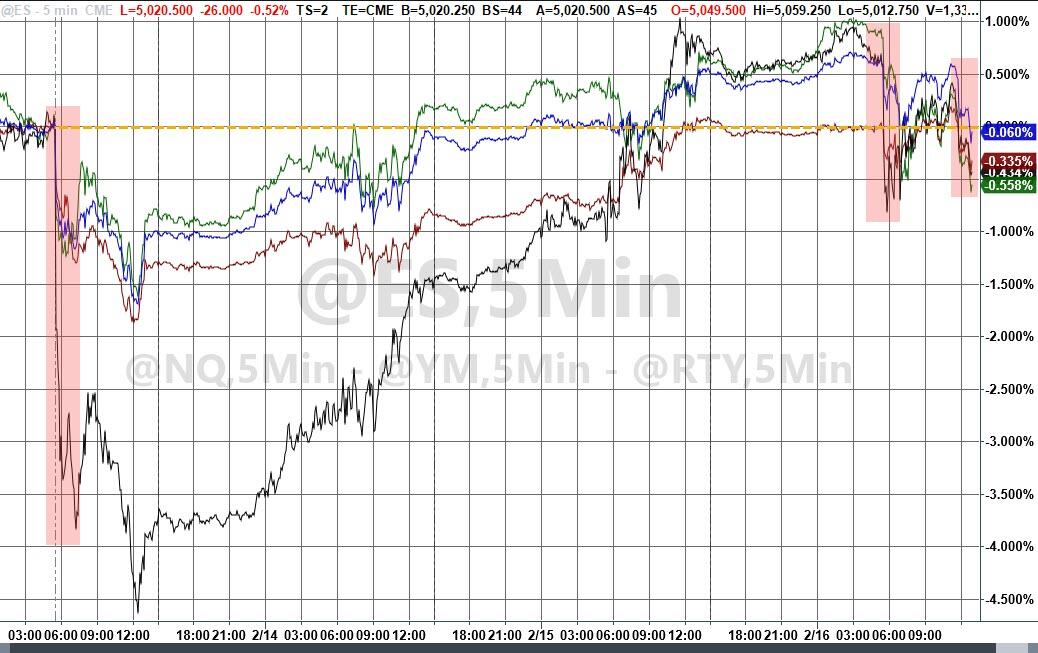
While the indexes recovered from the CPI shock on Tuesday, they failed to make more gains, which left the Nasdaq as the week’s biggest loser, Small Caps as the biggest winner, while the S&P edged lower, and The Dow barely broke even.
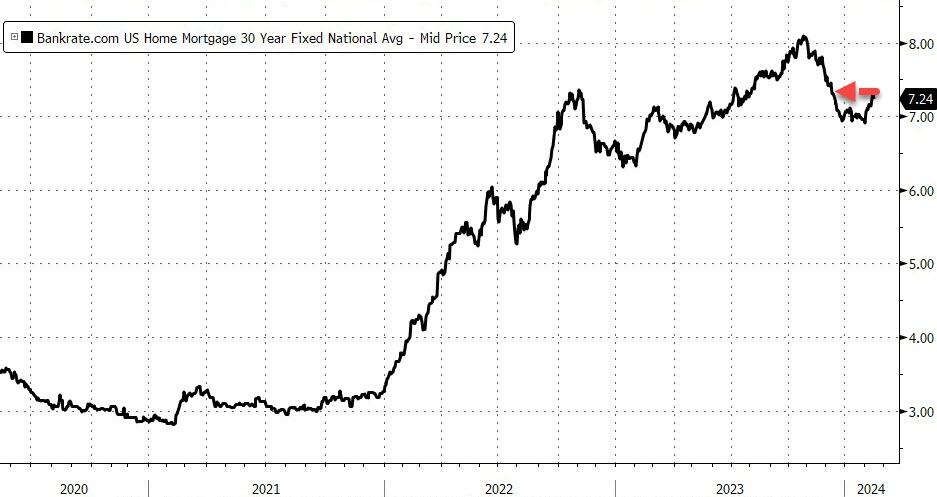
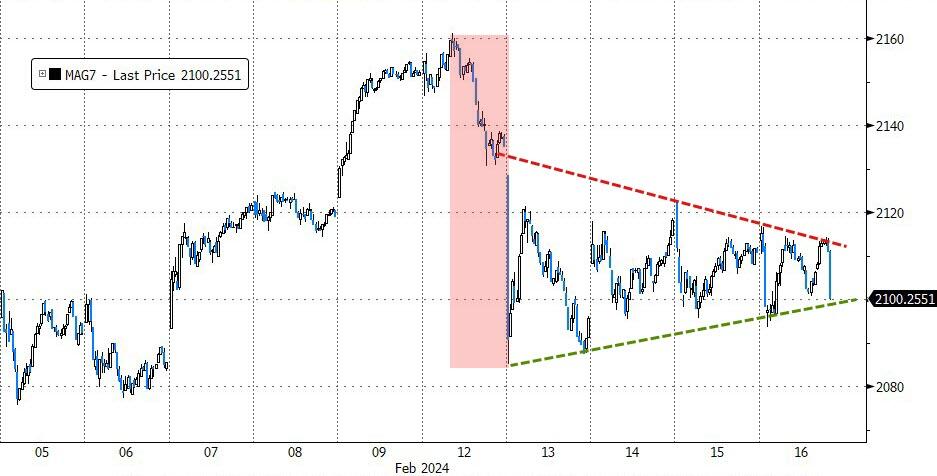
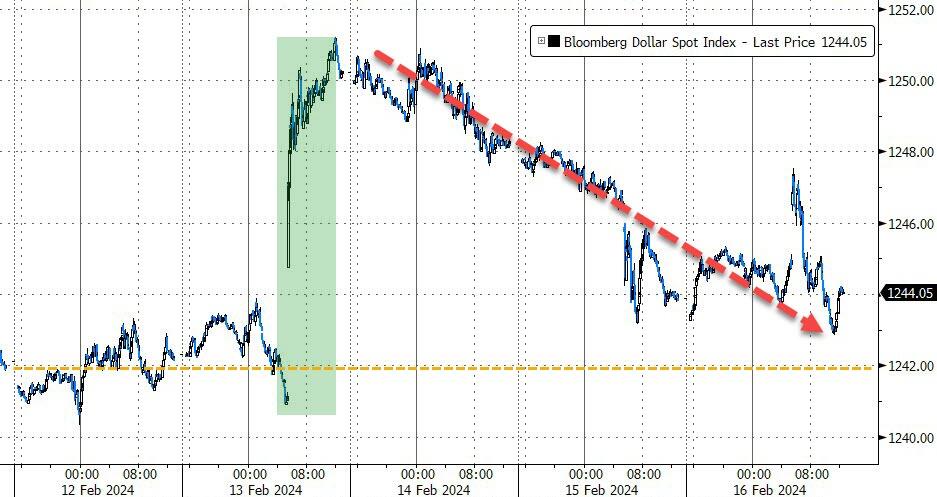
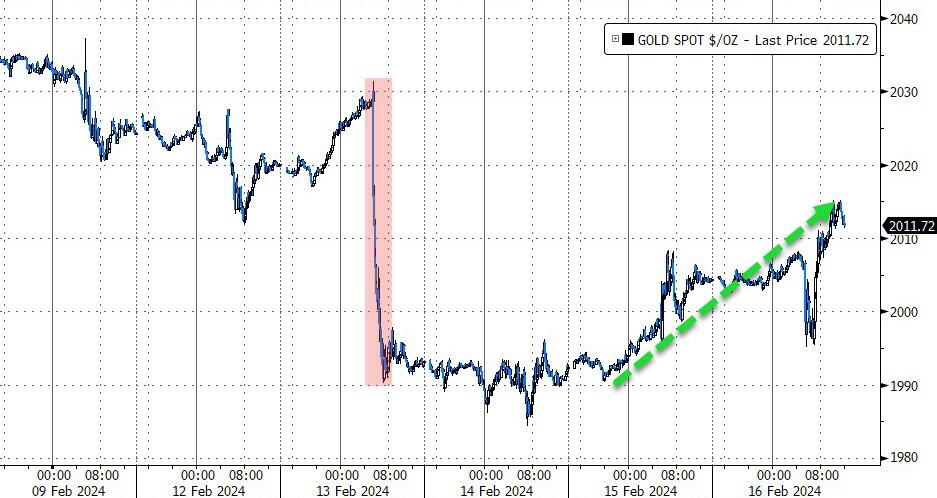
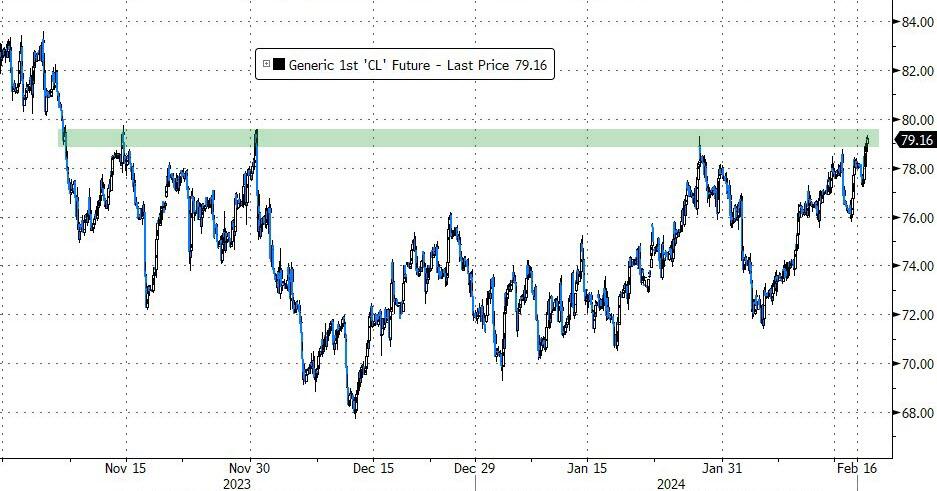
Bond yields went up, and so did mortgage rates, which hit two-month highs. The MAG7 stocks slipped, the dollar ended the week higher, while gold dipped but rebounded and stayed above $2,000. Oil prices rose for the 4th week out of 5 and got back to over $79.
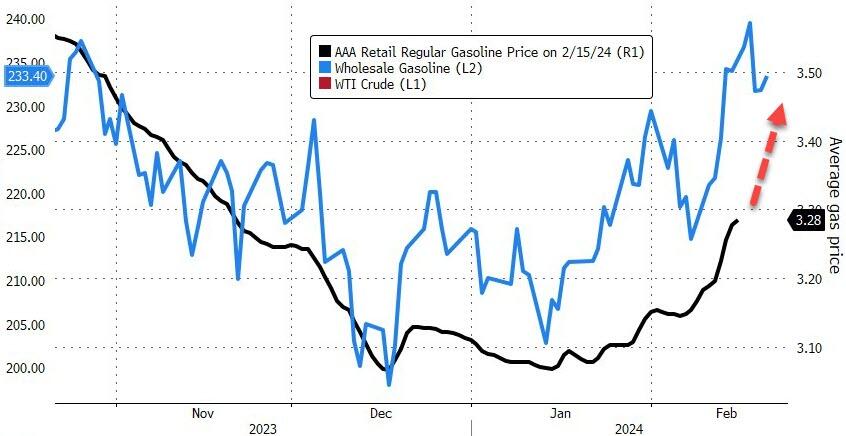
Will gas prices at the pump follow suit, as this chart suggests?
2. Current “Buy” Cycles (effective 11/21/2023)
Our Trend Tracking Indexes (TTIs) have both crossed their trend lines with enough strength to trigger new “Buy” signals. That means, Tuesday, 11/21/2023, was the official date for these signals.
If you want to follow our strategy, you should first decide how much you want to invest based on your risk tolerance (percentage of allocation). Then, you should check my Thursday StatSheet and Saturday’s “ETFs on the Cutline” report for suitable ETFs to buy.
3. Trend Tracking Indexes (TTIs)
The major indexes suffered some losses in part due to the expiration of more than $1 trillion worth of options. However, the drop was small compared to the previous gains.
Our TTIs also declined slightly but stayed firmly above their trend lines, indicating that we are still optimistic.
This is how we closed 2/16/2024:
Domestic TTI: +7.99% above its M/A (prior close +8.84%)—Buy signal effective 11/21/2023.
International TTI: +7.45% above its M/A (prior close +7.71%)—Buy signal effective 11/21/2023.
All linked charts above are courtesy of Bloomberg via ZeroHedge.
———————————————————-
WOULD YOU LIKE TO HAVE YOUR INVESTMENTS PROFESSIONALLY MANAGED?
Do you have the time to follow our investment plans yourself? If you are a busy professional who would like to have his portfolio managed using our methodology, please contact me directly to get more details.
—————————————————————-
Contact Ulli