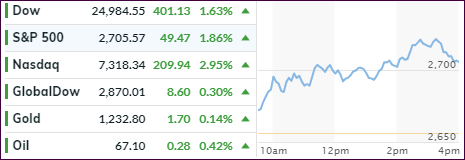
[Chart courtesy of MarketWatch.com]
- Moving the markets
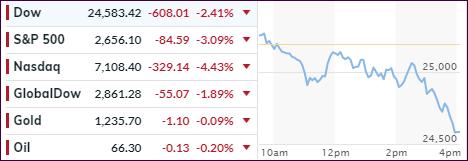
By the chart above, you would not know that we had a positive opening thanks to Boeing’s encouraging earnings report which, at the end of this session, turned into a tiny unimportant speck in the rear-view mirror. After a mid-day bounce, bearish momentum gathered strength and south we went, at first slowly and then via a swan dive into close with all major indexes suffering heavy losses.
The Dow and S&P 500 are now negative for the year, while the Nasdaq slipped into correction territory, which is defined as a pullback of at least 10% below its August high; it’s down -12.6% from that level. In fact, 70% of S&P 500 stocks are already in a correction.
So, it’s not surprising to hear that selling on the NYSE reached panic-like proportions with the path to the exit doors getting increasingly crowed. That supports my long-held belief that an investor should only be dealing with high-volume ETFs, such as the ones I feature in Thursday’s StatSheet.
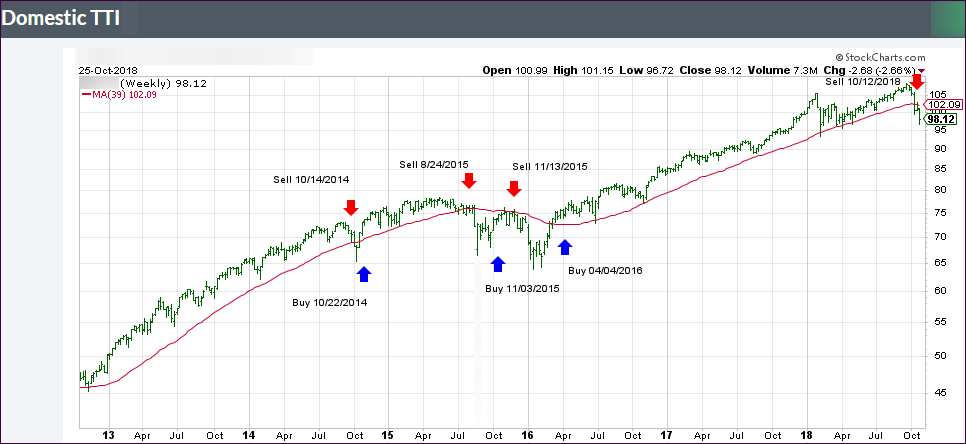
In my advisor practice, we remain in cash on the sidelines and will look for opportunities once our TTIs (section 3) move back into bullish territory.
Not helping matters, and putting another nail in the housing market coffin, were reports showing that New Home Sales crashed in September with supply soaring. New Home Sales plunged to their lowest since December 2016 and tumbled 5.5% MoM. You can read more details here.
Some interesting commentary always appears when markets hit the skids. Here are two that are worthy of mentioning:
- I want to reiterate that there is unlimited downside risk in the market right now, and I don’t think it’s being respected. It’s not until afterwards that they ask, “what happened??”
- We have maintained…and still maintain… the same philosophy that we’d adopted for these past several weeks and months: that this is a bear market and that periods of strength can be and indeed must be used to sell into… to lighten up existing long positions if one is still reasonably long and to sell short if one is of that mind. We stand by that thesis. But for a day or two or three, a bounce is in order.
I must agree with these comments, since it appears that the bears are clearly in charge when not just looking at the domestic area but at the global markets as well. The aging and failing banking systems seem to be the front runners, with Deutsche Bank following the path of Lehman as this chart shows. With over $50 trillion in derivatives exposure, it looks to be the proverbial bug looking for a windshield.
ZH summed up the ugliness of the day like this:
- Small Caps down 15% from highs
- Dow Transports down 14.5% from highs
- Nasdaq is now down 12.25% from the highs – enters correction
- S&P down 9% from highs
- Dow down 8.5% from highs
Back to the banks. Global systemically Important Banks have now crashed 30% since Trump’s election. Does that mean there will be another 2008 style bailout forthcoming?
Read More
