
- Moving the markets
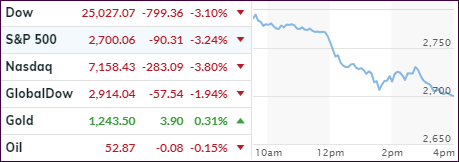
Global markets in general collapsed early on with the Dow at one point being down over 700 points, and that only after only 1.5 hours’ worth of trading. Contributing to the sour mood were news of the arrest of the chief financial officer of Chinese Telecom equipment maker Huawei.
Canadian officials arrested the CFO for potential extradition to the US for allegedly violating sanctions against Iran. While Meng Wanzhou was detained in Vancouver on Saturday, the news was only recently released, meaning that Trump and Xi had dinner at the G-20 meeting without this incident being made public, which sort of may have put another nail in the trade coffin.
European stocks joined that party and had their worst session in over 2 years with slumping oil prices adding to the declines. In the US, negative economic news, such as US factory orders tumbling the most in 15 months and initial jobless claims hovering at 6-month highs, were simply ignored in spite of softening indicators everywhere.
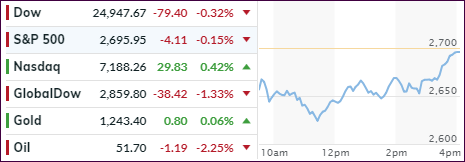
In the end, only the US markets managed a magical comeback (thanks to the Plunge Protection Team?) with the major indexes climbing steadily from mid-day on. While the Nasdaq managed to close in the green, the Dow and S&P 500 cut their sharp early losses as well and ended in the red by an insignificant margin. Helping the rebound was a well-timed article by the WSJ indicating that the Fed might not hike in December.
Our Trend Tracking Indexes (TTIs) remain in bear market territory, and we’re out of the market for the time being (since 11/15/18).
