ETF Tracker StatSheet
https://theetfbully.com/2019/01/weekly-statsheet-for-the-etf-tracker-newsletter-updated-through-01-03-2019/
MARKET CHAOS CONTINUES—THE PENDULUM SWINGS THE OTHER WAY
[Chart courtesy of MarketWatch.com]
- Moving the markets
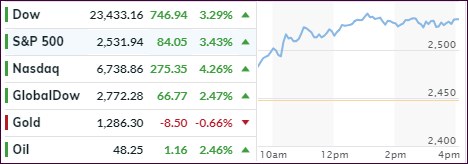
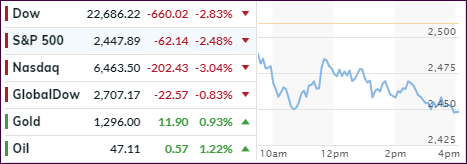
After yesterday’s equity thrashing, the markets shifted into reverse, very similar as to what we witnessed prior to and after Christmas, with the pendulum now swinging in the bullish direction. All of yesterday’s issue were swept under the carpet as three new drivers emerged to propel the markets out of the doldrums.
First, the U.S. gained 312k new jobs in December, which was the biggest increase in hiring in three years, and it shattered the forecasts made by Wall Street experts (182k). However, the unemployment rate rose to 3.9% from 3.7%. Those headlines pushed the computer algos into overdrive and up we went.
Never mind that under hood, the jobs report revealed that the increase in average hourly earnings was the fastest since 2009. The consequence could be a threat to corporate profit outlooks, something we’ve just seen with Apple. Additionally, only old workers found jobs in December, which is not exactly an encouraging sign.
Second, Trump came out touting “the great jobs number” while is economic advisor Kudlow declared that there is “no recession is sight. The American economy is growing 3 percent, job gains are huge, and businesses are investing big time,” which was followed by “it’s a much better optimistic picture than what we’ve been getting in the last month or two.”
And, thirdly, not to be outdone, Fed chair Powell did a dramatic U-turn and chimed in with dovish words like “we’re listening carefully to the market,” and “will adjust the balance sheet normalization policy ‘if needed’, and if it becomes an issue for the market and economy.”
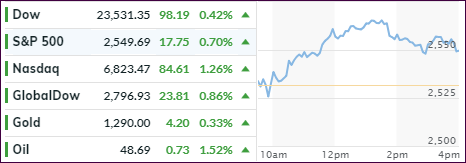
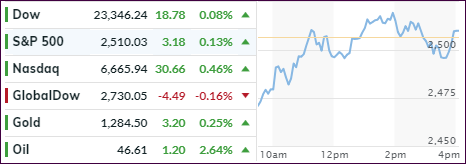
Well, you couldn’t have asked for any more assists, so panic buying and FOMO (Fear Of Missing Out) sent sending the Dow up almost 750 points and wiping out yesterday’s losses. This chart shows the market impact of the various actors chiming in, while traders welcomed the “new” Powell by interpreting his views as being sympathetic to their recent pain caused by collapsing asset prices.
The bond market was rocked as yields shot up, after yesterday’s fall, with the 10-year yield surging from a low of 2.54% to as high as 2.67%, according to ZH. This was a 4.2% increase and the biggest jump in 2 years. As a result, bond prices, which move inversely to yields, were clobbered with the widely held TLT dropping -1.16%.
In the end, Powell’s statement was the most powerful one and, while he was not explicitly hawkish, the mere absence of it was enough to propel the major indexes higher, which brings up this question: Will Powell’s ‘softer’ tone be enough to keep the rally going next week, or will it be a one-day wonder?
Read More
