Battling Growth Fears

Ulli Market Commentary Contact

[Chart courtesy of MarketWatch.com]
  1. Moving the markets

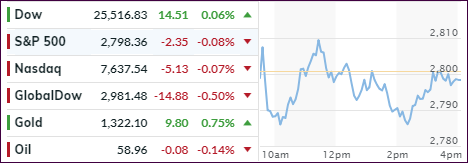
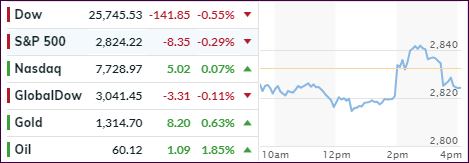
The bulls and bears engaged in another gathering of tug-of-war with the major indexes vacillating around their respective unchanged lines and, in the end, closing with no clear direction apparent.

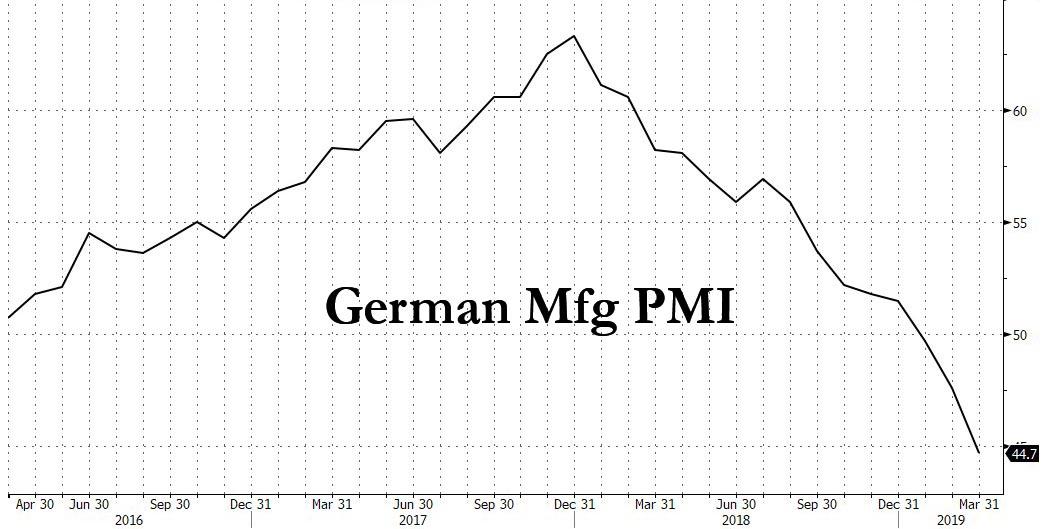
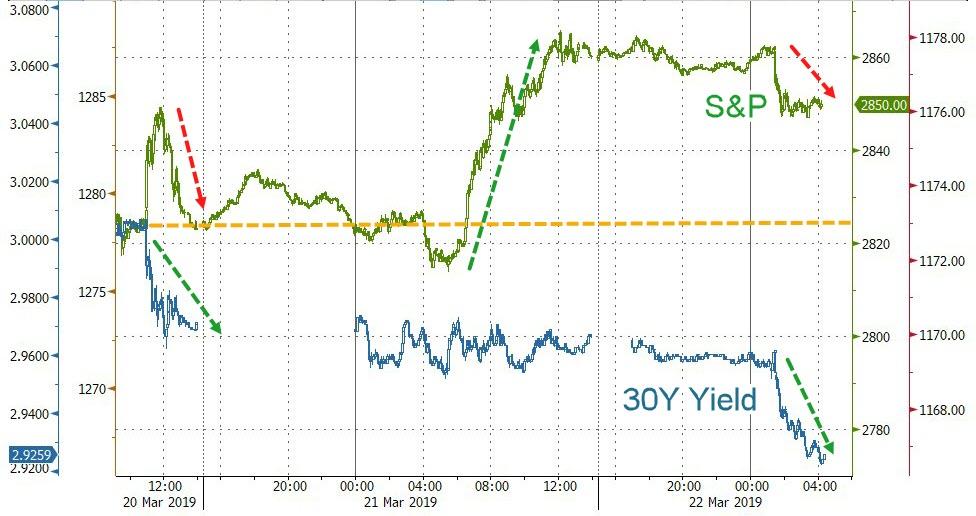
The fallout from last Friday was obvious, as global weakness carried into today, but enough bullish momentum turned this into an uneventful session. Not helping were continued concerns about the inversion of the yield curve where short term bonds are now sporting a higher yield than longer term ones.

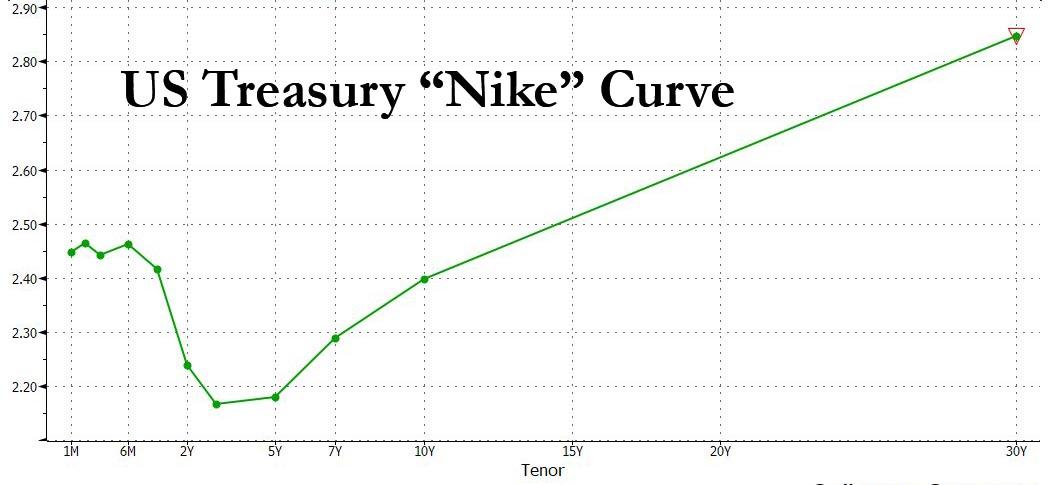
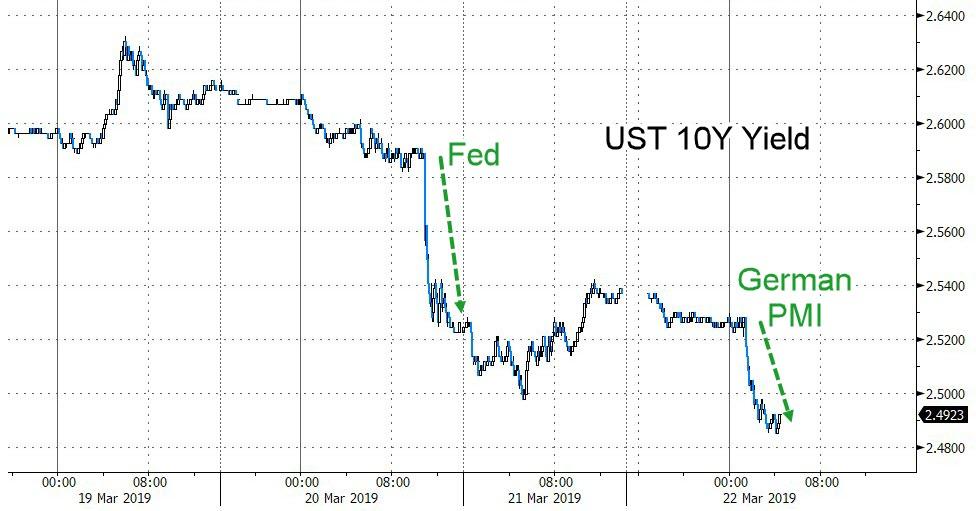
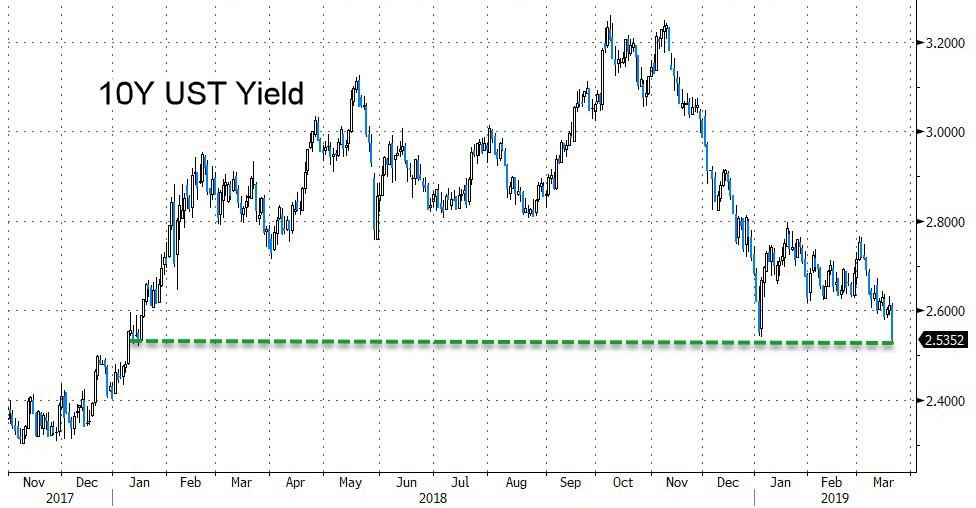
As a result, the focus today was more on bonds than the equity gyrations. Note that the 10-year bond yield plunged to its lowest level since 2017 but managed a modest rebound of 3 basis points to close at 2.406% after touching the 2.39% level.

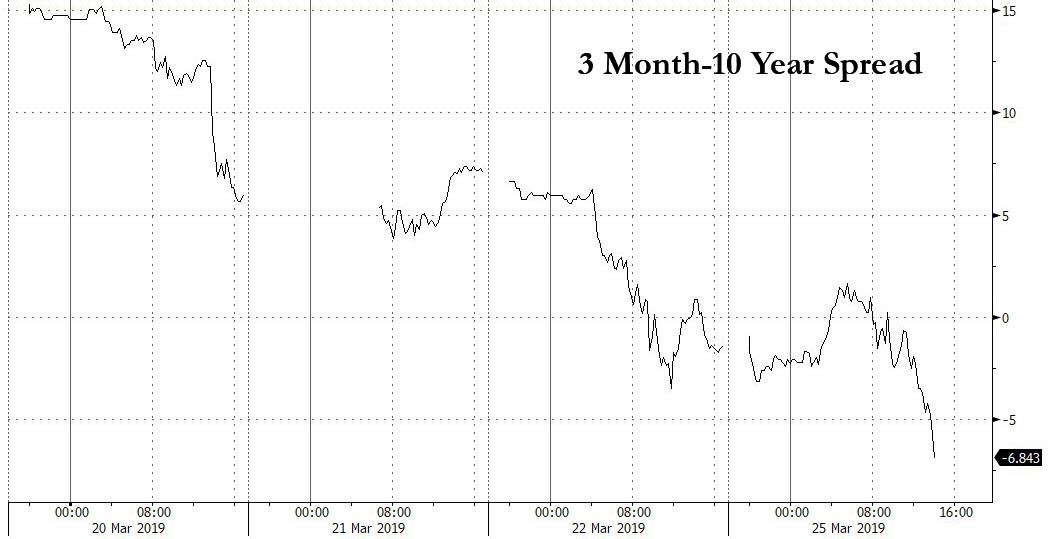
As ZH pointed out, more concerning was the ongoing slide in the 3 month-10-year bond spread, the Fed’s favorite recession indicator, which briefly plunged as much as 7 basis points before recovering to drop just 3 basis points.

If you are not familiar with it, this simply means that if you invest your money in a 3-month-bond you get more interest vs. having your funds tied up in a 10-year one. This chart demonstrates this insane oddity.

At day’s end, ZH pondered these critical questions:

Will Asia continue its selling, as the US bond market now screams global recession, and will the S&P finally breakdown as it breaches the next support level of 2,777 and if so, will it retest the December lows over 400 points lower, as so many bears have recently predicted?

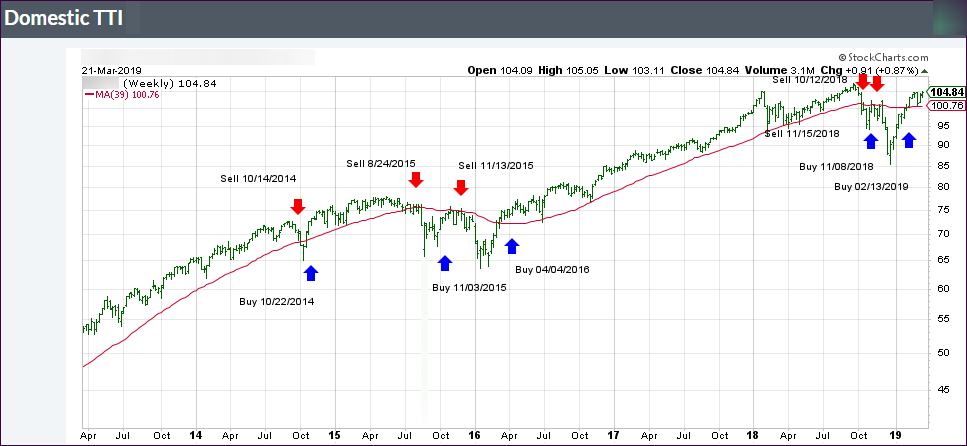
 Since no one has the answer, we must be prepared to deal with this type of scenario. Our Trend Tracking Indexes (TTIs) will lead the way and give us the signal when it’s time to head for the safety of the sidelines.

Read More

ETFs On The Cutline – Updated Through 03/22/2019

Ulli ETFs on the Cutline Contact

Below, please find the latest High-Volume ETF Cutline report, which shows how far above or below their respective long-term trend lines (39-week SMA) my currently tracked ETFs are positioned.

This report covers the HV ETF Master List from Thursday’s StatSheet and includes 322 High Volume ETFs, defined as those with an average daily volume of more than $5 million, of which currently 208 (last week 244) are hovering in bullish territory. The yellow line separates those ETFs that are positioned above their trend line (%M/A) from those that have dropped below it.

Take a look:

The HV ETF Master Cutline Report

In case you are not familiar with some of the terminology used in the reports, please read the Glossary of Terms.

If you missed the original post about the Cutline approach, you can read it here.

ETF Tracker Newsletter For March 22, 2019

Ulli Market Commentary Contact

ETF Tracker StatSheet

https://theetfbully.com/2019/03/weekly-statsheet-for-the-etf-tracker-newsletter-updated-through-03-21-2019/

WEEK ENDS WITH REALITY CHECK

[Chart courtesy of MarketWatch.com]
  1. Moving the markets

Reality made its way into the stock market with the major indexes plunging at first then staging a mid-day comeback only to dump again and close at the lows of the session.

As I pointed out yesterday, the Fed’s extreme dovish stance, along with worries about plunging yields, made traders ponder “what do they know that we don’t?” It appears that the answer can be found in a global slowing economy along with deteriorating data points.

Europe started today’s carnage when Germany’s manufacturing PMI crashed to 44.7 from 47.6, while economists were expecting a modest rebound to 48. That is now the third consecutive reading below 50, which indicates not only contraction but a recession as well.

This was followed by the U.S. Manufacturing PMI plunging to a 21-month low of 52 from 53 against expectations of 53.5, while the services PMI came in at 54.8 from 56 vs. expectations of 55.5. Maybe traders are now less puzzled as to why the European Central Bank (ECB) displayed an extreme dovish stance, just a few days before the Fed followed suit.

This one-two punch caused yields to drop sharply with the widely followed 10-year bond closing down a whopping 9.3 basis points to 2.44%.

In fact, according to ZH, the yield curve is now inverted for the first time since 2007:

On six occasions over the past 50 years when the three-month yield exceeded that of the 10-year, economic recession invariably followed, commencing an average of 311 days after the initial signal.

While equity markets have been downright ignorant of this development, as well as the massive decoupling between stocks and bonds, today may have been a wake-up call. Well-known fund manager Jeff Gundlach had this to say:

“Just because things seem invincible doesn’t mean they are invincible. There is kryptonite everywhere. Yesterday’s move created more uncertainty.”

This makes it one more reason while it is critical for your financial well-being to have an exit strategy in place, despite the prevailing bullish sentiment.

Why?

Because, as we saw last October, market direction can unexpectedly change in no time, not only due to worldwide uncertainties but also because all bullish cycles will come to an end—eventually; and this one is way past its due date.

Read More

Weekly StatSheet For The ETF Tracker Newsletter – Updated Through 03/21/2019

Ulli ETF StatSheet Contact

ETF Data updated through Thursday, March 21, 2019

Methodology/Use of this StatSheet:

  1. From the universe of over 1,800 ETFs, I have selected only those with a trading volume of over $5 million per day (HV ETFs), so that liquidity and a small bid/ask spread are assured.
  2. Trend Tracking Indexes (TTIs)

Buy or Sell decisions for Domestic and International ETFs (section 1 and 2), are made based on the respective TTI and its position either above or below its long-term M/A (Moving Average). A crossing of the trend line from below accompanied by some staying power above constitutes a “Buy” signal. Conversely, a clear break below the line constitutes a “Sell” signal. Additionally, I use a 7.5% trailing stop loss on all positions in these categories to control downside risk.

  1. All other investment arenas do not have a TTI and should be traded based on the position of the individual ETF relative to its own respective trend line (%M/A). That’s why those signals are referred to as a “Selective Buy.” In other words, if an ETF crosses its own trendline to the upside, a “Buy” signal is generated. Since these areas tend to be more volatile, I recommend a wider trailing sell stop of 7.5% -10% depending on your risk tolerance.

If you are unfamiliar with some of the terminology, please see Glossary of Terms and new subscriber information in section 9.


  1. DOMESTIC EQUITY ETFs: BUY — since 02/13/2019

Click on chart to enlarge

Our main directional indicator, the Domestic Trend Tracking Index (TTI-green line in the above chart) is now positioned above its long-term trend line (red) by +3.65% after having generated a new Domestic “Buy” signal effective 2/13/19 as posted.

Read More

The Morning After: Fed’s Softened Rate Outlook Propels Equities

Ulli Market Commentary Contact

[Chart courtesy of MarketWatch.com]
  1. Moving the markets

The fallout from the Fed’s soft outlook on interest rates was, so far, overwhelmingly positive with the bulls grabbing the baton and storming deeper into bullish territory. While the idea that no rate hikes on the horizon for 2019 stoked equity investors, worries kept creeping up that this was just a function of a slowing economy that could eventually result in the much-dreaded recession.

Be that as it may, right now the trend is bullish, and the major indexes, led by the Nasdaq, closed solidly higher. The gains were broad with our sector holdings making nice advances. Powerhouse Apple dominated the indexes by adding +3.68% and reclaiming its 200-day M/A, while buy-backs and short-squeezes combined their efforts to make this a miserable day for the bears.

The U.S. Dollar did a complete U-turn and retraced all of yesterday’s losses in one session, while Financials, which are negatively affected by lower rates, kept slipping and sliding.

It was a good day for the bulls, but we need continued steady upward momentum, which possibly could get a boost from the upcoming earnings season.

Read More

Fed Outlook Temporarily Lifts Equities, But Gains Fade Into The Close

Ulli Market Commentary Contact

[Chart courtesy of MarketWatch.com]
  1. Moving the markets

After an early dump, the markets stabilized mid-session, after the Fed softened its rate outlook and opined positively on the state of the economy. Some analysts likened the Fed’s statement to “folding like a cheap lawn chair,” as it dramatically slashed its stance on interest rates.

It seems, at least for the time being, that the Fed will hold rates steady this year before raising it once in 2020. If that pans out, according to ZH, it would be unprecedented:

Since the 1970s, there have been three times when the Fed held rates steady for more than a year after raising them in the precious three months: 2006, 2007 and 1997. Invariably, the next move was a rate cut.

However, as I pointed out yesterday, the market has gotten “greedy” and expects a rate cut of 16 bps in 2019. With that potentially not happening, equities surged at first but then faded quickly into the close leaving only the Nasdaq in the green.

It was a tale of many markets. On one hand, FANG stocks rallied but Financials got clobbered, along with Regional Banks, which comes as no surprise given the Fed’s dovish statement.

Bond yields got hammered with the 10-year now reaching 2.52%, its lowest since January 2018. The more obvious loser of the day was the U.S. Dollar, which crashed down to a level last seen early February. It has now been down 8 of the last 9 days after being up 7 days in a row. Keep in mind that lower bond yields affect the Dollar negatively.

In my advisor practice, I took advantage of the early pullback to add to our investment positions based on my assumption that the Fed would maintain its dovish bias and therefore pull the indexes out of the doldrums.

Read More