Below, please find the latest High-Volume ETF Cutline
report, which shows how far above or below their respective long-term trend
lines (39-week SMA) my currently tracked ETFs are positioned.
This report covers the HV ETF Master List from Thursday’s
StatSheet and includes 322 High Volume ETFs, defined as those with an average
daily volume of more than $5 million, of which currently 145 (last week 203)
are hovering in bullish territory. The yellow line separates those ETFs that
are positioned above their trend line (%M/A) from those that have dropped below
it.
In case you are not familiar
with some of the terminology used in the reports, please read the Glossary of Terms.
If you missed the original
post about the Cutline approach, you can read it here.
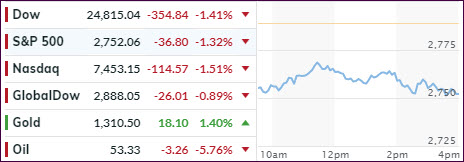
The markets got ambushed
last night after Trump’s announcement that tariffs on Mexico will be imposed as
of June 10th in order to force the country to stem the tide of the ever
increasing number of immigrants crossing the border into the U.S.
The tariff penalty was dramatic
in magnitude starting at 5% in June and increasing monthly by that same amount
until a level of 25% is reached, or until illegal immigration across the southern
border is stopped substantially.
This event was black-swan like
in that nobody saw it coming. Wordwide,
markets reacted accordingly and sold off with major indexes surrendering over
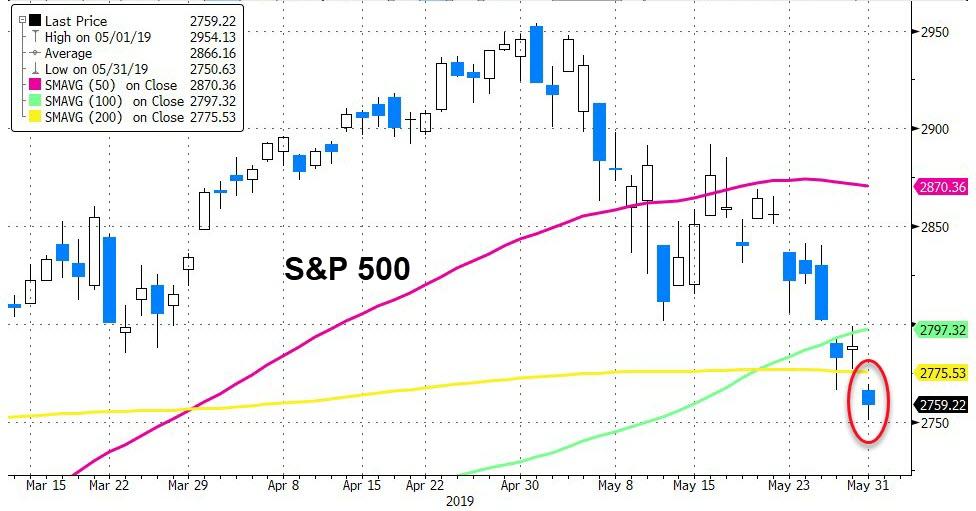
1.25% on the last day of an already miserable month. The S&P 500 not only broke
and closed below its 200-day
M/A but also had its biggest weekly drop since December, while Europe
scored its worst month since early 2016.
The risk has now increased
that the bears may have gained the upper hand, as bullish bumps have made room
for bearish selloffs, which means that a world-wide recession could very well
be on the horzion. Our International TTI has led the way so far and has crossed
into bear market territory with that ‘Sell’ signal being effective as of 5/30/19.
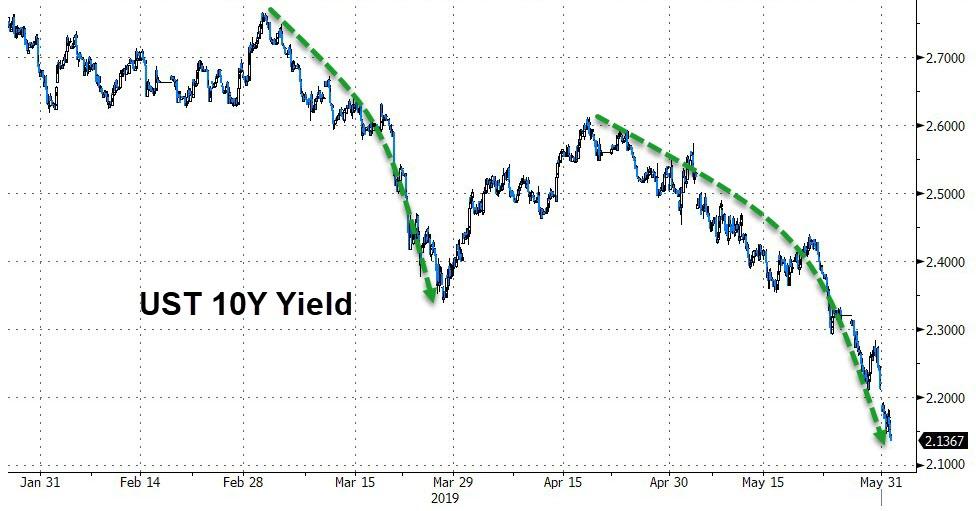
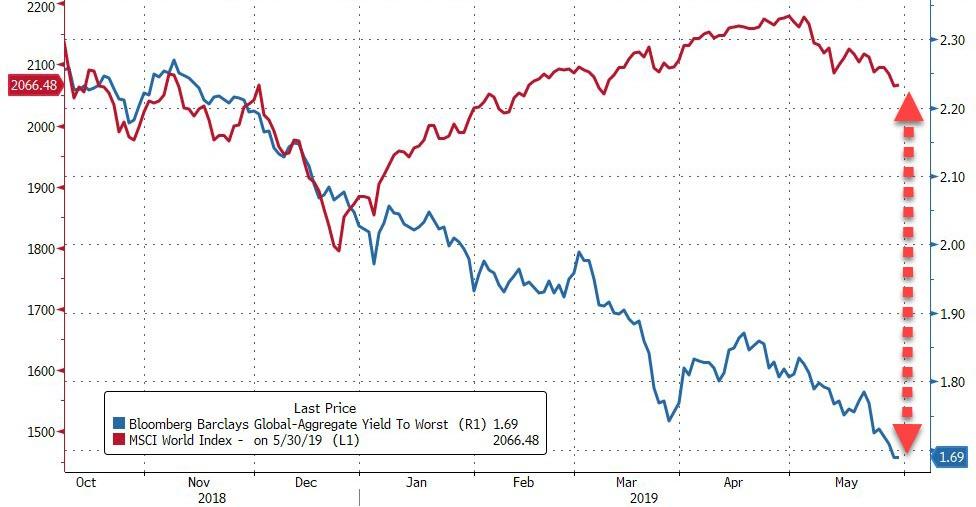
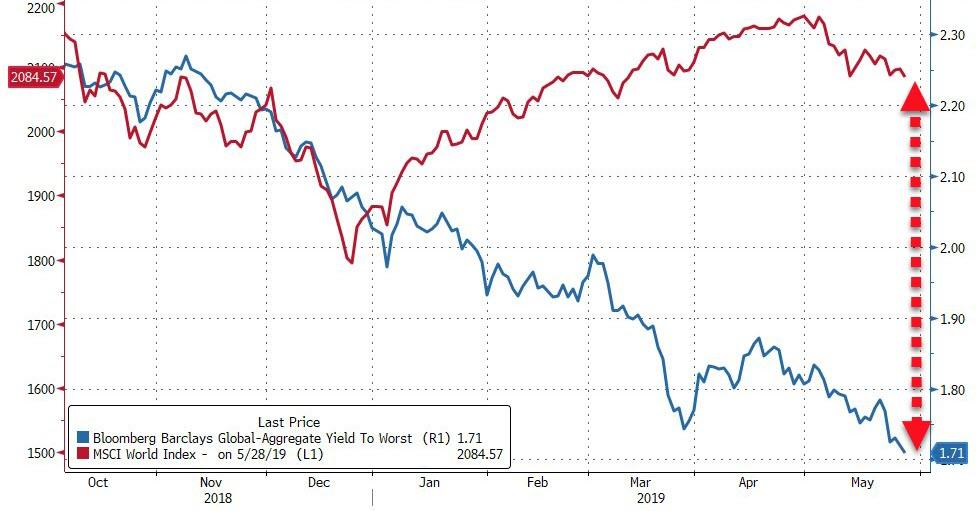
The bond market continued
its freefall
with the yield on the 10-year plunging to 2.13%, a level last seen in September
2017. Worldwide, the divergence between yields and equities continues, as this
chart shows. A synching up will occur at some point. However, if equities end
up “syncing down” to yields, that would mean a correction of some 29%. Ouch.
In the meantime, our Domestic
TTI has also crossed its trend line to the downside and into bear market territory
alerting us to a potential ‘Sell’ signal. See section 3 for details.
1. From the universe of over 1,800 ETFs, I have selected only those with a
trading volume of over $5 million per day (HV ETFs), so that liquidity and a
small bid/ask spread are assured.
2. Trend Tracking Indexes (TTIs)
Buy or Sell decisions for Domestic and International ETFs (section 1 and
2), are made based on the respective TTI and its position either above or below
its long-term M/A (Moving Average). A crossing of the trend line from below
accompanied by some staying power above constitutes a “Buy” signal. Conversely,
a clear break below the line constitutes a “Sell” signal. Additionally, I use a
7.5% trailing stop loss on all positions in these categories to control
downside risk.
3. All other investment arenas do not have a TTI and should be traded
based on the position of the individual
ETF relative to its own respective trend line (%M/A). That’s why those signals
are referred to as a “Selective Buy.” In other words, if an ETF crosses its own
trendline to the upside, a “Buy” signal is generated. Since these areas tend to
be more volatile, I recommend a wider trailing sell stop of 7.5% -10% depending
on your risk tolerance.
If you are unfamiliar with some of the terminology, please see Glossary of Termsand new subscriber information in section 9.
1. DOMESTIC EQUITY ETFs: BUY
— since 02/13/2019
Click on chart to enlarge
Our main directional indicator, the Domestic Trend Tracking Index (TTI-green line in the above chart) is now positioned above its long-term trend line (red) by +0.37% after having generated a new Domestic “Buy” signal effective 2/13/19 as posted.
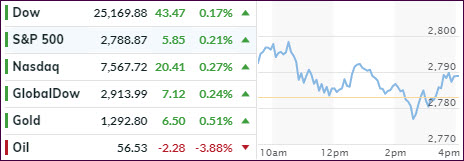
For
a change, the markets opened slightly to the upside, before a slow and steady
decline pulled the major indexes into the red, however, a last hour buying
effort saved the day and we ended up modestly in the green.
While
the trade war battle continued in full swing, Wall Street traders apparently
decided to take a break from the constant stream of news, including the accusation
by China that the U.S. uses “naked
economic terrorism,” “economic
bullying” and the assertion that they will “fight until the end.”
Regarding
economic news, we learned that after weakness in new- and existing-home sales
in April, the pending ones were expected to do better, but no dice. Instead pending
sales slipped -1.5% MoM, its worst decline since the financial crisis in 2008.
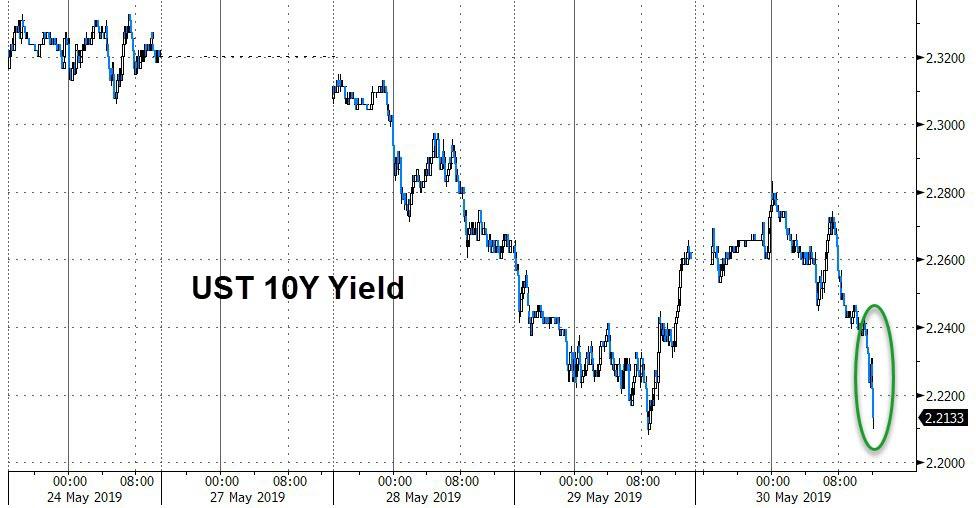
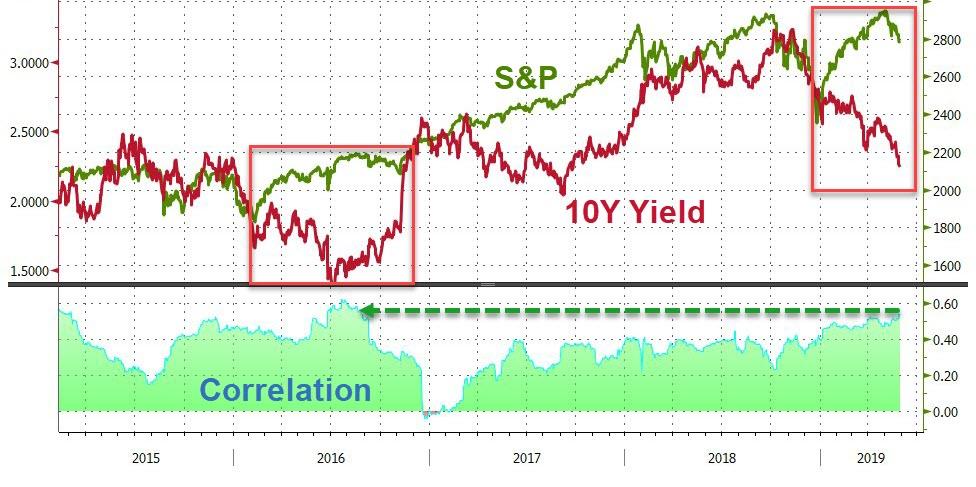
The
bond market continues to paint an ugly picture with the 10-year
yield plunging again after a late rebound yesterday. This prompted ZH to post
this
chart with the at this point unanswerable question “will the relationship between the S&P 500 and the 10-year yield
revert like in 2016 (higher rates) or 2007 (lower equity prices)?”
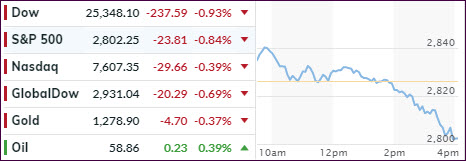
Yesterday’s
market dive into the close had indeed dire consequences, as the major indexes
opened down without their usual morning bump. The Dow at one time had given back
some 400 points but managed to recoup some of these losses late in the session,
as did the S&P 500 and Nasdaq.
It
was a one-two punch with trade tensions and global growth uncertainties combining
to spook Wall Street, while bonds benefited from fears that the bears may get the
upper hand. Global
stocks have started to roll over as bond yields collapsed indicating
economic weakness.
The
Dow lost its 25k marker but managed to recover and close above it. The S&P
500 dropped below its widely watched 200-day M/A but was able to recoup that technically
important level by a few points.
As
I mentioned yesterday, our International Trend Tracking Index (TTI) had already
been meandering below its long-term trend line, and it fell sharply during today’s
session. Along with another lower close, this confirmed a new ‘Sell’ signal for
that arena, which is defined as “broadly
diversified international ETFs and mutual funds.”
For
tracking purposes, the effective date will be tomorrow, May 30, 2019, although
I already took the opportunity today to liquidate clients’ holdings.
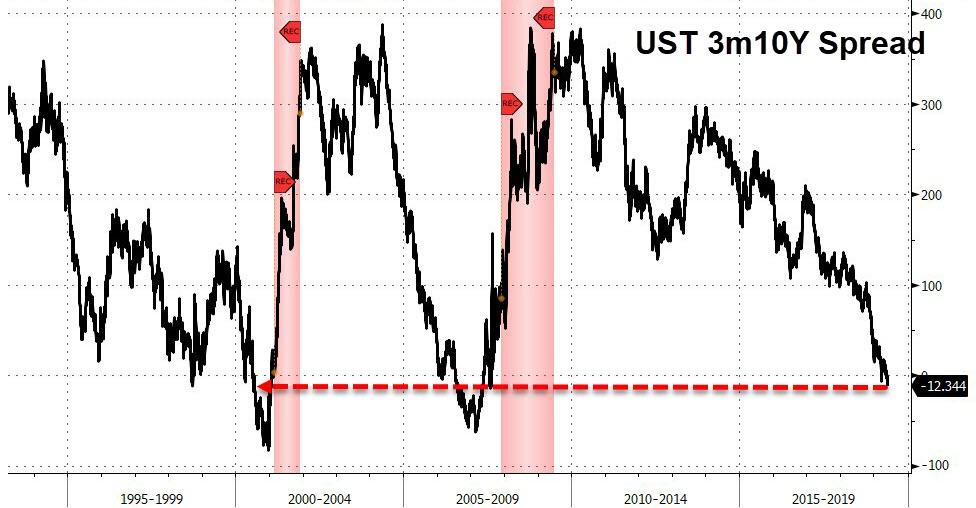
There
are stresses in bond markets wherever you look, including here in the U.S. as
the 3-month/10-year spread has collapsed to new cycle lows, as this
chart shows. What that simply means is that a 3-month T-bill will give you a
higher yield than a 10-year bond. Huh?
These
oddities usually occur at major inflection points in the markets, which our
TTIs are already pointing to. Even our Domestic TTI, which a week ago was in solid
bullish territory, has reached a point that is now within shouting distance of
signaling a ‘Sell’ signal as well. (see section 3 for details)
What
could turn these deteriorating markets around? Right now, there are two things.
First, an announcement by the U.S. and China that a trade settlement has been reached
and second, a move by the Fed declaring that interest rates will be sharply
slashed. And let’s not forget that the PPT (Plunge Protection
Team) could always be called upon to drive equities back up.
I
will not wait around for either to happen and will execute our ‘Sell’ signals as
they are being generated, because currently the downside risk looks far greater
than the upside potential.
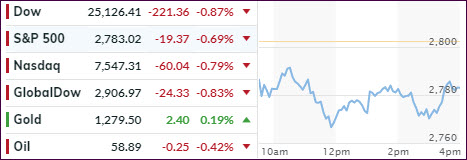
An
early bounce, which looks to have been of the dead-cat nature, lost momentum, first
slowly and then quickly. The major indexes ended up diving into the close and scoring
their low of the day as the final bell rang—not a good omen for tomorrow’s opening.
Early
in the session, we saw some misplaced optimism regarding the ever-dangling China
trade carrot, but as tensions between the warring parties heated up, supported
by tit-for-tat escalations, the bulls threw in the towel and down we went.
Helping
to put the final nail in the trade coffin was Trump’s comment during a news conference
in Japan that the U.S. wasn’t ready to make a deal with China. That was
followed by “tariffs on Chinese products
could go up very substantially.” Even the speed-reading computer algos
could not misinterpret what had been said.
On
the econ data front, we learned that while home prices rose in March by +0.1%,
it was, however, the slowest annual pace since August 2012. For a positive change,
we saw Consumer Confidence rise to 134.1 from 129.2 in April, which was above economists’
expectations of 130.
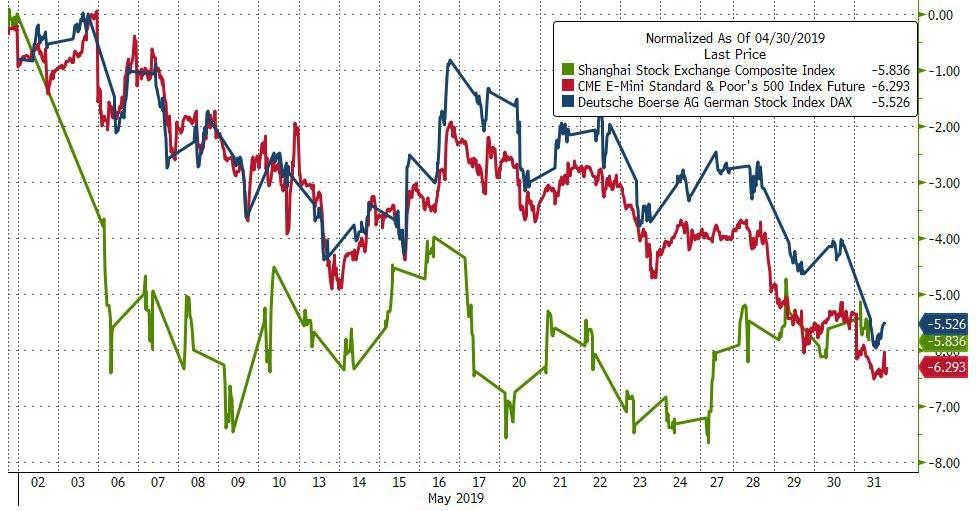
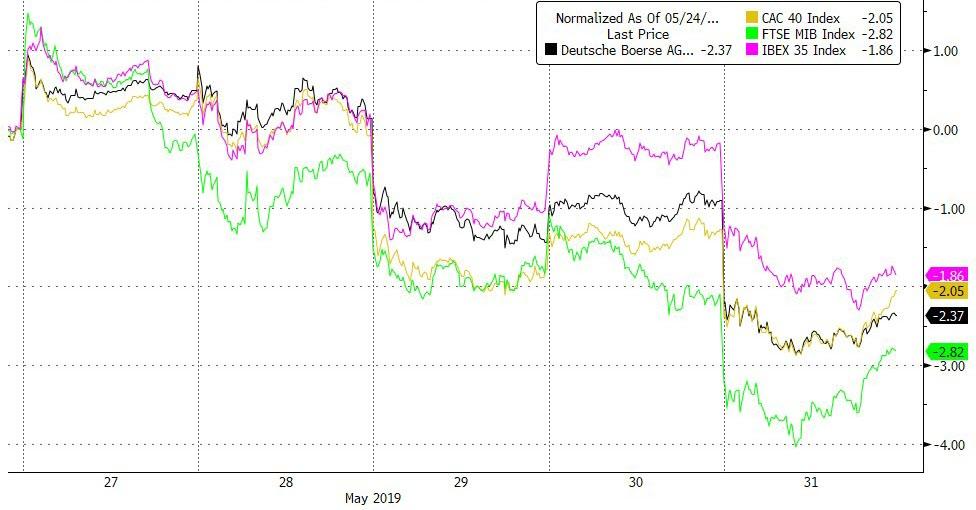
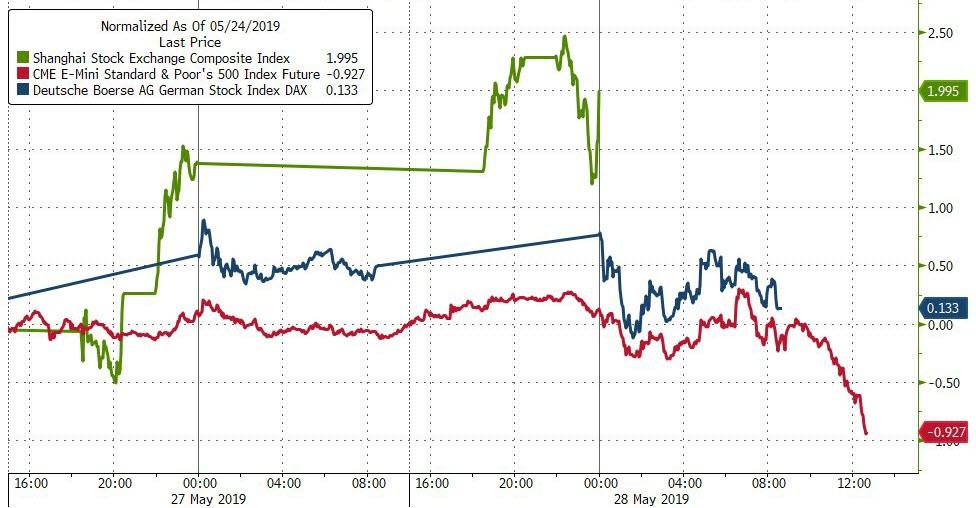
In
the bigger picture, it’s interesting to note that the U.S. stock market ended
up far worse than Europe and China, as this
chart demonstrates. And that despite expectations that month-end pension
rebalancing might spark new buying but, there are still a few days left.
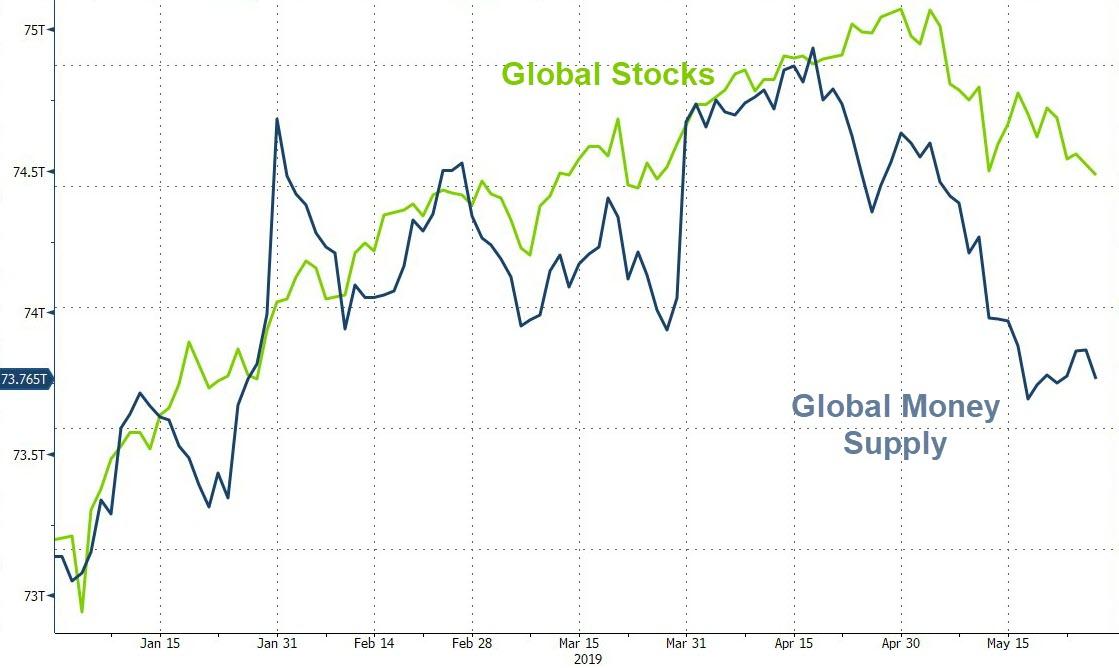
On
the other hand, the picture of a slowdown in global
money supply, and its effect on stocks, continues to worsen, which is
showing up in our International Trend Tracking Index (TTI). This indicator has
already moved into bearish territory, but just not yet to a large enough
margin, to push the ‘Sell’ button. However, this picture could change quickly.

