Early Sell-Off—Late Day Recovery

Ulli Market Commentary Contact

[Chart courtesy of MarketWatch.com]
  1. Moving the markets

Yesterday, the markets closed on a sour note by scoring their lows for session in the final seconds of trading. That usually does not bode well for the next day’s opening, and today was no exception.

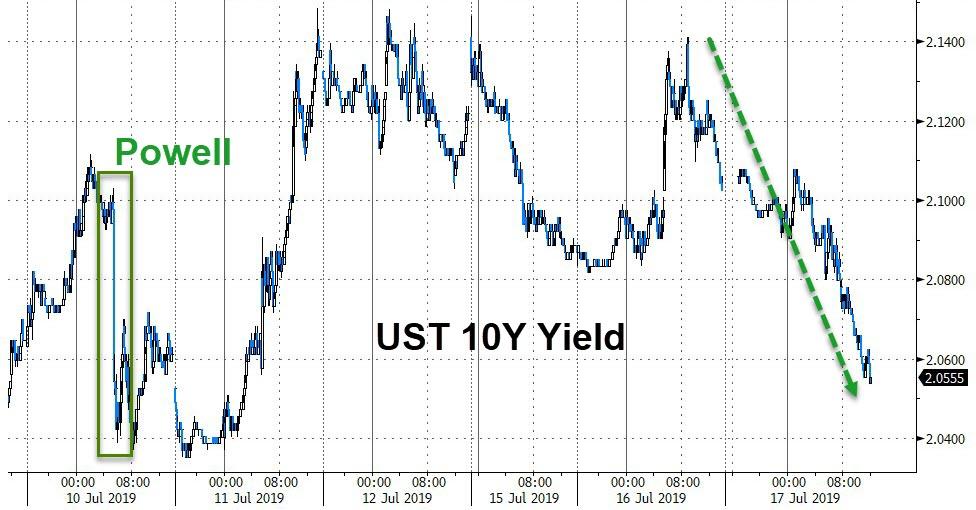
The major indexes slipped early on but managed to rebound by mid-day with fresh upward momentum pushing equities into the green, caused by the Fed’s Williams opining that:

interest rates should be cut as insurance against an economic downturn,”

And

 “when you have only so much stimulus at your disposal, it pays to act quickly to lower rates at the first sign of economic distress.

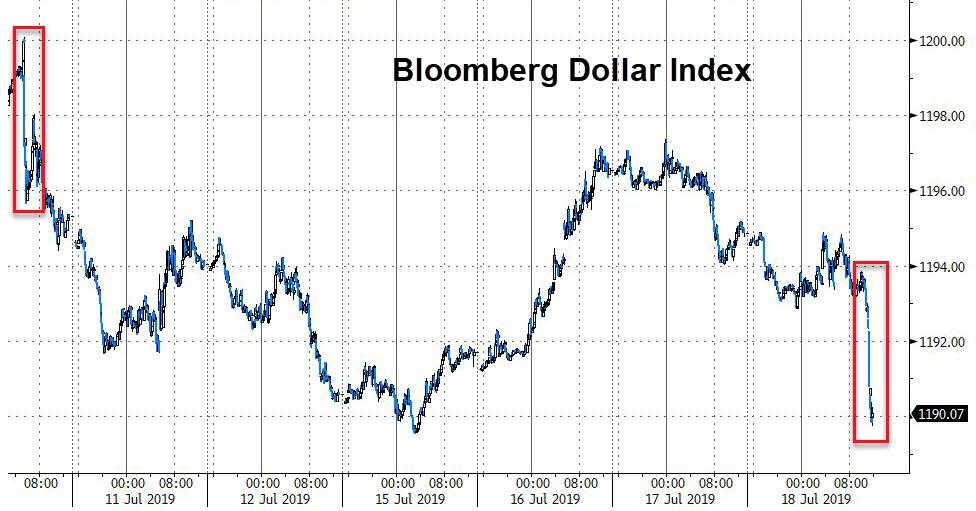
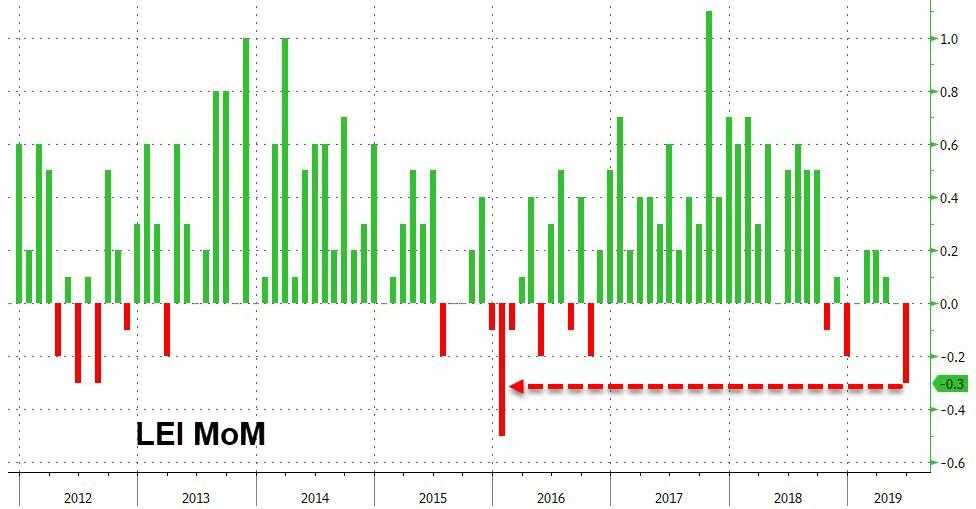
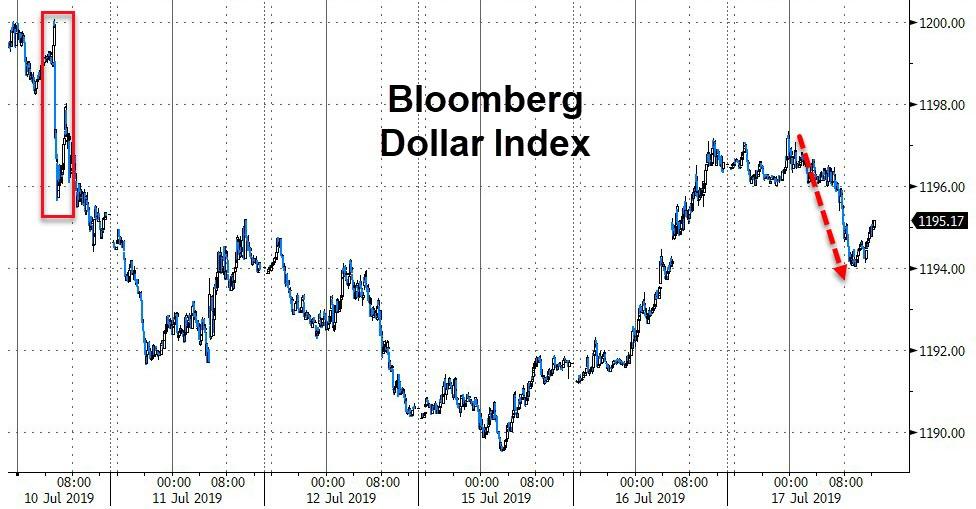
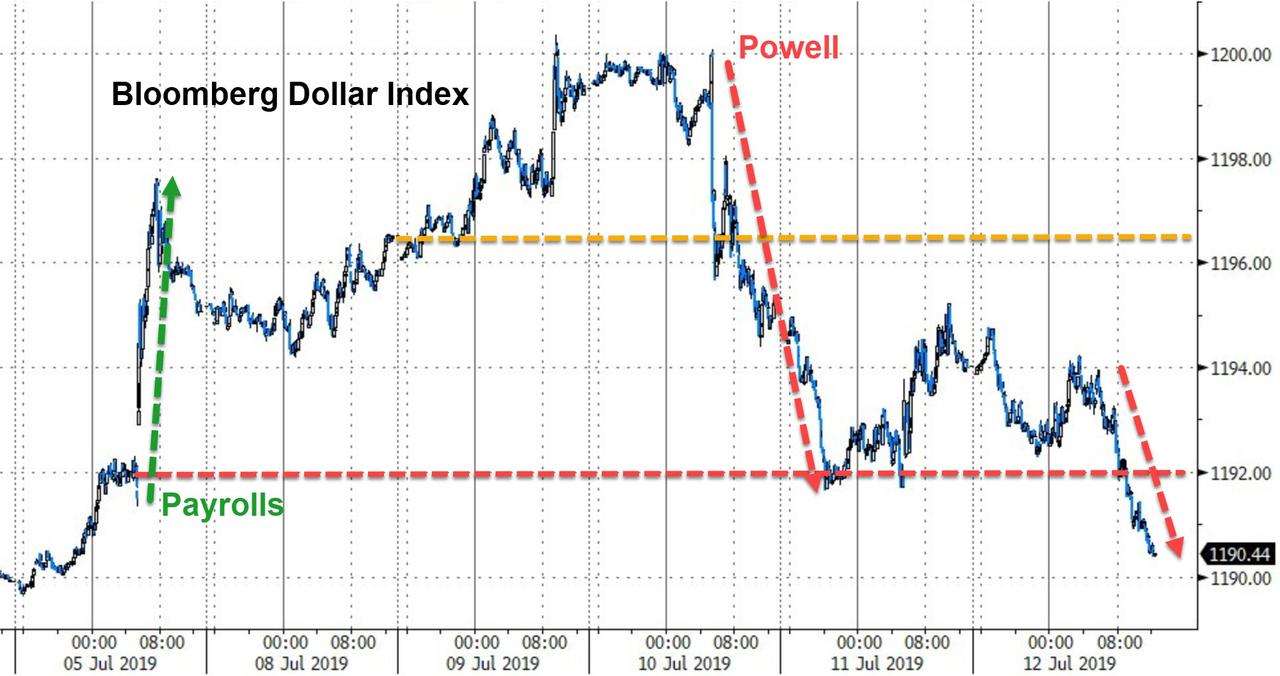
That pretty much saved the day for stocks but took the starch out of the US dollar, as the latest Leading Indicators headline did not help matters. They slumped the most in over 40 months by tumbling -0.3% in June, which was their biggest MoM drop since early 2016.

Then the WSJ reported that trade-deal negotiations between the U.S. and China had hit a snag (what else is new?) raising doubts about whether the warring parties can ever reconcile their differences.

On the earnings front, things were mixed at best with Netflix being the loser of the day by surrendering almost -11%. This was due to a bad miss on expectations for new paying subscribers.

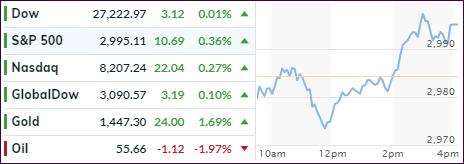
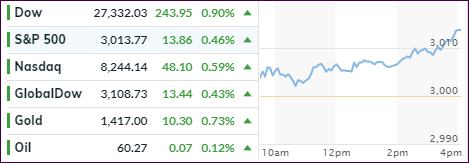
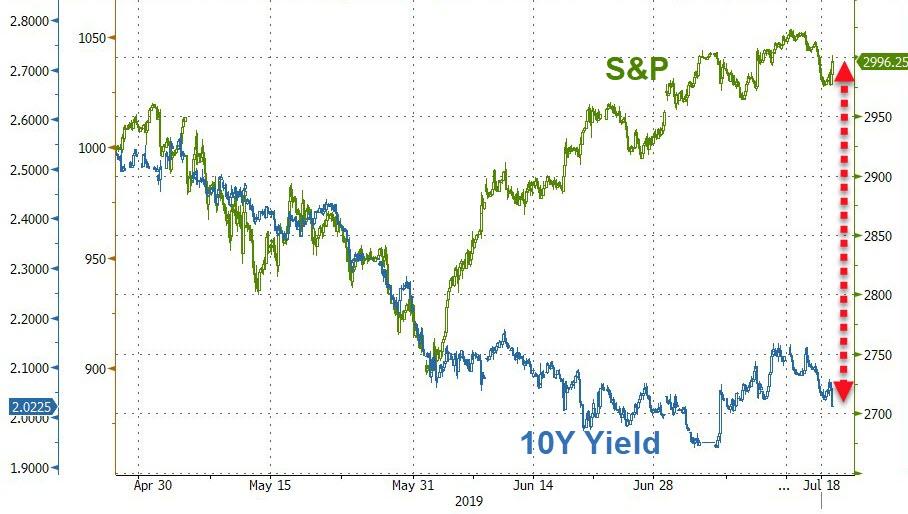
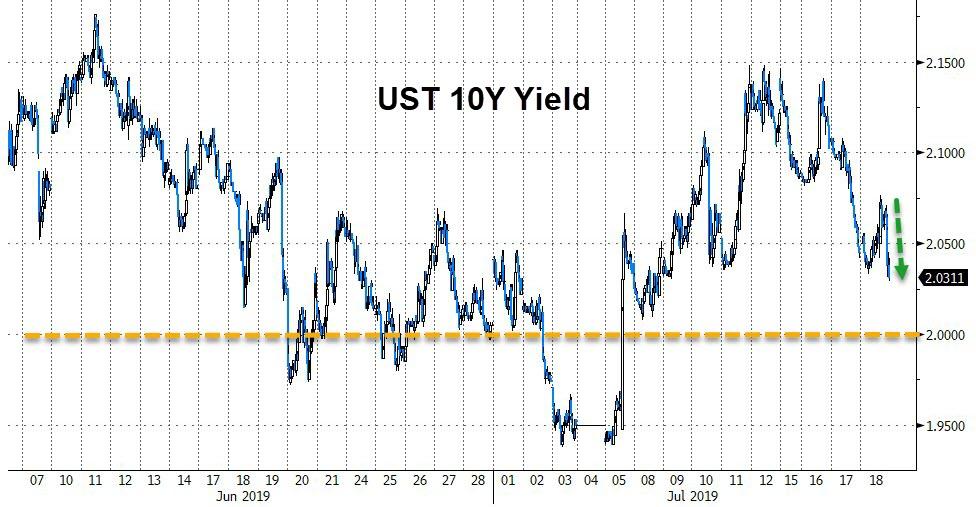
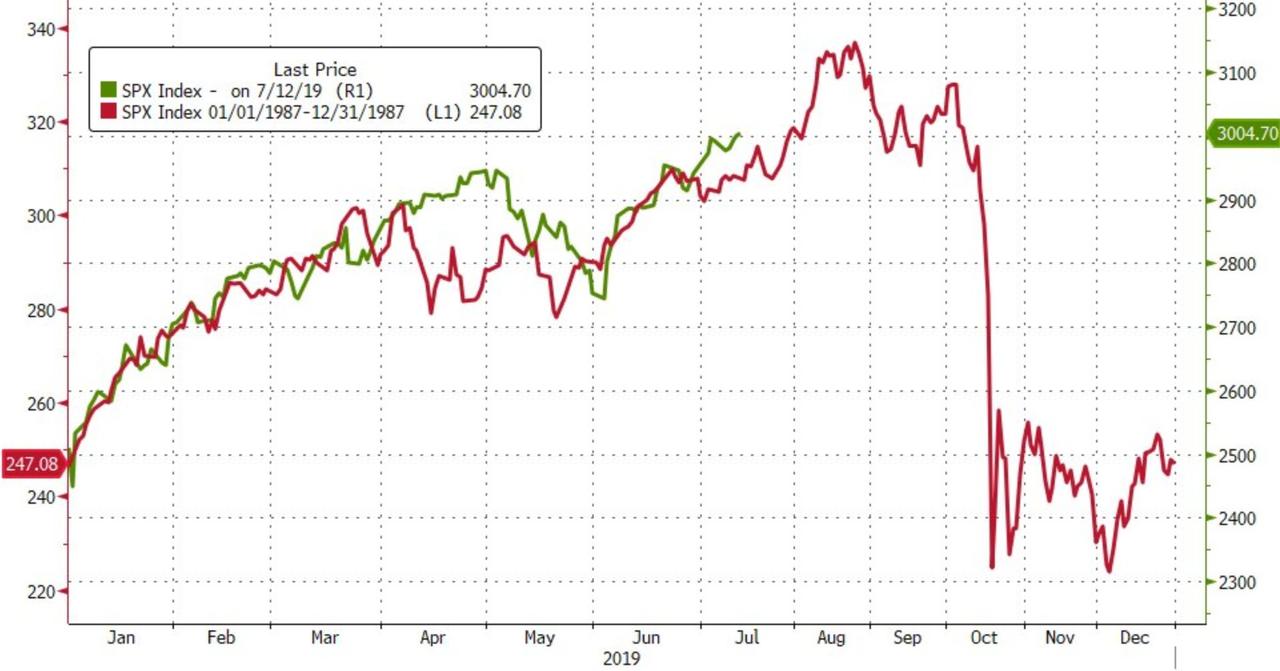
In the end, the S&P 500 failed to reclaim its recently lost 3k marker, while the Dow barely held on to a green close. The decoupling between the S&P 500 and the 10-year yield continues uncompromisingly, the latter of which has been now trending back towards the 2% level.

Read More

The Fizzle Continues

Ulli Market Commentary Contact

[Chart courtesy of MarketWatch.com]
  1. Moving the markets

There was not much motivation on the part of the bulls to engage and keep this market from fizzling. The big three, namely lack of progress on the trade dispute with China, mixed earnings results and weak headlines for economic numbers, combined to create a lackluster session.

In other words, the recently observed last 30-minute pump was only a distant memory causing the major indexes, who spent most of the day below their unchanged lines, to dive into the close. The losses were moderate, given the recent relentless push into record territory, but it appeared that we simply ran out of steam.

Not helping matters were Building Permits, which plummeted the most in 3 years (-6.1% MoM) putting another nail in the coffin of weak home sales data and mortgage applications, despite ongoing low interest rates. ZH reported that Housing Starts followed suit and dropped -0.9% MoM (vs. -0.7% expected).

Bond yields headed lower again with the widely held 10-year having almost made up the losses sustained in the last week, when we hovered around the 2.14% marker, which is quite a drop to today’s 2.06%. At the same time, the US Dollar pulled back, while Oil continued its downward spiral after a de-escalation of tensions with Iran.

Only about 7% of the S&P 500 companies have reported earnings so far, so we certainly will have more surprises on deck, any of which can push the markets in either direction.

Read More

Treading Water

Ulli Market Commentary Contact

[Chart courtesy of MarketWatch.com]
  1. Moving the markets

It was a tug-of-war between news stories that kept traders on edge with some headlines causing a sell-off, others creating a recovery, but in the end, the major indexes closed in the red.

We didn’t see the usual last 30-minute rebound due to Trump’s comments that “trade has a long way to go,” as well as bank earnings, which painted a mixed picture of the economy and the financial services arena.

Fed chair Powell chimed in from a speech in France that the “economic outlook hasn’t improved since the last FOMC meeting in June,” which instilled hope that the stage for an interest rate cut later this month appears to be set.

This view was crushed a little bit when June retail sales were released. They exceeded expectations by surging 0.7% MoM, which translates to 4.6% YoY, the most in 12 months. That ended up being a discouragement for the low interest rate crowd. After all, if the consumer, which accounts for 67% of GDP, is spending, why would we need a rate cut?

The loser of the day was oil prices, which tanked -2.64% and had a wild ride throughout the session, but in the end the administration’s willingness to “talk to Iran,” took the starch out of the early rally and gave the bears something to cheer about.

Market behavior today when compared with history may very well be random and totally meaningless. However, it’s interesting to note the similarities when looking at the S&P 500 in 2019 compared to 1998. A tip of the hat goes to ZH for this chart.

Read More

Markets Under Pressure; Earnings Season On Deck

Ulli Market Commentary Contact

[Chart courtesy of MarketWatch.com]
  1. Moving the markets

Throughout today’s session, equities were under pressure due to the looming earning season. Traders were a bit anxious to find out if some of the poor economic data points of the last quarter, or the U.S.-China trade war, are having an impact on companies’ bottom lines.

The major indexes spent most of the day below their respective unchanged lines, although by only a tiny margin, but managed to close in the green thanks to the usual last 30-minute pump.

China posted its weakest economic growth in 27 years by growing only 6.2%. One analyst did not see this as a cause for concern, since “a further round of monetary-policy stimulus has helped to soften the impact of a relatively weak GDP print.”

On the domestic side, it’s interesting to note that SmallCaps are continuing to collapse relative to LargeCaps, which this long-term chart makes abundantly clear.

This is somewhat strange when considering the negative effects of the U.S.-China trade war should weigh far more on large-cap multinational companies rather than on more domestically oriented small-cap companies.

Be that as it may, right now, the focus is on earnings season, and it will be interesting to see what directional market effect it might have.

Read More

ETFs On The Cutline – Updated Through 07/12/2019

Ulli ETFs on the Cutline Contact

Below, please find the latest High-Volume ETF Cutline report, which shows how far above or below their respective long-term trend lines (39-week SMA) my currently tracked ETFs are positioned.

This report covers the HV ETF Master List from Thursday’s StatSheet and includes 322 High Volume ETFs, defined as those with an average daily volume of more than $5 million, of which currently 278 (last week 279) are hovering in bullish territory. The yellow line separates those ETFs that are positioned above their trend line (%M/A) from those that have dropped below it.

Take a look:                                                                   

The HV ETF Master Cutline Report

In case you are not familiar with some of the terminology used in the reports, please read the Glossary of Terms. If you missed the original post about the Cutline approach, you can read it here.      

ETF Tracker Newsletter For July 12, 2019

Ulli ETF Tracker Contact

ETF Tracker StatSheet          

You can view the latest version here.

BANKING ON A FED RATE CUT

[Chart courtesy of MarketWatch.com]
  1. Moving the markets

Yesterday’s rally continued this morning and accelerated throughout the session, as traders were now convinced that a rate cut by the Fed is a sure thing, so front running was the name of the game.

Since Fed chair Powell’s 2-day congressional testimony did not include any negatives, but rather words like the U.S. economy is in a “very good place,” traders felt invigorated that a cut was coming, so the bullish theme continued.

Even a stronger-than-expected U.S. inflation print in core producer prices could not put a dent in current enthusiasm, with further support coming from hopes the global economy will slow even more, forcing the Fed’s hand for a possible 0.5% reduction in rates.

One analyst summed it up like this:

This is one of those mornings where bad news is good news for stocks, while good news is bad news for bonds… or in other words, any news is good for stocks.

The bullish view did not carry through all investment arenas. Chinese, European and Small Caps all lost for the week. Bond yields suffered, especially in Germany where the 10-year spiked the most since the middle of 2017, as prices collapsed.

Same here in the U.S. with specifically the 30-year yield jumping to 7-week highs, as the dollar corrected back down after its surge following the payroll announcement.

Things appear very uncertain and confusing, when looking at the big picture, which led BofA to release the following statement:

“…we anticipate an “overshoot” in credit & equity prices in coming months, followed by an overshoot in gold (US$ devaluation) before big H2 top in asset prices (as bond bubble pops & policy impotence visible).”

That prompted ZeroHedge to update this chart, which suggests that a picture is worth a thousand words.

Read More