
- Moving the market
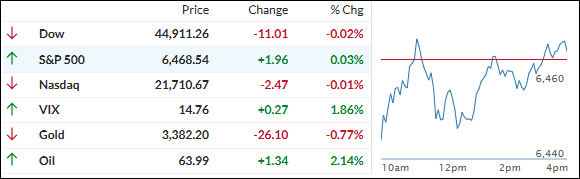
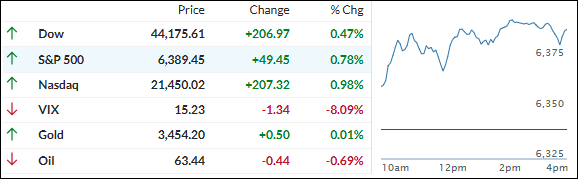
Stocks stumbled out of the gate today after a much hotter-than-expected wholesale inflation report rattled traders and threatened the recent rally. The major indexes clawed their way back from early losses but by the closing bell were basically stuck at flat.
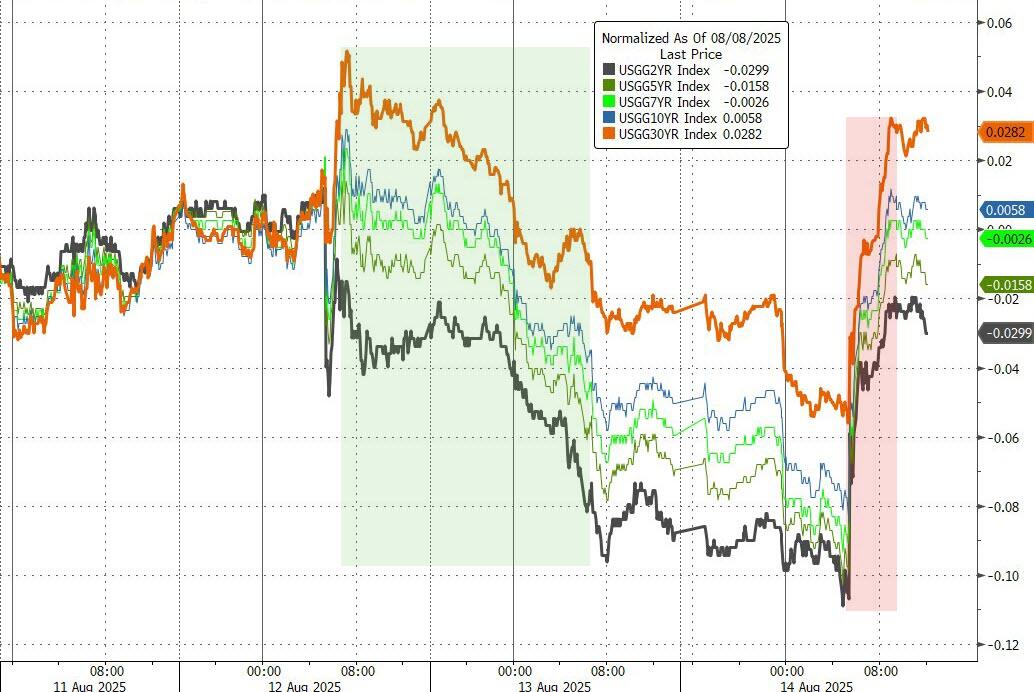
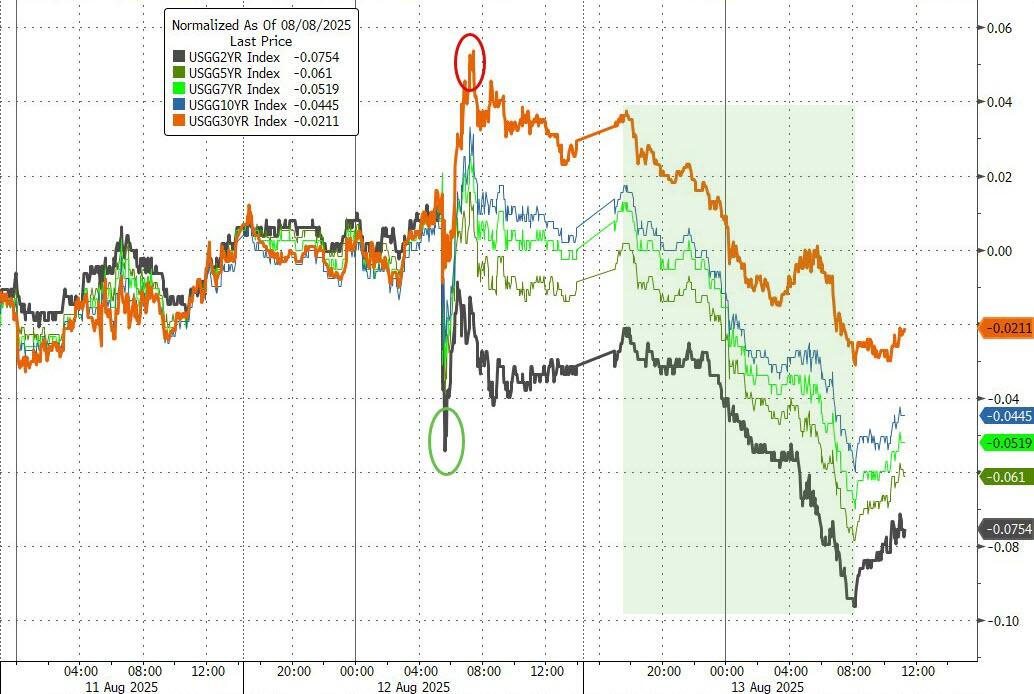
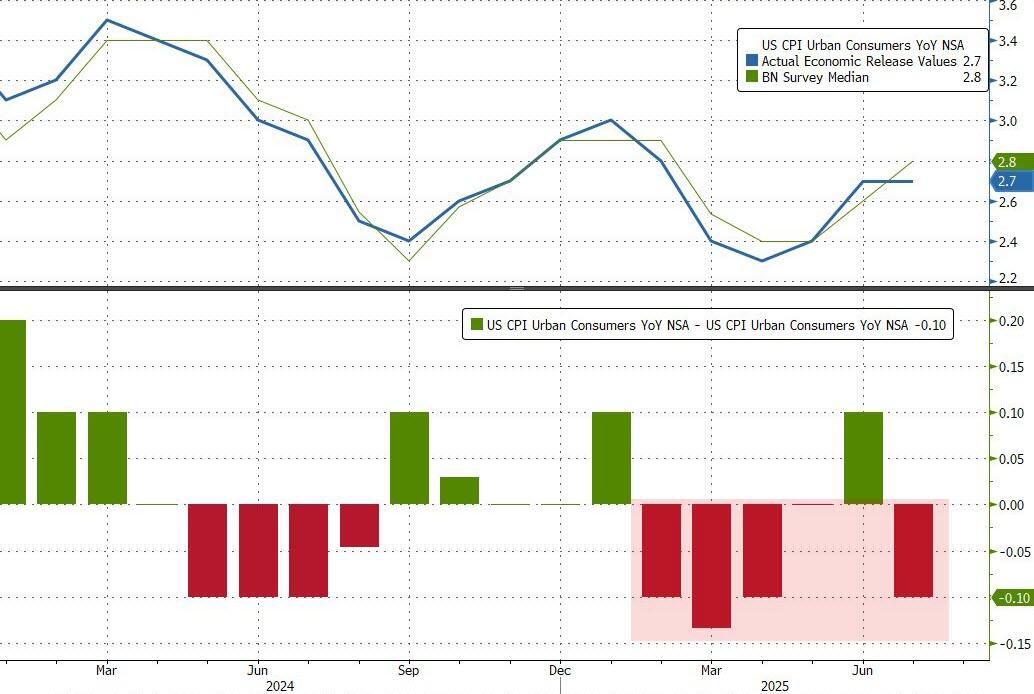
The initial slide came right after July’s Producer Price Index (PPI) showed wholesale prices jumping 0.9% for the month—way above the 0.2% economists had forecast, and the biggest monthly jump in three years.
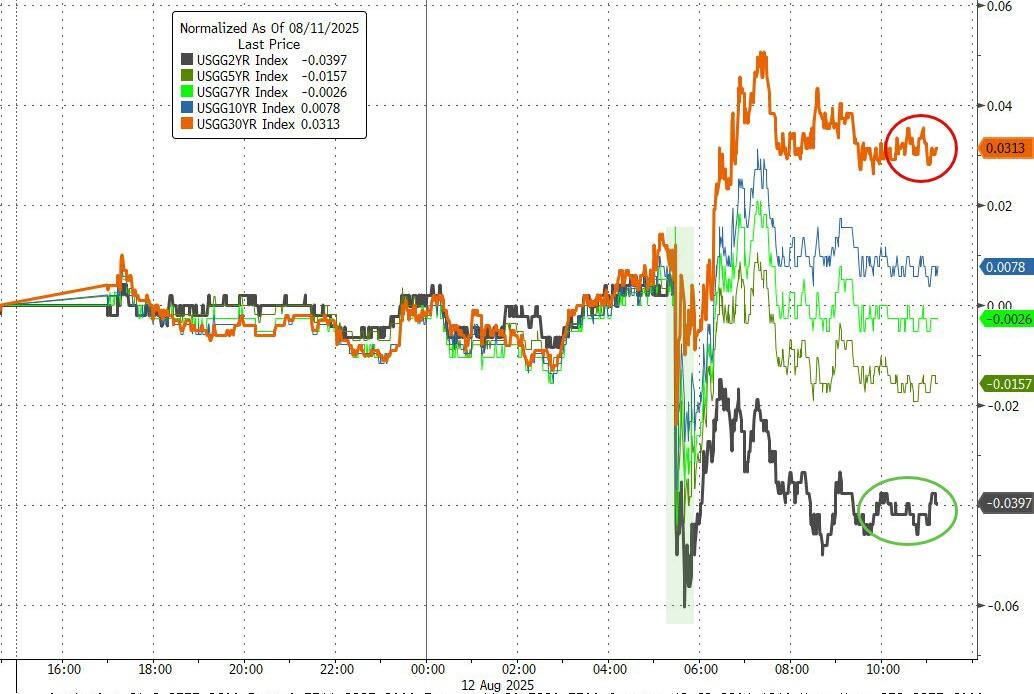
That’s got Wall Street rethinking just how soon—and how much—the Fed might be able to cut rates. Even so, fed funds futures still show nearly 93% odds of a rate cut in September, just a shade lower than before.
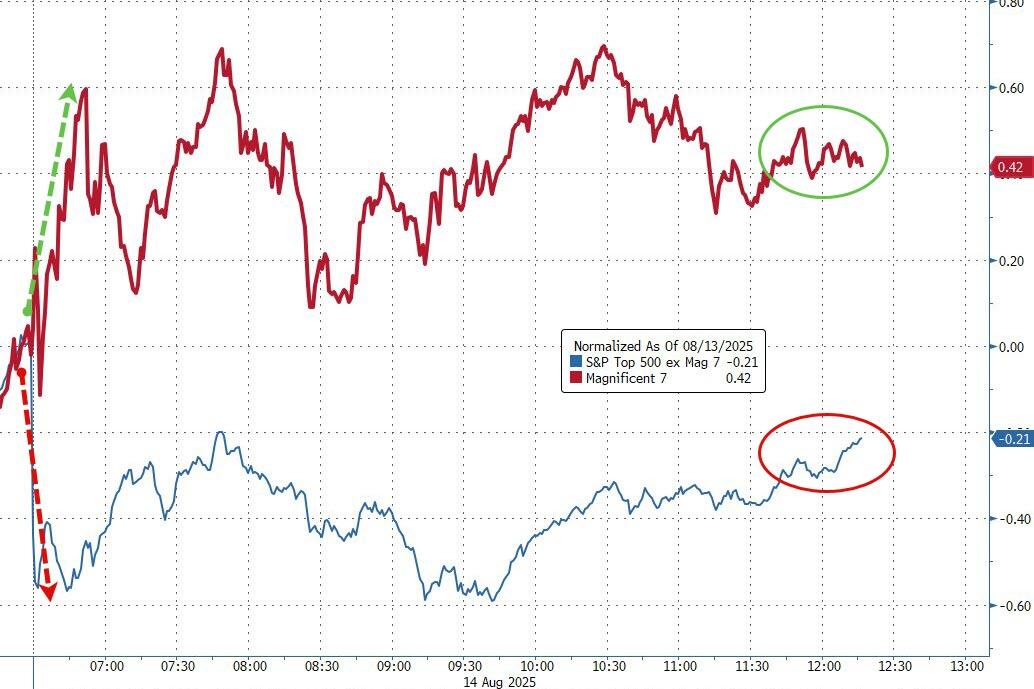
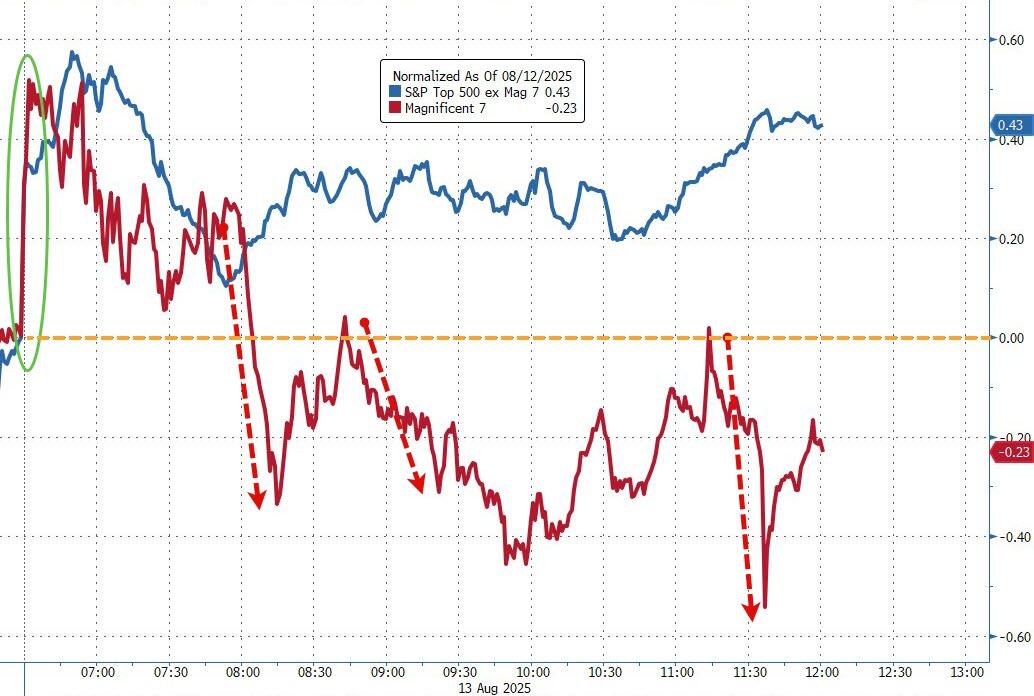
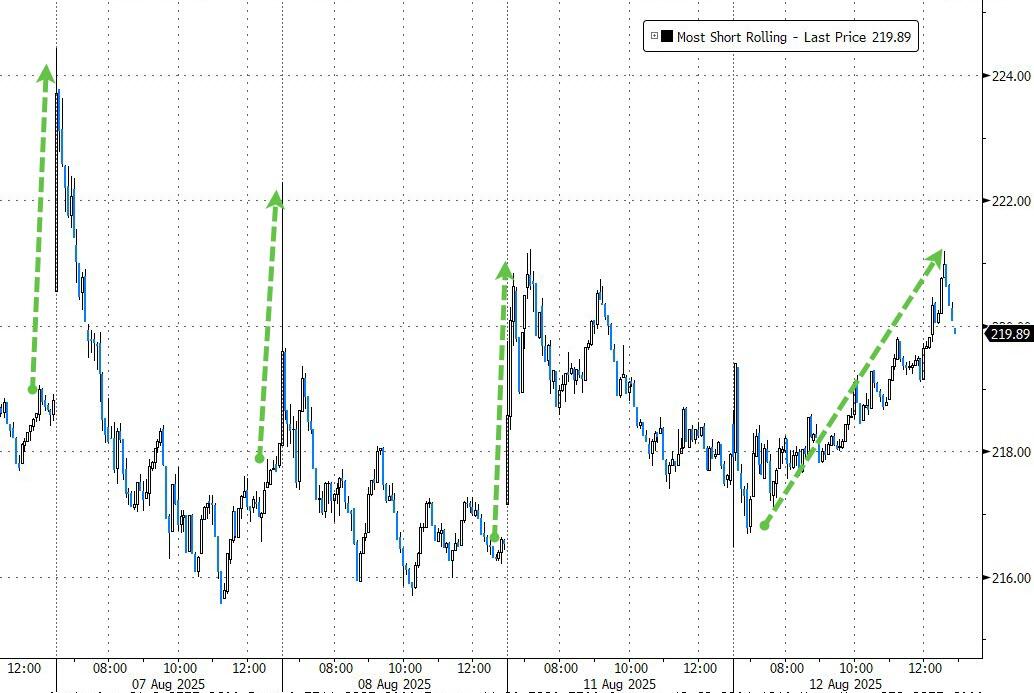
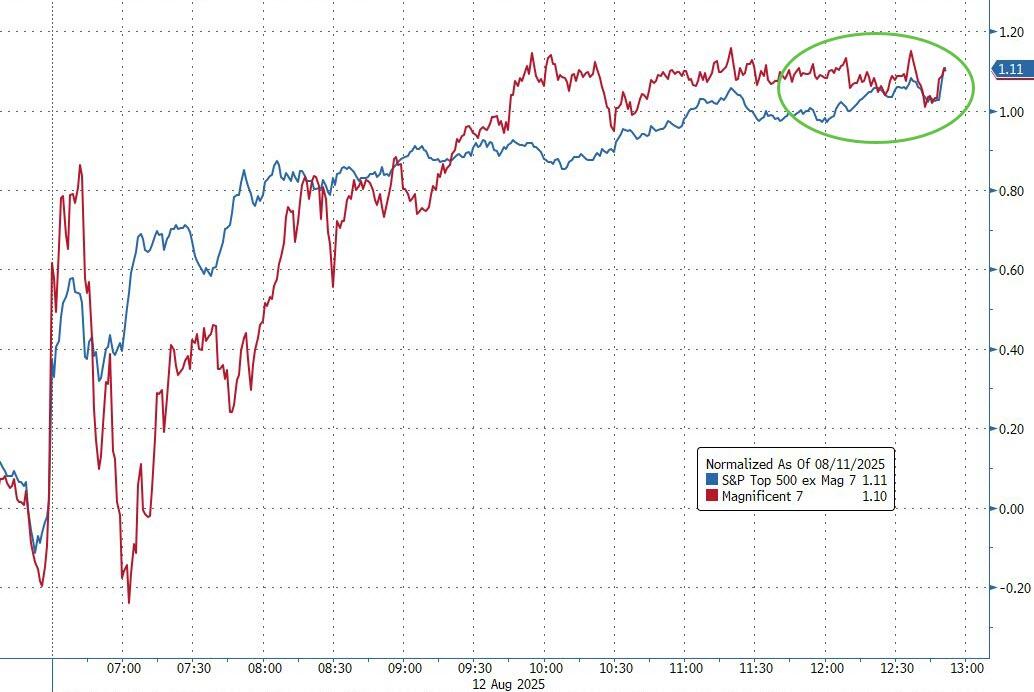
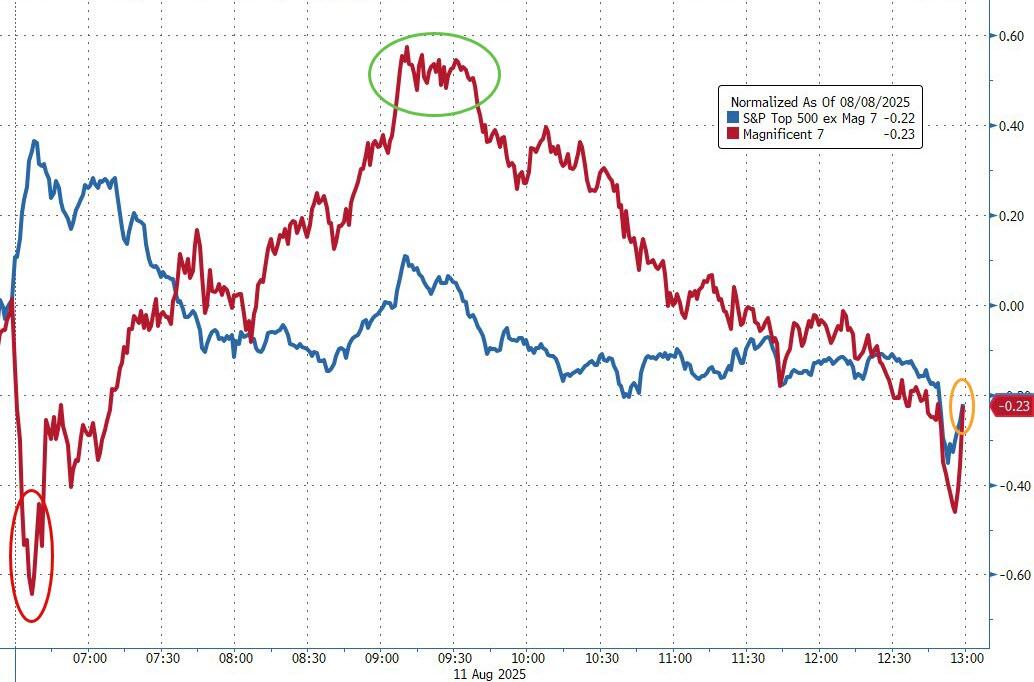
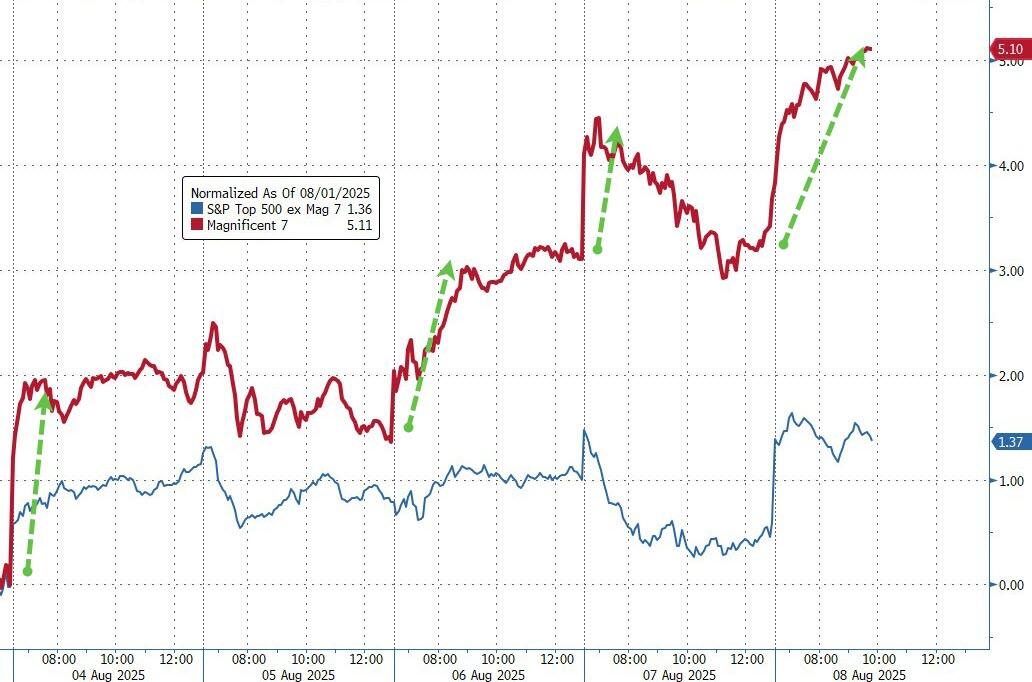
Despite the inflation scare, traders rotated back into big tech. Names like Nvidia, Amazon, and Microsoft helped the market recover from its worst levels, with the Mag7 stocks doing the heavy lifting once again.
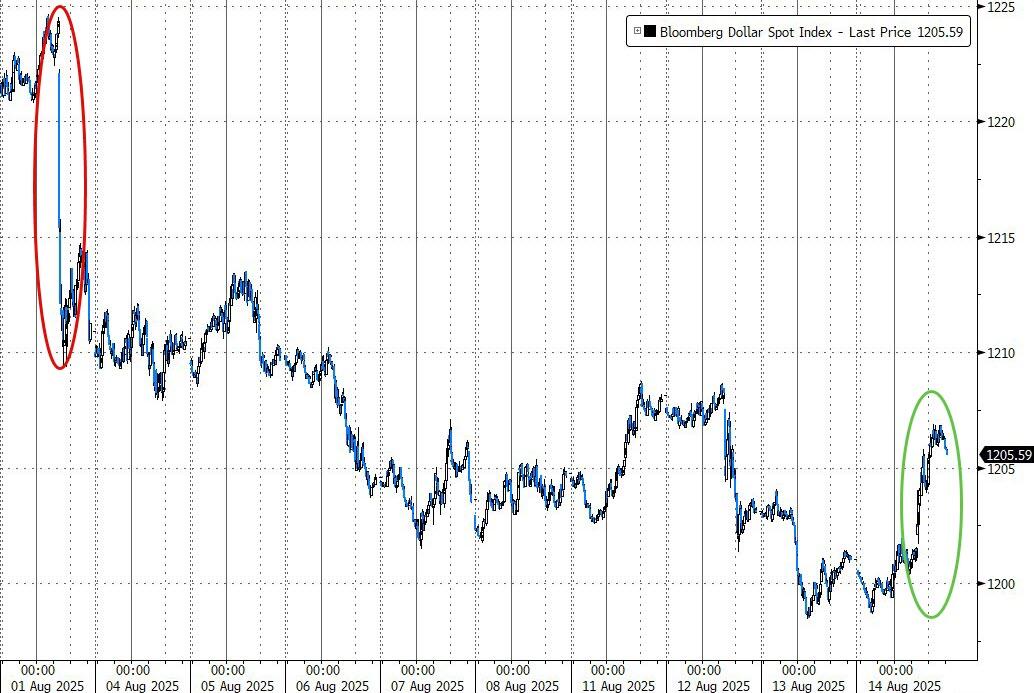
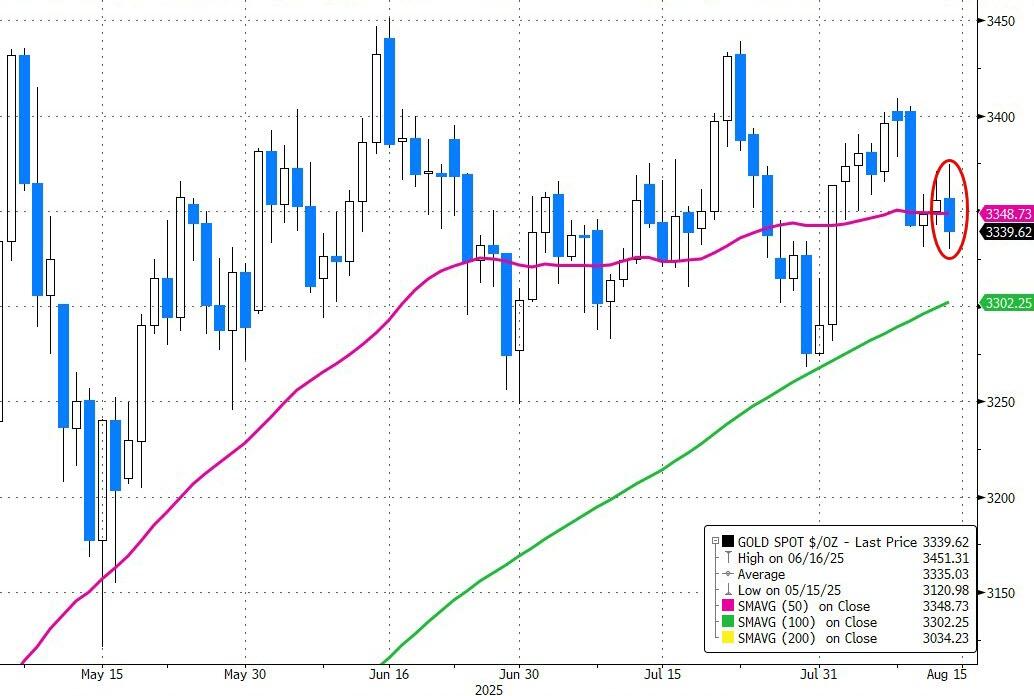
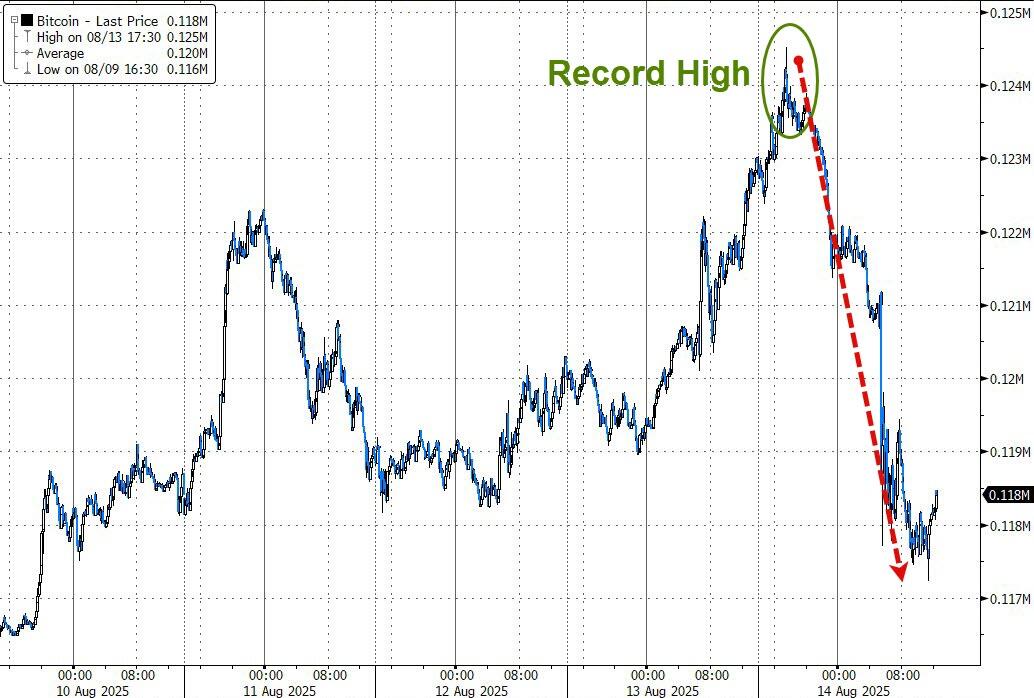
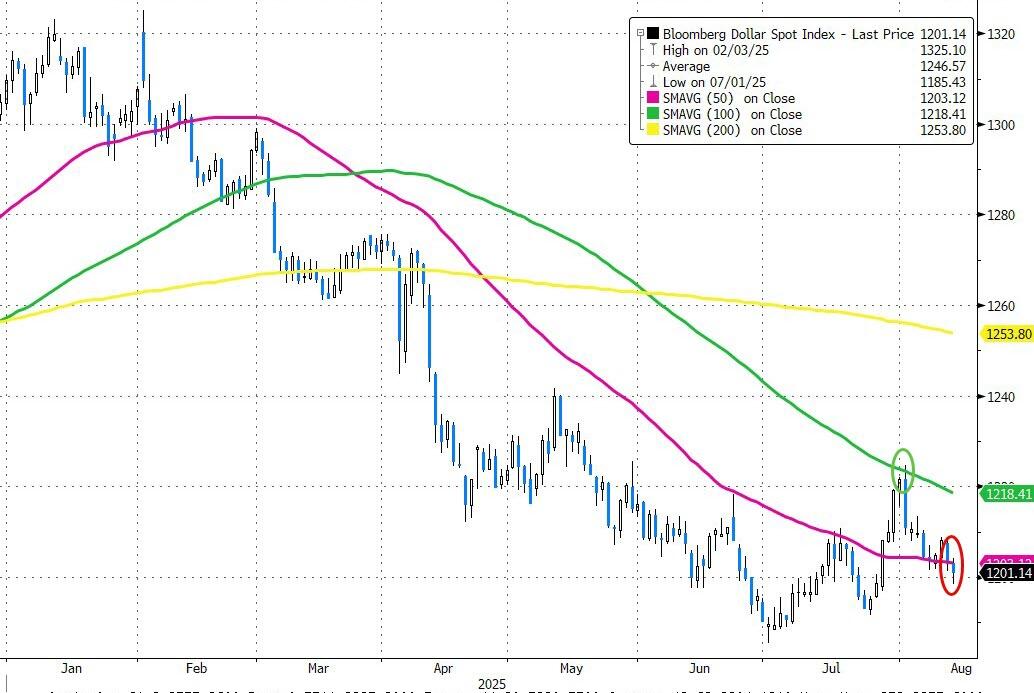
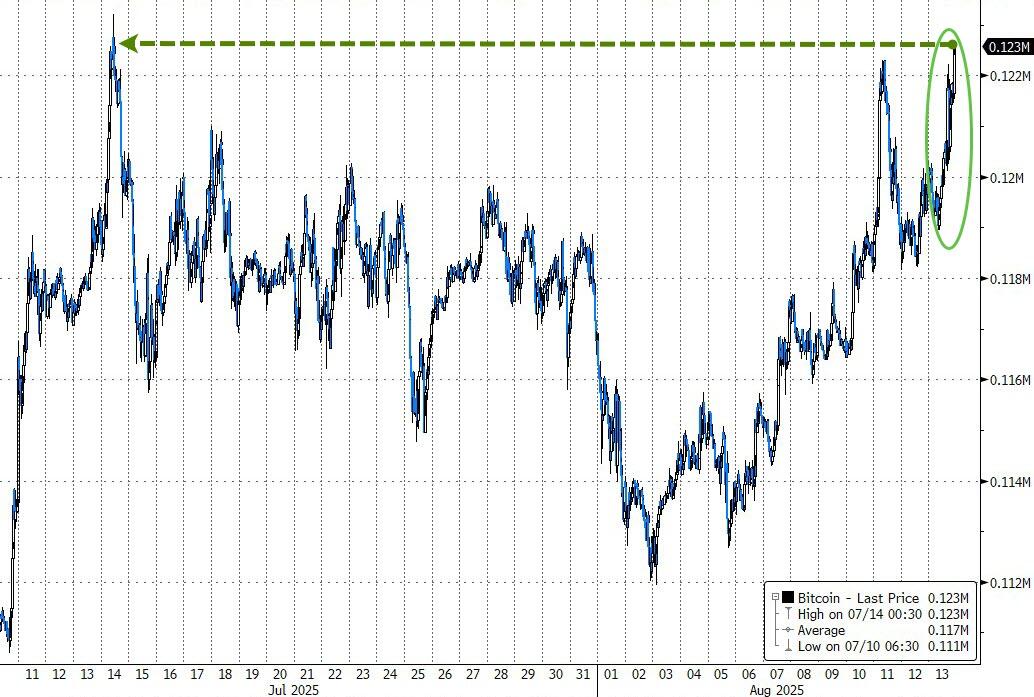
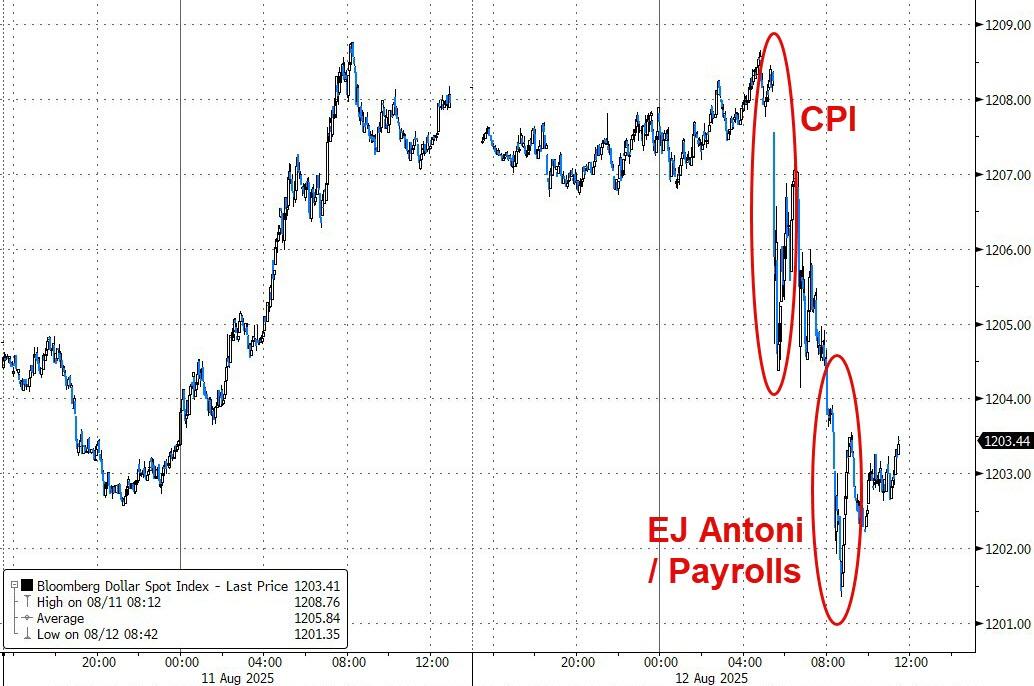
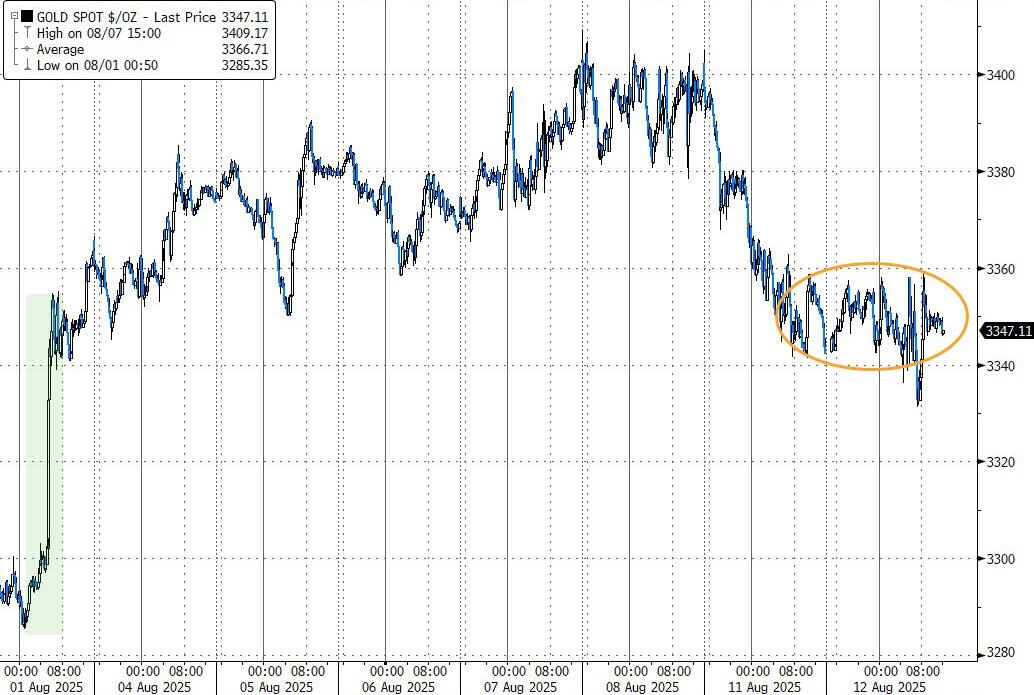
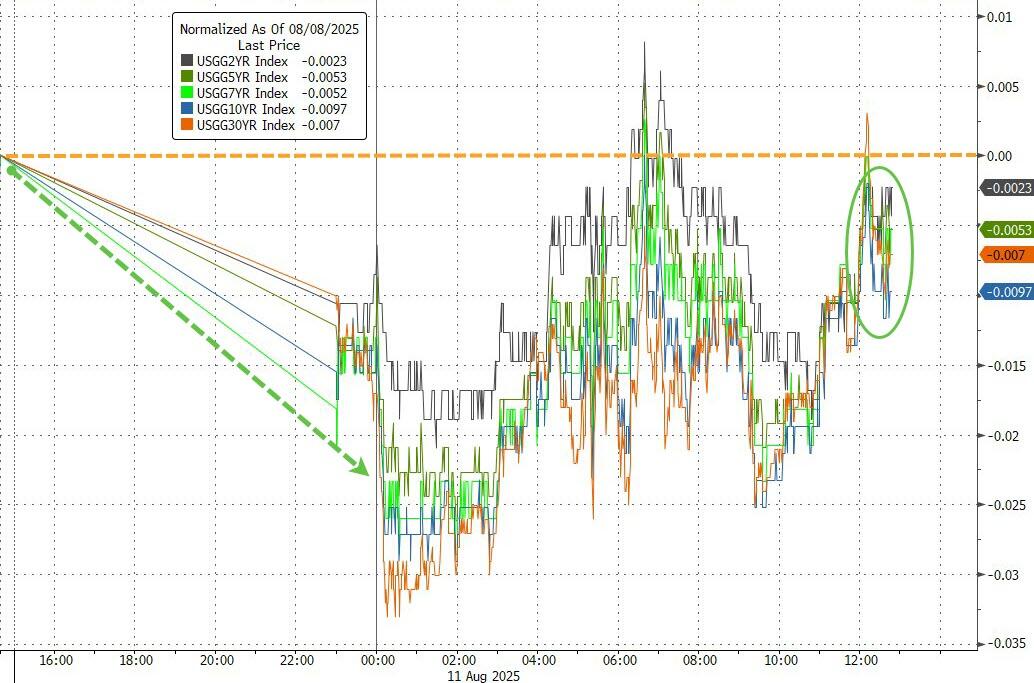
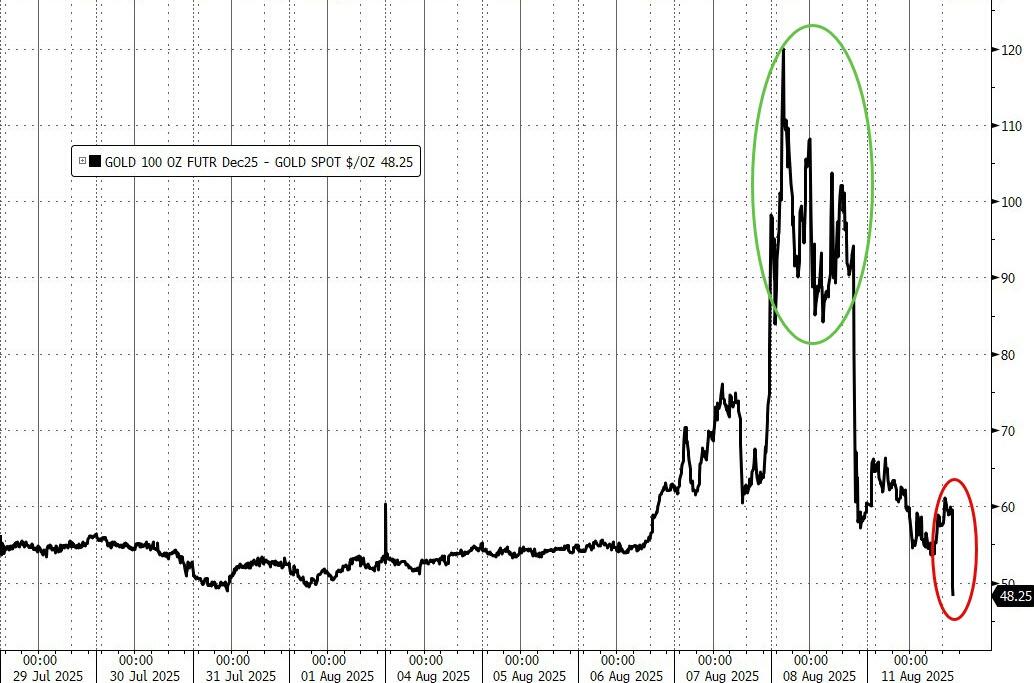
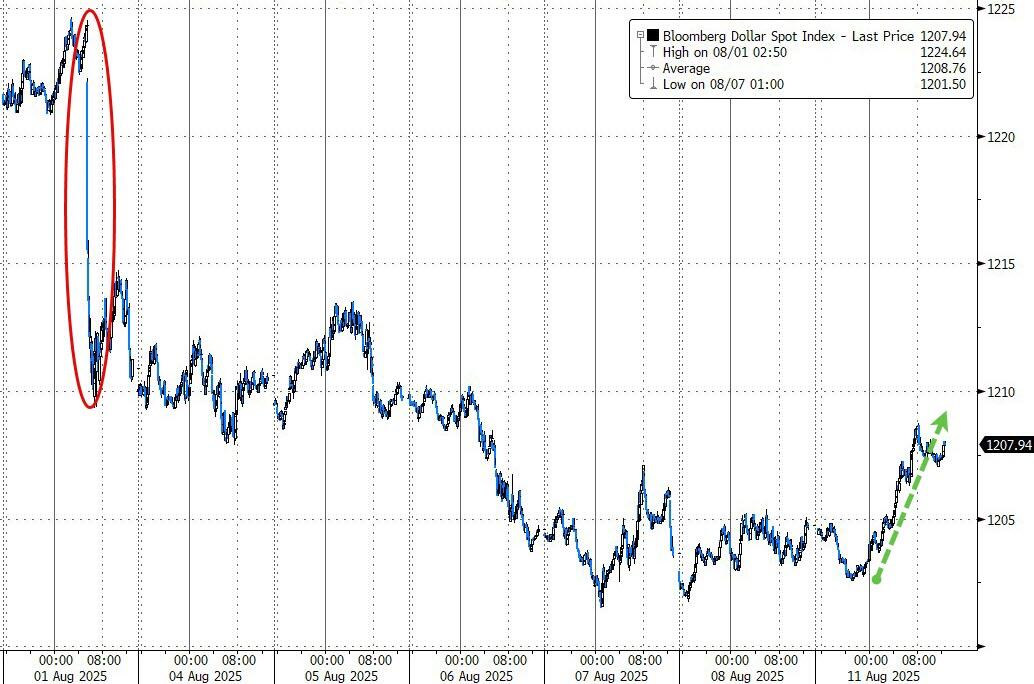
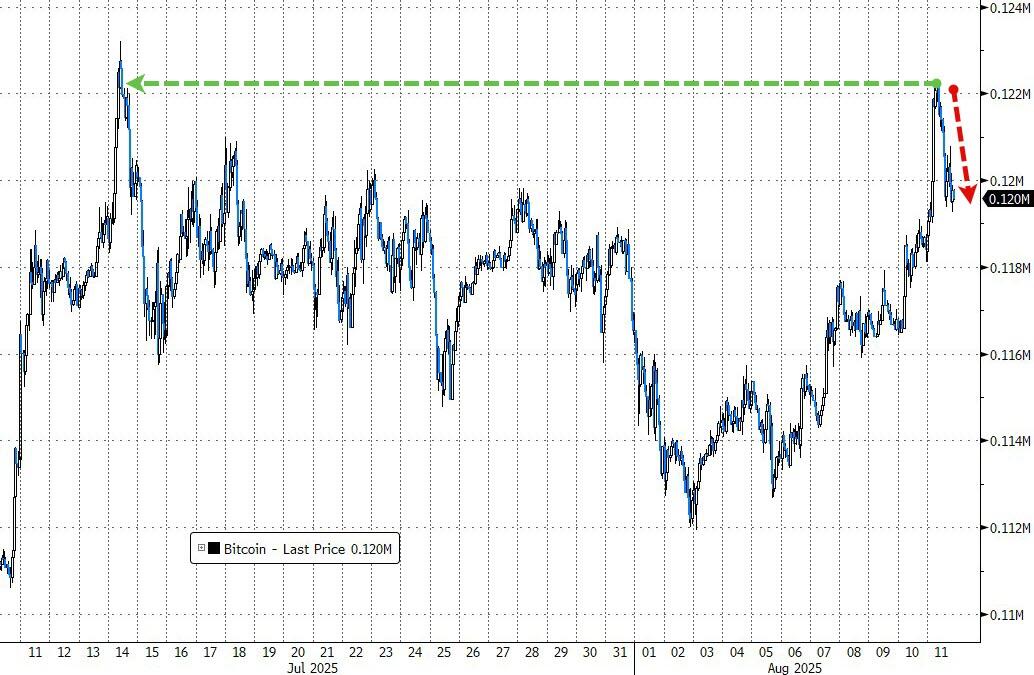
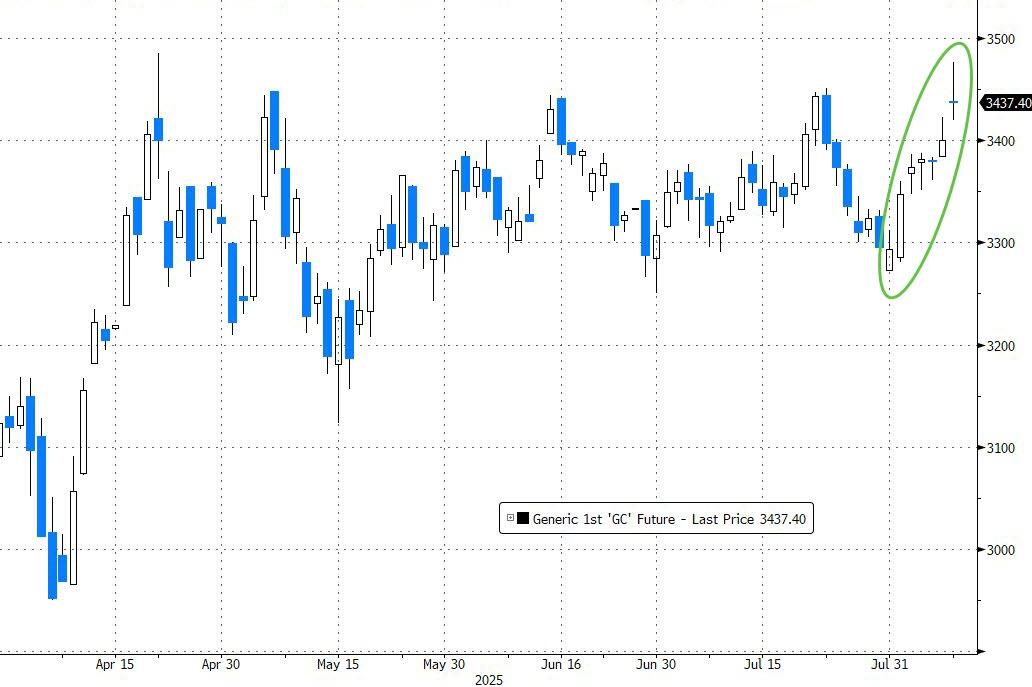
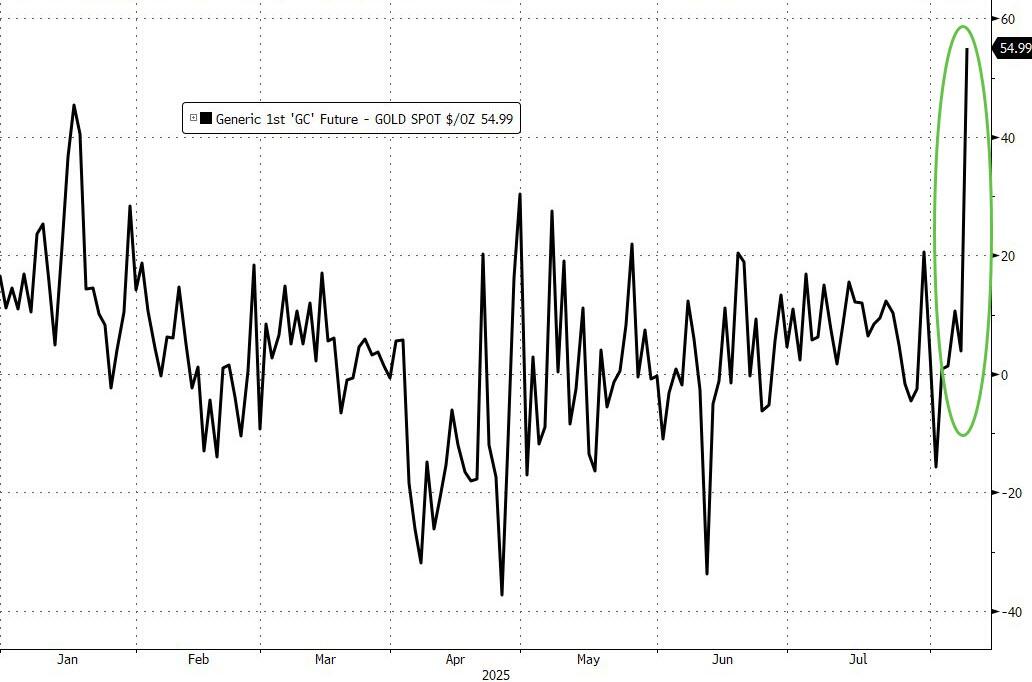
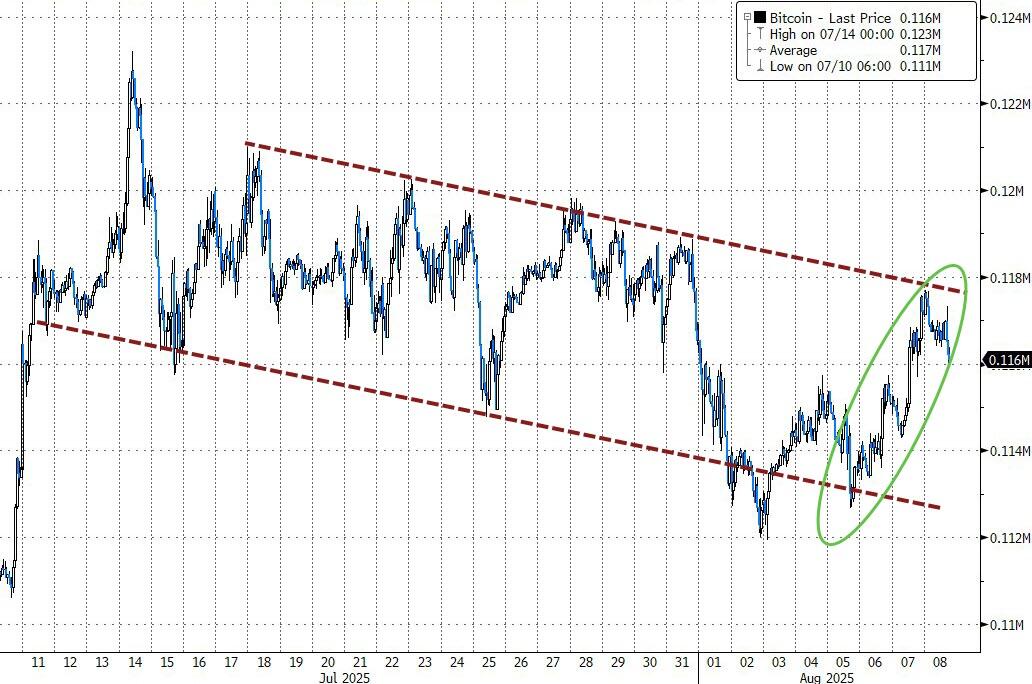
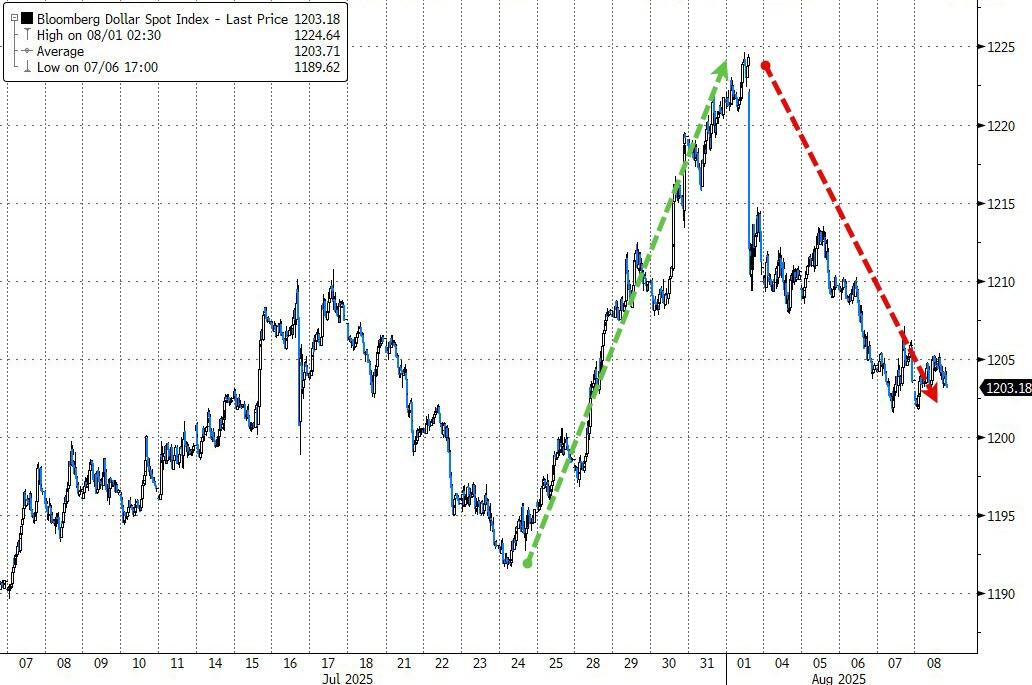
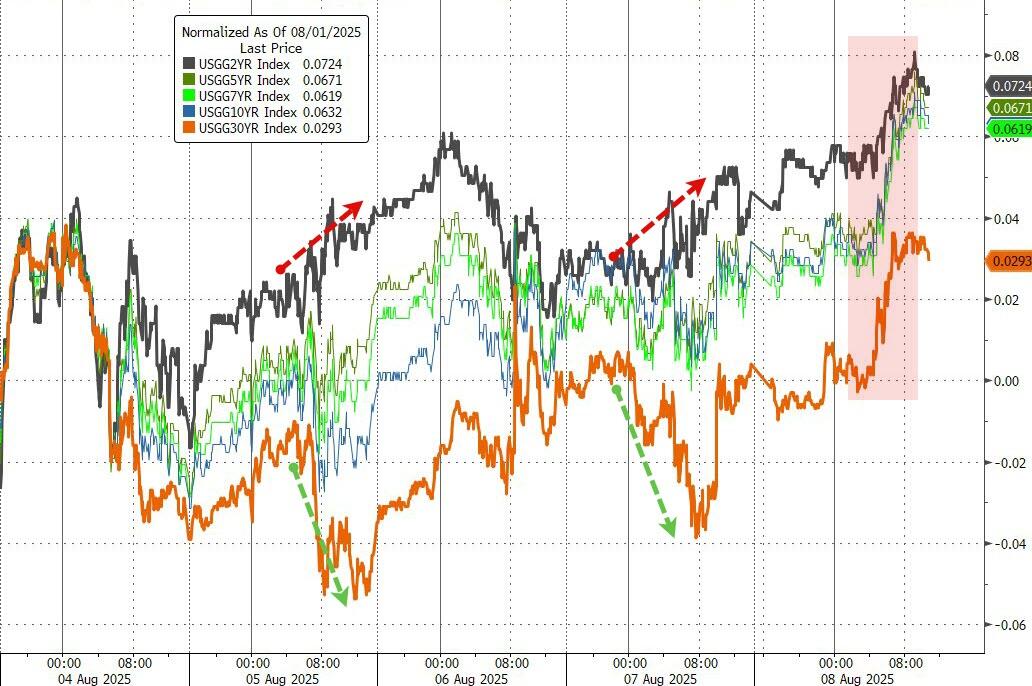
In the rest of the market, the dollar managed a bounce (though it still looks shaky after recent losses), gold slid below a key technical level, bond yields climbed, and Bitcoin came off last night’s record high but found solid footing around $118,000.
So, was today’s flat finish just a breather before the next big move—or are traders starting to question their conviction after these mixed inflation signals?
Read More