I mentioned yesterday that our International Trend Tracking Index (TTI) had crossed its long-term trend line to the downside by -2.00%.
This morning, it took another steep dive thereby clearly heading deeper into bear market territory, which means a ‘Sell’ signal, effective today, has been generated.
As I posted at the time of the ‘Buy’, I did not participate in this cycle due to us being 100% invested in the domestic arena.
If you are following my methodology, this means that all “broadly diversified international funds/ETFs” should no longer be held.
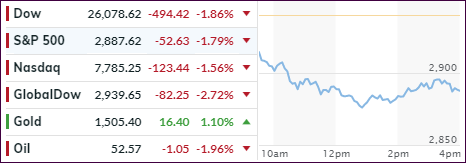
Yesterday’s sea of red worsened
today, as absolutely no bullish sentiment was found anywhere, which had the major
indexes heading sharply south in one of the worst starts to a quarter since
2008. The downside leader was Transportations, which are now down 5% so far
this week.
In addition to Tuesday’s weak
manufacturing report, traders now faced more pain in form of slower job
creation with ADP’s employment gains simply collapsing. Things were bad when we
learned that September’s miss of 135k vs. 145k expected hit the newswire, but
they got worse when the report showed that August’s big jump of 195k was severely
reduced to only 157k.
This does not bode well for
Friday’s upcoming Labor Department non-farm payroll report, although sometimes
these 2 data points can show some divergence.
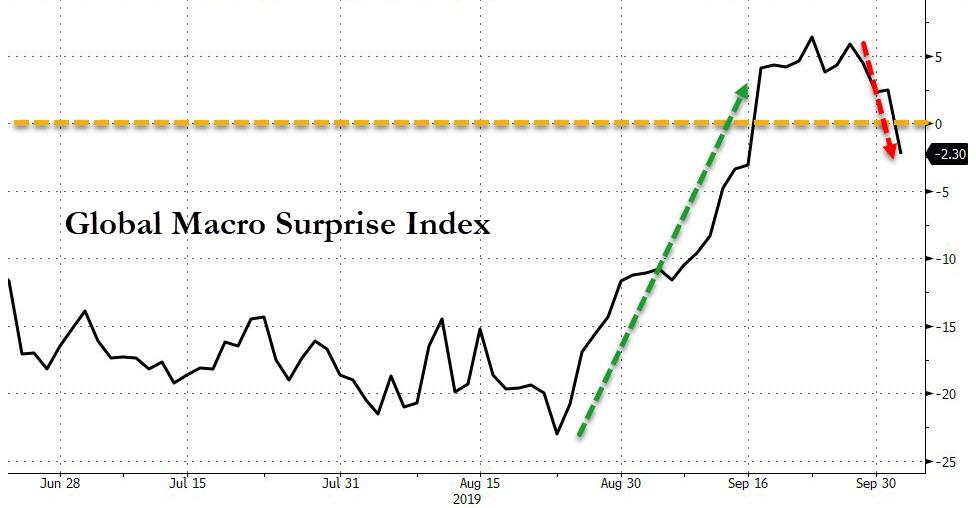
Looking at the big picture, “we
see that trade tensions, global growth concerns, geopolitical risks and signs
of profit margin compression are likely to limit upside going forward,” according
to BofA. The Global
Maco Surprise Index seems to substantiate these concerns by collapsing sharply.
The markets reacted accordingly,
for a moment considering reality, as all major US equity indexes showed signs
of breaking down, with the Dow, Nasdaq and S&P 500 all sinking below their
100 DMAs. Far worse was the performance of the SmallCaps (Russell 2000), which has
now taken out it 200 DMA (Daily Moving Average).
Despite a rescue effort by the
Fed’s Williams announcing that they have the tools (I guess to deal with
the weak economic picture) and promised to use them earlier this time, market
participants would have none of that empty talk and proceeded to, as I said yesterday,
sell first and ask questions later.
On a personal note, I will
not be posting tomorrow and Friday. This time it’s not a business issue, but a
personal one. My wife and I will be traveling to San Diego to be part of my son’s
wedding. I will, however, monitor the markets and adjust our holdings, should
that become necessary. Regular posting will resume this coming Monday.
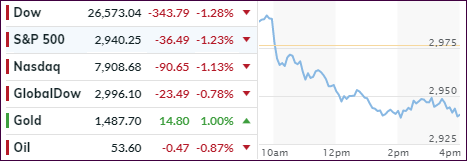
An early rally turned into a
beating with the major indexes heading south all session long. The culprit was
identified as downright ugly manufacturing information that had stocks and bond
yields plunging.
The ISM manufacturing report
came in at its worst level since 2009, as the index dropped to 47.8 in
September from a prior 49.1. Expectations were for a 50.2 number. Any reading below
50 signals contraction, while any reading above signals expansion.
To many analysts, this was simply
confirmation of an ongoing global slowdown and the conviction that US-China trade
talks don’t look like they could contribute anything worthwhile in the near term.
Some of the brokerage houses
imploded today, at least their stock prices did, when Charles Schwab came out
and announced that they will do away with the $4.95 trade fee and offer zero
commission for most stocks, ETFs and options as of October 7. While that will benefit
all of us, brokerage businesses are extremely competitive and other firms will
have to follow suit.
Disclosure: I have used Charles
Schwab & Co as my custodian for clients’ assets since 1990, and I receive
no compensation or any benefits from them.
Not covered by MSM is the continuing
saga of the overnight lending issues between banks, as the Fed had to step in
again this morning to financially “rescue” some of the participants. Not much is
known as to what caused this problem, but it smells like a hidden bailout to
me.
Analyst Sven Henrich had this
to say:
We’re in the middle of an
existential crisis. We must be. That’s what central bank policies are telling
us.
After all the ECB cut rates
to the lowest ever with its balance sheet being at record highs and expanding.
The central bank of
Australia today cut rates to their lowest levels ever.
These are policies of
absolute panic crisis levels are they not?
The Fed is intervening in
repo markets every single day barely able to keep the effective Fed funds rate
at target. They’ve already cut rates twice and are already expanding their
balance sheet.
Without these interventions
markets and the economy would fall apart. That’s the message that is being
sent.
In any other time in history
all these policy actions and their levels would be regarded as commensurate
with a great crisis unfolding.
ZH summed the day up this
way:
The moves today were quite
shocking: Dow futures dropped 500 points from their overnight highs, 30Y Yields
crashed 13bps from overnight highs, the dollar tumbled 0.6% intraday, and gold
spiked $30. Additionally, rate-cut odds for October jumped higher to 60%…
I am sure that the month of
October will have more surprises in store.
I mentioned last Friday that
we would need a good trade headline to give stocks a boost. That is exactly
what happened but not the way you think.
There was no news in US-China
trade arena, so the Trump administration came out and played down or disputed reports
that they were considering blocking Chinese companies from listing shares on US
stock exchanges.
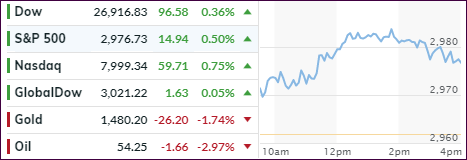
The net effect was that Friday’s
dump after that announcement was reversed and equities pumped on this last day
of September and maintained their positions above the unchanged line all the way
into the close.
For the month, the major indexes
ended up barely in the green, but the S&P 500 gained +1.74%, while for the quarter,
all indexes were higher with SmallCaps having an ugly close. Still, my favorite
low volatility ETF (SPLV) managed to come out ahead by posting a solid +2.06%.
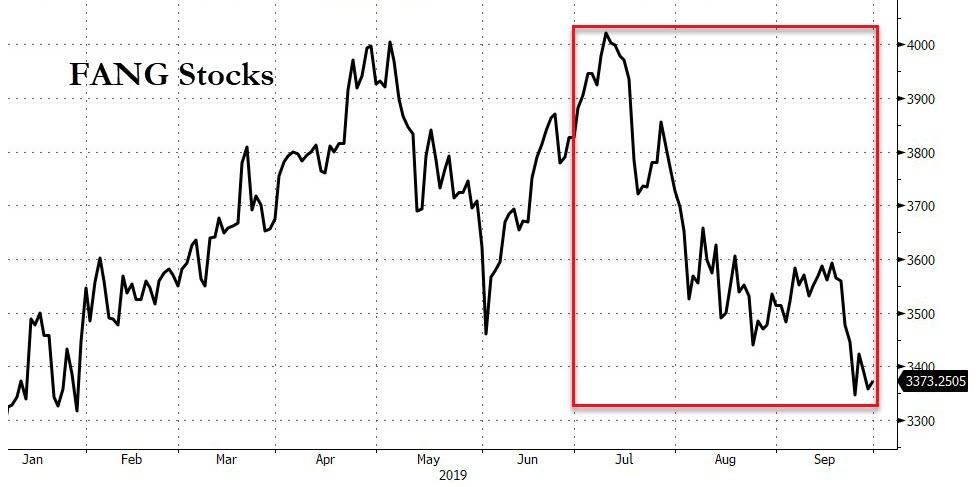
Not doing so well were the FANG
stocks, which fell for the third straight month in September and had their worst
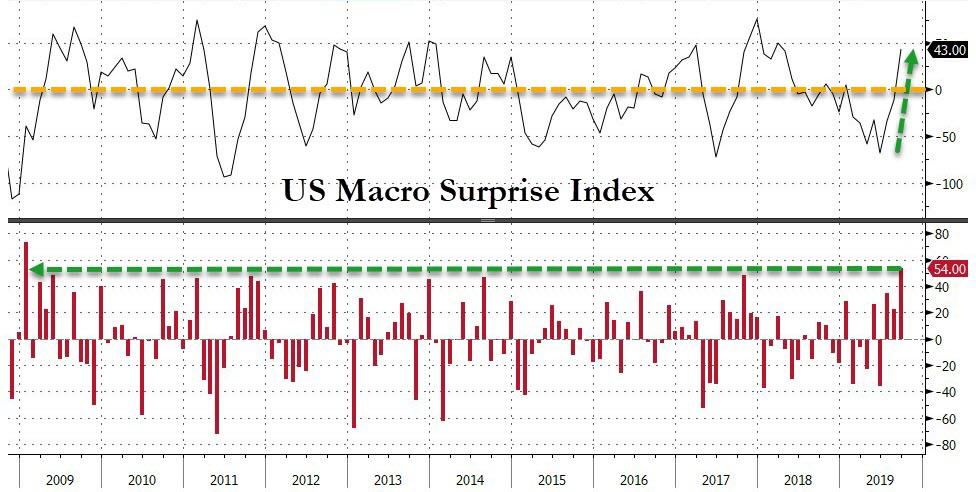
quarterly drop since Q4 2018. ZH noted that we heard some economically encouraging
news in that September saw one of the biggest surges in economic
surprise data since January 2009.
Still, we’re now looking
straight in the jaws of October, which historically has been a month where
anything is possible.
Below, please find the latest High-Volume ETF Cutline
report, which shows how far above or below their respective long-term trend
lines (39-week SMA) my currently tracked ETFs are positioned.
This report covers the HV ETF Master List from Thursday’s
StatSheet and includes 322 High Volume ETFs, defined as those with an average
daily volume of more than $5 million, of which currently 226 (last week 259)
are hovering in bullish territory. The yellow line separates those ETFs that
are positioned above their trend line (%M/A) from those that have dropped below
it.
In case you are not familiar
with some of the terminology used in the reports, please read the Glossary of Terms.
If you missed the original
post about the Cutline approach, you can read it here.
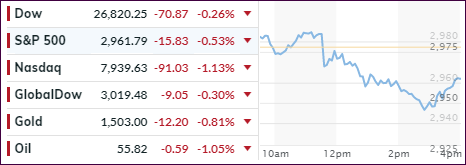
An early 100-point gain on the Dow evaporated
in a hurry and turned into a 150-point loss at one point, after a report that the
White House had thrown down the gauntlet by contemplating delisting Chinese stocks
from US Exchanges.
Of course, such a crackdown on capital flows
does not bode well for softening the intensity of the tariff battle being waged.
This news comes in the face of the warring parties having set an Oct. 10-11
date to meet to resolve their trade differences. I don’t see how this ratcheting
up of tensions will be of any value but, it could be simply a negotiation ploy.
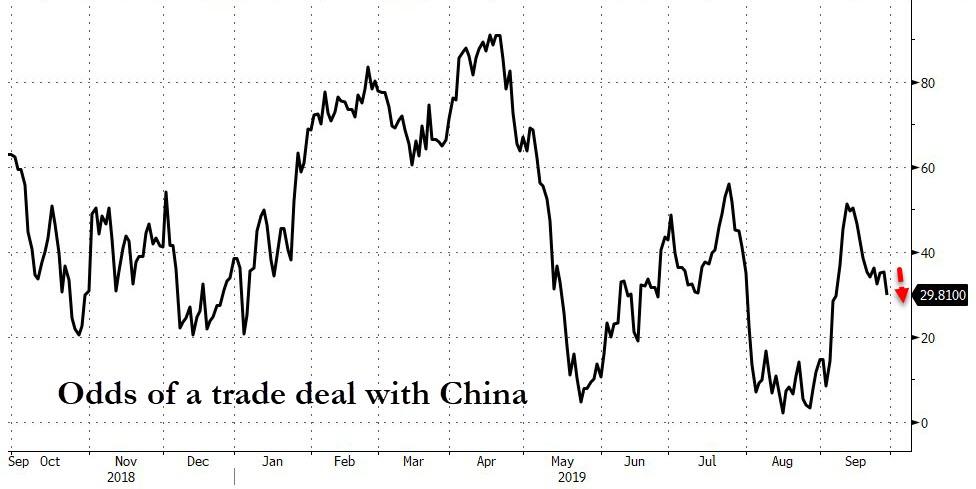
In the end, the odds
of a China deal slipped this week.
Economic data points were mixed with consumer
spending growth showing disappointing estimates, while orders for durable goods
rose 0.2% in August vs. expectations of a 0.7% decline. But the consumer sentiment
was revised upwards in September from 92 to 93.2, however, the index remains on
a downward trajectory.
On the week, equities fell with Small Caps
leading the drop and having its worst week since May 2019. As ZH pointed out, all
the major indexes tested or broke below key technical levels: The Nasdaq below
50 and 100 DMA; Russell 2000 below 200 DMA; S&P testing 50 DMA.
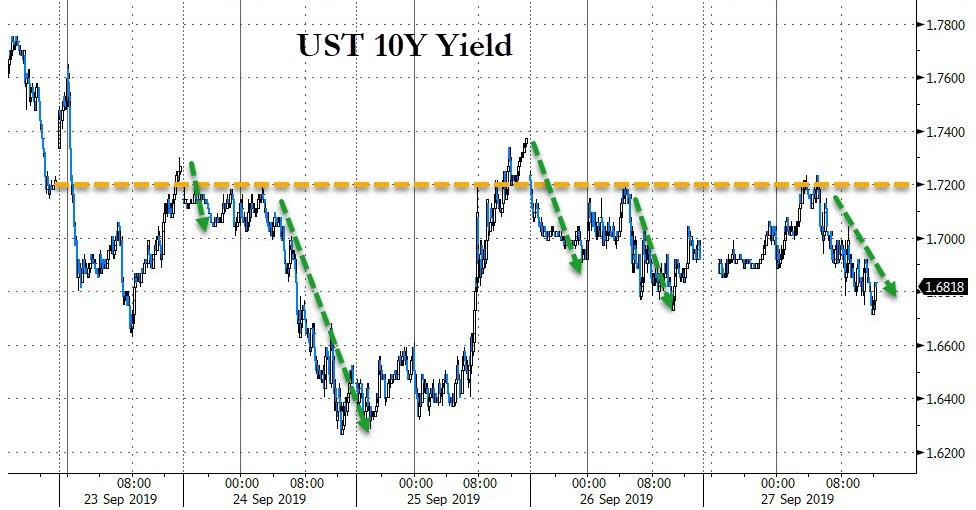
10-year yields attempted several times to break
out above the 1.70% level, but the efforts were rebuffed, and we closed the
week around the 1.68% area.
This was the second losing week in a row for the
S&P 500, but it’s still hanging on to a gain for the month. For sure, it looks
like a very positive trade headline is needed next week to get the bulls going
again.
