Hovering In Record Territory

Ulli Market Commentary Contact

[Chart courtesy of MarketWatch.com]
  1. Moving the markets

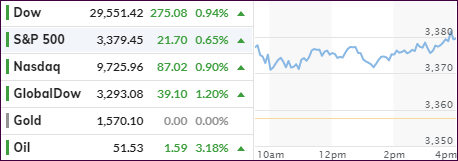
The major indexes gapped higher at the opening and raced into record territory supported by news that the number of new coronaviruses has slowed down. We all know that the accuracy of those numbers coming out of China remains questionable at best, market reaction, while positive, can also be premature.

While the last few weeks have been devastating, as the number of new cases and the death tolls have accelerated, you would not know it by looking at recent market performance, where it seems that FOMO (Fear Of Missing Out) remains one of the drivers that keeps pushing prices higher.

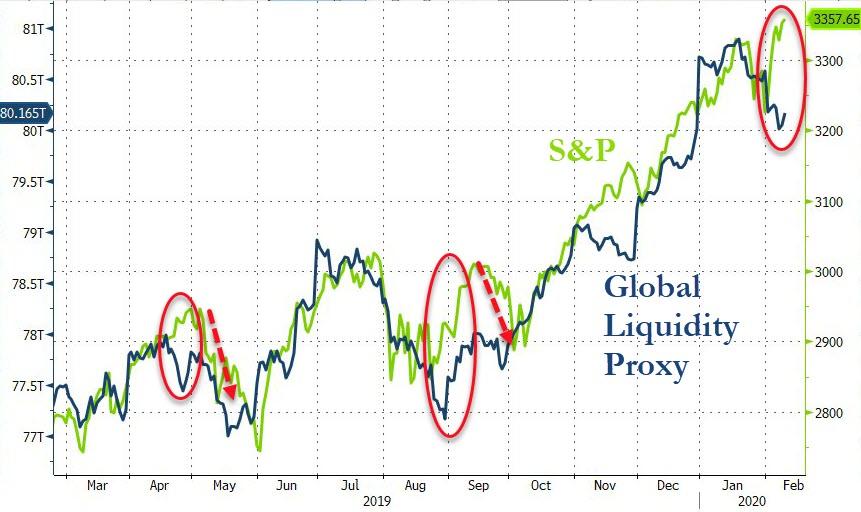
This continued levitation has occurred despite a slowdown in global liquidity, as this chart demonstrates. It also shows that, if history any guide and liquidity does not pick up, a correction may be in the cards. In the end, however, the unshakable belief that the central banks will come to the rescue with their liquidity spigot wide open, may keep any pullback modest in nature.

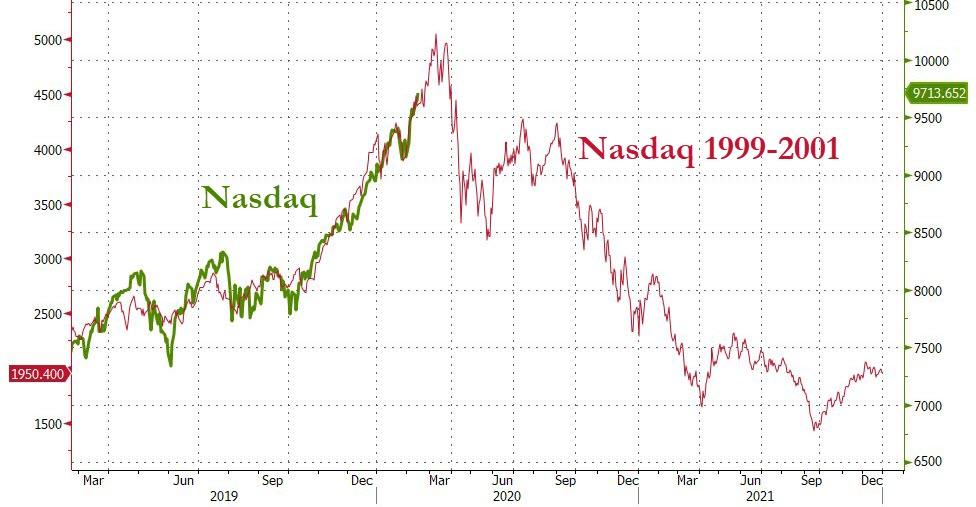
Comparisons to the past may have no bearing on the future, but at least it’s interesting to observe if history, as shown in this chart by Bloomberg, will repeat itself.

Read More

No Market Commentary

Ulli Uncategorized Contact

I got stuck with various appointments and won’t be able to write today’s market commentary.

I will resume regular posting tomorrow.

Ulli…

Staging A Comeback

Ulli Market Commentary Contact

[Chart courtesy of MarketWatch.com]
  1. Moving the markets

No matter what the news headlines say about the coronavirus, investors seem to look past it and find another area to focus on. That was the case today, with potential disruptions to global economies being pushed on the back burner, while positive earnings moved back to the front.

Earnings numbers overall have been relatively strong and have come in slightly better than expected, while forward guidance has so far not presented any sudden negative surprises.

Of course, expectations for the Fed to do whatever is necessary to prop up the economy by maintaining loose financial conditions, has been the backbone supporting equities.

Still, the coronavirus and its global impact will remain on top of the list, despite the Fed’s liquidity support to boost stock valuations. After all, a prolonged disturbance of the global supply chain will have dire consequences on market direction, no matter how “accommodative” the Fed is willing to be.

In the meantime, we saw another rally into record high territory by the S&P 500 and the Nasdaq, and that despite these facts, according to ZH: “More quarantines, more cases, more deaths and more uncertainty about whether any production is back online.”

Go figure…

Read More

ETFs On The Cutline – Updated Through 02/07/2020

Ulli ETFs on the Cutline Contact

Below, please find the latest High-Volume ETF Cutline report, which shows how far above or below their respective long-term trend lines (39-week SMA) my currently tracked ETFs are positioned.

This report covers the HV ETF Master List from Thursday’s StatSheet and includes 322 High Volume ETFs, defined as those with an average daily volume of more than $5 million, of which currently 271 (last week 248) are hovering in bullish territory. The yellow line separates those ETFs that are positioned above their trend line (%M/A) from those that have dropped below it.

Take a look:                                                                   

The HV ETF Master Cutline Report

In case you are not familiar with some of the terminology used in the reports, please read the Glossary of Terms. If you missed the original post about the Cutline approach, you can read it here.      

ETF Tracker Newsletter For February 7, 2020

Ulli ETF Tracker Contact

ETF Tracker StatSheet          

You can view the latest version here.

A STRONG WEEK ENDS WITH A WHIMPER

[Chart courtesy of MarketWatch.com]
  1. Moving the markets

Market weakness finally showed up, which snapped a four-day winning streak, with a stronger than expected jobs report failing to keep the bullish momentum going.

It appeared that the effects of the coronavirus took centerstage again with reports announcing that some 400 million people are on a mandatory lockdown in China with only limited permission to venture outside their homes to buy essential supplies.

Of course, that brings into question as to whether there have “only” been 638 deaths with the real number being much higher. Be that as it may, the market pullback was modest compared to recent gains.

Here at home, today’s payroll numbers crushed expectations of 165k by coming in at 225k, which was well above last month’s upwardly revised number of 142k. Noteworthy, was the rebound in hourly earnings, which exceeded last month’s upwardly revised 3.0% by reaching 3.1%.

Despite these good numbers, equities continued to slide after 4 days of aggressive gains with the S&P 500 still adding some +3.2%, while the major indexes also scored new all-time highs yesterday.

The jobs report boosted overall confidence in the economy and offset the negative reports from the coronavirus, however, it remains questionable if or when the virus will extract its pound of flesh from the markets.

If so, it will be interesting to see, if the Fed adds even more liquidity in order to maintain the bullish theme, such as the Peoples Bank of China just did with their $244 billion injection to stem any potential downturn.

Today’s letdown was in part attributable to the 4-day short-squeeze having run out of ammo, as Bloomberg’s chart clearly demonstrates.

I think the coronavirus may have the potential to temporarily interrupt if not derail stock markets, if some means of containment does not take place. After all, soon 80% of the Chinese economy may not be working and 90% of exports may no longer be functioning with supply-chain effects possibly snowballing.  

Read More

Weekly StatSheet For The ETF Tracker Newsletter – Updated Through 02/06/2020

Ulli ETF StatSheet Contact

ETF Data updated through Thursday, February 6, 2020

Methodology/Use of this StatSheet:

1. From the universe of over 1,800 ETFs, I have selected only those with a trading volume of over $5 million per day (HV ETFs), so that liquidity and a small bid/ask spread are assured.

2. Trend Tracking Indexes (TTIs)

Buy or Sell decisions for Domestic and International ETFs (section 1 and 2), are made based on the respective TTI and its position either above or below its long-term M/A (Moving Average). A crossing of the trend line from below accompanied by some staying power above constitutes a “Buy” signal. Conversely, a clear break below the line constitutes a “Sell” signal. Additionally, I use a 7.5% trailing stop loss on all positions in these categories to control downside risk.

3. All other investment arenas do not have a TTI and should be traded based on  the position of the individual ETF relative to its own respective trend line (%M/A). That’s why those signals are referred to as a “Selective Buy.” In other words, if an ETF crosses its own trendline to the upside, a “Buy” signal is generated. Since these areas tend to be more volatile, I recommend a wider trailing sell stop of 7.5% -10% depending on your risk tolerance.

If you are unfamiliar with some of the terminology, please see Glossary of Terms and new subscriber information in section 9.     

1. DOMESTIC EQUITY ETFs: BUY — since 02/13/2019

Click on chart to enlarge

Our main directional indicator, the Domestic Trend Tracking Index (TTI-green line in the above chart) is now positioned above its long-term trend line (red) by +8.22% after having generated a new Domestic “Buy” signal effective 2/13/19 as posted.

Read More