
- Moving the markets
Looking at today’s news headlines, you would think we’re back to last year’s theme of “bad news is good news” for the markets.
Here’s a sample of what we faced today:
- More Than 500k Covid-19 Cases Diagnosed Worldwide: “From 0 to 250,000 cases in 4 months. From 250,000 cases to 500,000 cases: 1 week.”
- US Vehicle Sales Are Down 50%-75% in March
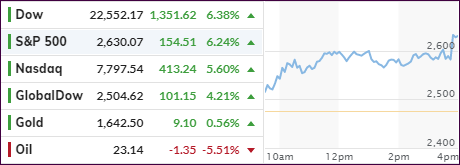
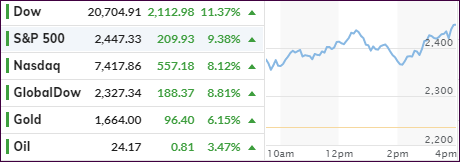
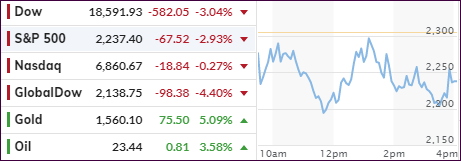
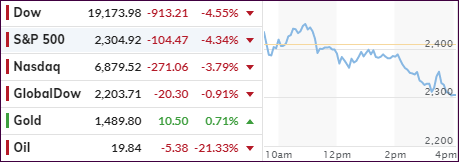
- Oil Plunges
- LIBOR Rate Increase Points to One Or More Banks In Trouble.
- Italy Reports Largest Jump In New Cases; Deaths Decline
- Morgan Staley: “We Are Underwhelmed By This Low Participation Rally”
- China Shuts All Border To Foreigners
- A Record 3.3 million Americans Just Filed For Unemployment Benefits
Considering the above, the markets should have sold off sharply but just the opposite occurred. A massive rally, right after the opening bell, slowed down mid-day but was pumped into the close. If that does not make sense to you, you’re not alone.
Sure, some euphoria over the anticipated stimulus bill, assumed to be signed tomorrow, kept the bullish mood intact. However, traders’ optimism was fueled by another powerful force, namely quarter-end rebalancing by the big boys.
As ZH reports, according to estimates, balanced or 60/40 mutual funds, as well as sovereign wealth funds, representing a US and global universe of $6 trillion dollars, needed to buy some $850 billion in mandated stocks to revert to previous equity allocations.
In the end, ZH summarized the day as follows:
Of course, whether or not today’s action is the result of a giant pension/sovereign wealth fund whale lifting all offers in what has been the most illiquid market in history…and thus resulting in overly pronounced moves, won’t be known until the end of the month.
While this rebound is in the books, we will find out soon if it indeed has staying power once we cross into April.
Right now, given the surge of $3.3 million in unemployment filings while markets exploding to the upside, makes only sense when considering the rebalancing efforts by the whales.
That view is further supported by ZH’s commentary pointing out that “…while the month-end pension rebalance suddenly appeared in the last 10 minutes of trading, sending the ES up by 40 points in literally one trade after it emerged that the Market on Close imbalance was $7 billion!
I wonder what will happen once these whales are done buying.
Read More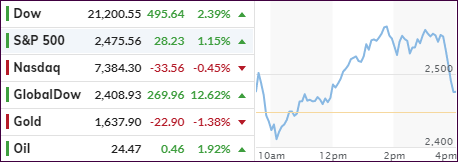