Markets Take A U-Turn Into The Red

Ulli Market Commentary Contact

[Chart courtesy of MarketWatch.com]

  1. Moving the markets

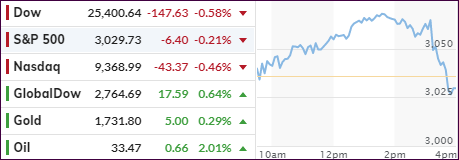
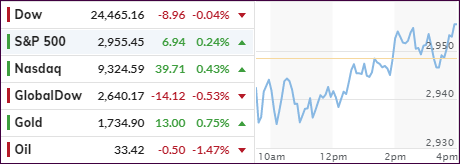
A follow-through rally ran into a brick wall, took a U-turn, and headed south with the major indexes being pulled off their lofty levels and below their respective unchanged lines.

The early burst higher was based on hope that the worst economic damage is now in the past with shutdowns continuing to ease. While that is a step in the right direction, I think there is more fallout to come, but the markets don’t see it yet.

The economic numbers keep worsening, as this list shows (hat tip goes to ZH):

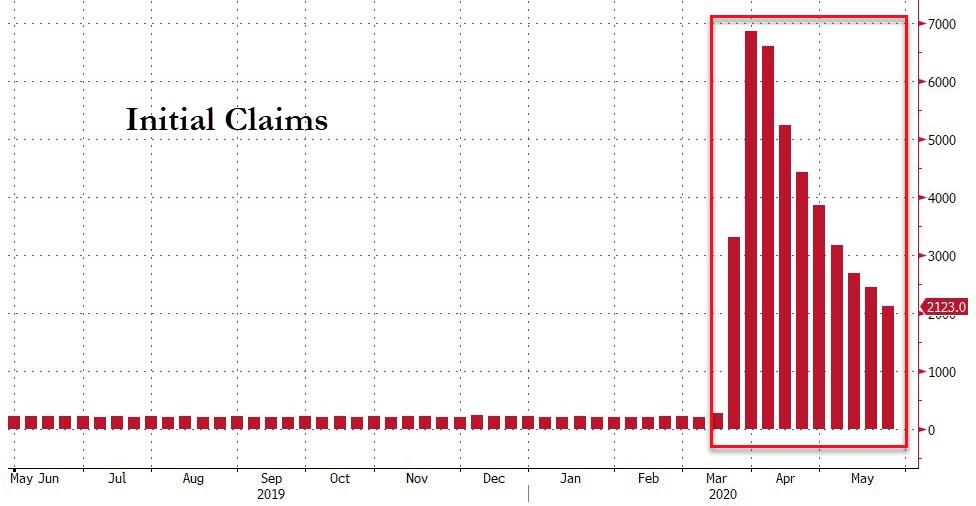
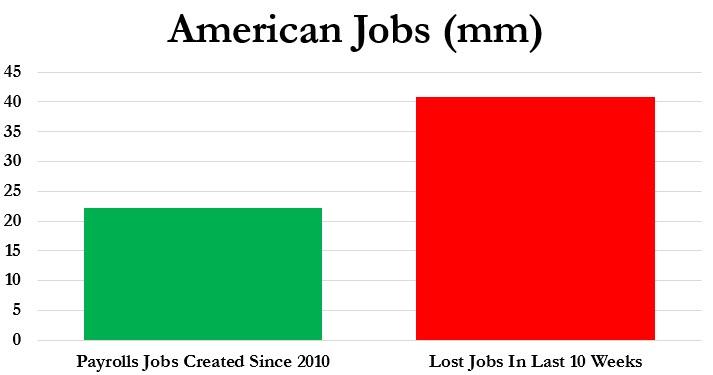
Initial jobless claims kept rising by another 2.123 million over the past week, which now brings the ten-week total to 40.767 million. That’s more than at any time period in American history. What’s more disturbing is that in the past 10 weeks almost twice as many people have filed for unemployment than jobs gained in the last decade since the end of the Great Recession.

Pending Home Sales plummet 35% YoY—biggest drop ever

Q1 GDP revised to -5%—corporate profits plunge 14%

Collapse in Durable Goods Orders accelerates in April

None of these issues mattered throughout most of today’s session. The quick turnaround came on a report that Trump was set to hold a news conference on China tomorrow.

That hurled a cloud of uncertainty over the markets, especially due to the recent war of words and current ratcheting up of tensions not just between the two countries, but also regarding the uprising in Hong Kong and the potential imposition of a national security law.

For once, the Fed was out of the limelight, and we will have to see how this event shapes up.

Read More

Leaving Overhead Resistance In The Dust

Ulli Market Commentary Contact

[Chart courtesy of MarketWatch.com]

  1. Moving the markets

After the Dow and the S&P 500 battled with their overhead resistance yesterday, it was a different story today, when, after some early morning bobbing and weaving, the major indexes reestablished upward momentum and off we went.

You would have thought that dismal economic data and rising US-China tensions would have imparted a sense of reality, but that did not happen. Even the Fed’s beige book was filled with alarming notes about the economic devastation, with the hardest-hit industries being retail, travel, and hospitality, but none of it mattered.

Then we learned that one of the former main drivers of the stock market, namely profits, posted a record decline. Zero Hedge noted:

S&P 500 companies posted a record decline in Q1 operating profits, exceeding the previous single-quarter collapse that occurred during the Great Financial Recession.

The decline in Q2 operating profits will prove to be far bigger. Corporate solvency risks are alive and growing. Equity valuations are at nosebleed levels. A retesting of the March lows in the equity market is a probable outcome.

Yet, none of these data points are a problem at this time—until one day, when they will…

Currently, it’s all about the Fed’s intentions of bailing out anyone that needs it, and it’s now a matter of experiencing one more market collapse, after which the Fed will decide to purchase stocks outright.

On the other hand, you must ask yourself, how long can this go on?

I am continuing to look for more suitable sector ETFs, but it appears that a new Domestic “Buy” will be in our near future (see section 3).

Read More

Fighting To Conquer Key Levels

Ulli Market Commentary Contact

[Chart courtesy of MarketWatch.com]

  1. Moving the markets

Attempting to cross psychologically important key levels to the upside was the name of the game today with the Dow trying to conquer the 25,000 obstacle, while the S&P 500’s goal was trouncing the 3,000 number.

Both succeeded intraday, but a late sell-off pulled the indexes back below, as reports surfaced that the US was considering transaction controls and asset freezes on Chinese officials and firms. 

The early support of this massive rebound came from the usual  suspects, namely fresh coronavirus vaccine news and simply optimism for the reopening of the economy, although not much attention was given to the fact that a yet unknown number of businesses have reached the point of no return.

If you are in awe of the March low rebound of the markets, author Charles Hugh Smith shared these succinct thoughts on that topic:

As you’ve probably heard by now, sales don’t matter, profits don’t matter, costs don’t matter, and indeed, nothing matters but the Fed has our back so buy stocks, never mind the valuations. In other words, the U.S. stock market has reached the spiritual level where the corporeal tangible world no longer matters: in a word, Nirvana, or Heaven if you prefer.

If we set aside the satire and the absurd justifications of the financial punditry ( “we see a V-shaped recovery of profits in 2023, or was it in 2032? Never mind, doesn’t matter…”), we discern a reality that should worry us: America’s economy and financial system cannot allow the stock market to decline because any sustained drop will pop the debt-bubble and bring the entire rickety, rotten, corrupt structure down.

The never-ending supply of liquidity, Fed bailouts and outright purchase of bonds will keep interest rates low and the bullish theme alive. All of which is being assisted by the ongoing short squeeze, as Bloomberg shows in this chart. The loser of the day was the US dollar, which saw its biggest daily drop in 2 months.

Our Domestic Trend Tracking Index (TTI) is getting close to signaling a new “Buy,” but I already have started easing into those sector funds that run on their own cycles.   

Read More

ETFs On The Cutline – Updated Through 05/22/2020

Ulli ETFs on the Cutline Contact

Below, please find the latest High-Volume ETF Cutline report, which shows how far above or below their respective long-term trend lines (39-week SMA) my currently tracked ETFs are positioned.

This report covers the HV ETF Master List from Thursday’s StatSheet and includes 322 High Volume ETFs, defined as those with an average daily volume of more than $5 million, of which currently 84 (last week 73) are hovering in bullish territory. The yellow line separates those ETFs that are positioned above their trend line (%M/A) from those that have dropped below it.

Take a look:                                                                   

The HV ETF Master Cutline Report

In case you are not familiar with some of the terminology used in the reports, please read the Glossary of Terms. If you missed the original post about the Cutline approach, you can read it here.      

ETF Tracker Newsletter For May 22, 2020

Ulli ETF Tracker Contact

ETF Tracker StatSheet          

You can view the latest version here.

RUNNING OUT OF STEAM

[Chart courtesy of MarketWatch.com]

  1. Moving the markets


Despite a heroic attempt to pump the market into another green close, the computer algos pushed the major indexes back toward their respective unchanged lines, but not much was gained, as the bullish theme ran out of steam ahead of the upcoming Memorial Day weekend.

However, for the week, the S&P 500 managed to not only gain some 3% but also slip into the positive for the month, after the bears had threatened to reverse the bullish trend on 5/13.

Of course, as I posted on many occasions, the Central Banks (CBs) are behind this enormous rebound off the March lows, and BofAs Michael Harnett in his latest Flow Show report pointed to this fact:

In the past 8 weeks, central banks have been buying $2.4 billion per hour of financial assets.

As Deutsche Bank calculates, the combined G-10 central bank balance sheet is now above $20 trillion, catching up to its trendline since the financial crisis after stagnating around $16 trillion for the past two years…

If you had thought that the Fed acted as a lone ranger, accept that this enormous pumping effort of financial assets is a global phenomenon and not just limited to the US.

That means the Fed and the global banks have engaged in never-ending “emergency measures” to support financial assets, ever since the Great Recession came to an end some 10 years ago. Of course, those originally planned to be temporary measures became permanent ones, since none of the initial problems, namely too much debt, were ever addressed and fixed.

This week’s push higher was supported by optimism about the reopening of the economies, along with a slow but steady rebound in activity. Consensus has priced in a “U” or “W” shaped recovery, but should that not happen, watch out below.

Zero Hedge summed up the week like this:

Millions more job losses, thousands more deaths, hundreds more earnings outlooks cut or dismissed, dozens of rancorous threats and promises exchanged between US and China… and still a handful of key US stocks sent the major indices soaring on the week led by Trannies and Small Caps…

With the continued support of the Fed, I expect that we will receive a new Domestic Buy signal soon. However, it is important to realize that you must have an exit strategy established in case the powers to be run out of ammunition, or, the market simply hiccups and revisits the March lows.

Read More

Weekly StatSheet For The ETF Tracker Newsletter – Updated Through 05/21/2020

Ulli ETF StatSheet Contact

ETF Data updated through Thursday, May 21, 2020

Methodology/Use of this StatSheet:

1. From the universe of over 1,800 ETFs, I have selected only those with a trading volume of over $5 million per day (HV ETFs), so that liquidity and a small bid/ask spread are assured.

2. Trend Tracking Indexes (TTIs)

Buy or Sell decisions for Domestic and International ETFs (section 1 and 2), are made based on the respective TTI and its position either above or below its long-term M/A (Moving Average). A crossing of the trend line from below accompanied by some staying power above constitutes a “Buy” signal. Conversely, a clear break below the line constitutes a “Sell” signal. Additionally, I use a 7.5% trailing stop loss on all positions in these categories to control downside risk.

3. All other investment arenas do not have a TTI and should be traded based on  the position of the individual ETF relative to its own respective trend line (%M/A). That’s why those signals are referred to as a “Selective Buy.” In other words, if an ETF crosses its own trendline to the upside, a “Buy” signal is generated. Since these areas tend to be more volatile, I recommend a wider trailing sell stop of 7.5% -10% depending on your risk tolerance.

If you are unfamiliar with some of the terminology, please see Glossary of Terms and new subscriber information in section 9.     

1. DOMESTIC EQUITY ETFs: SELL — since 02/27/2020


Click on chart to enlarge

Our main directional indicator, the Domestic Trend Tracking Index (TTI-green line in the above chart) is now positioned below its long-term trend line (red) by -7.85% after having generated a new Domestic “Sell” signal effective 2/27/20 as posted.

Read More