
- Moving the market
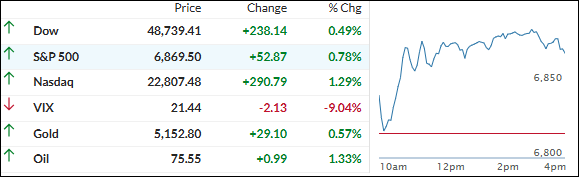
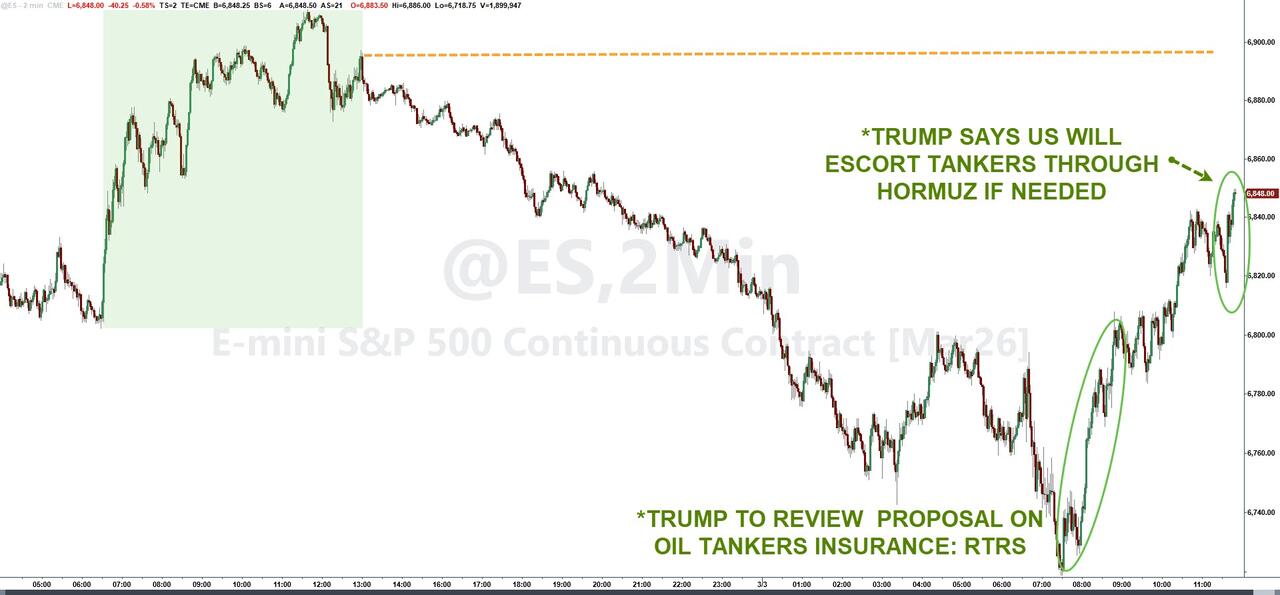
The major indexes shook off yesterday’s volatility and opened strong, building on a broad rebound as traders focused on the latest U.S.-Israel-Iran developments while letting some of the growth-scare fears from last week fade into the background.
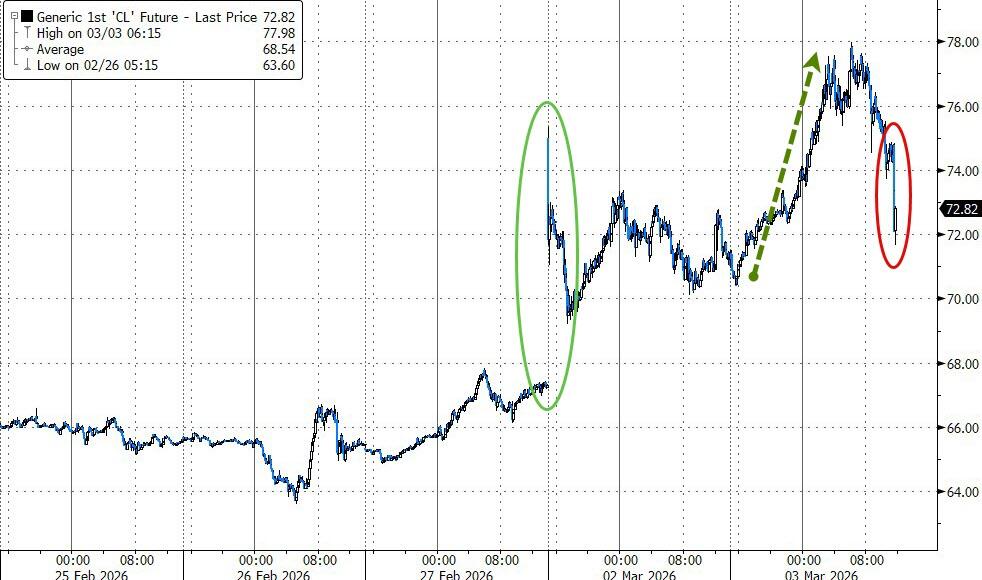
Treasury Secretary Bessent said today the U.S. is gearing up for “a series of announcements” to keep oil flowing smoothly through the Persian Gulf.
This follows President Trump’s Tuesday statement that the U.S. will provide risk insurance (or even escorts) for tankers through the Strait of Hormuz to get trade moving again.
Bessent also confirmed the 15% global tariff Trump announced late last month will roll out this week, though he added he expects U.S. tariff rates to “within five months” return to pre-Supreme Court levels (after the court struck down much of the original policy).
On the ground, Israel launched another round of attacks on Tehran, with the defense minister vowing to “crush” the regime’s capabilities. It’s headline-watching season right now—competing stories are shifting sentiment hour by hour.
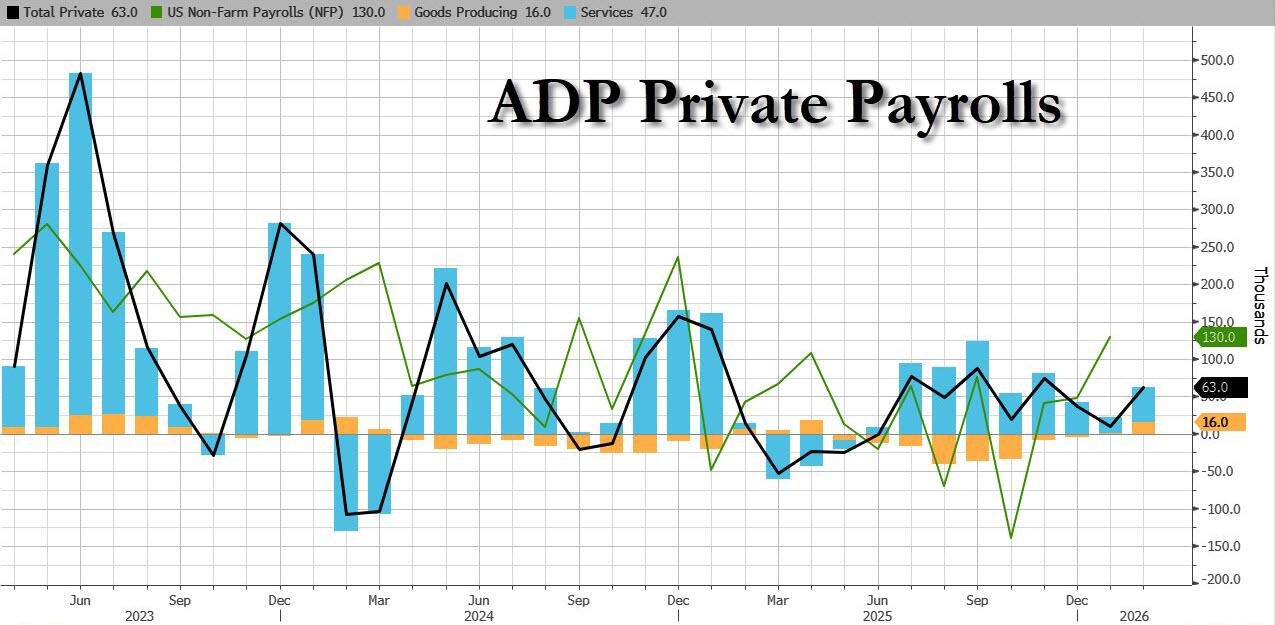
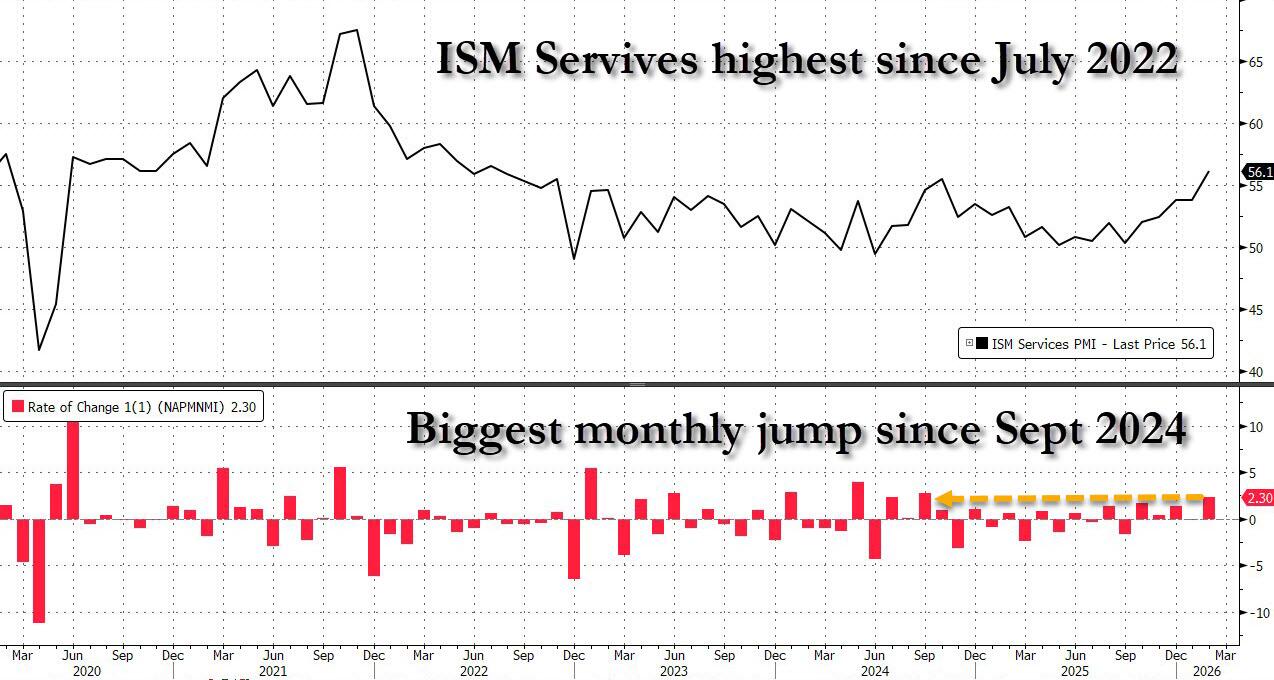
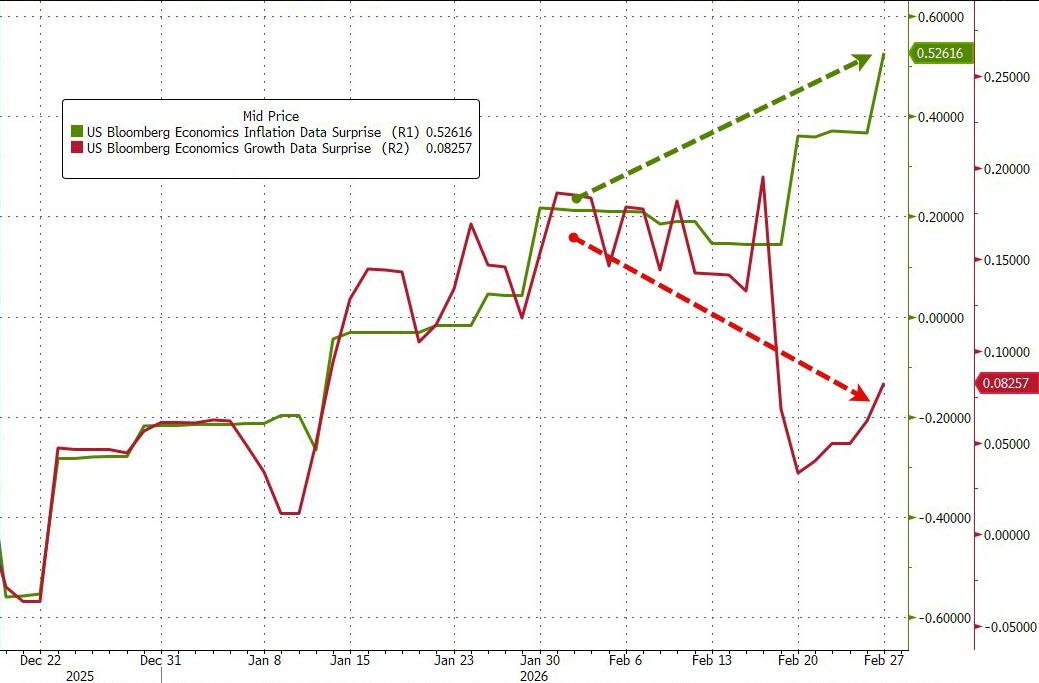
The upbeat mood got a boost from solid macro data: ADP showed private payrolls added more jobs than expected in February, and the nonmanufacturing sector (services) grew stronger than forecasted last month with easing inflation pressures.
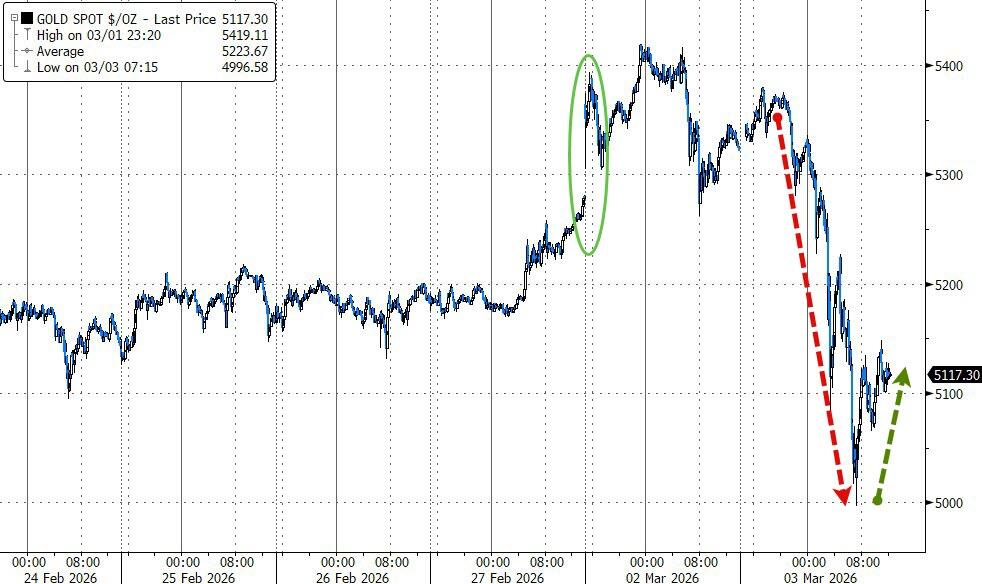
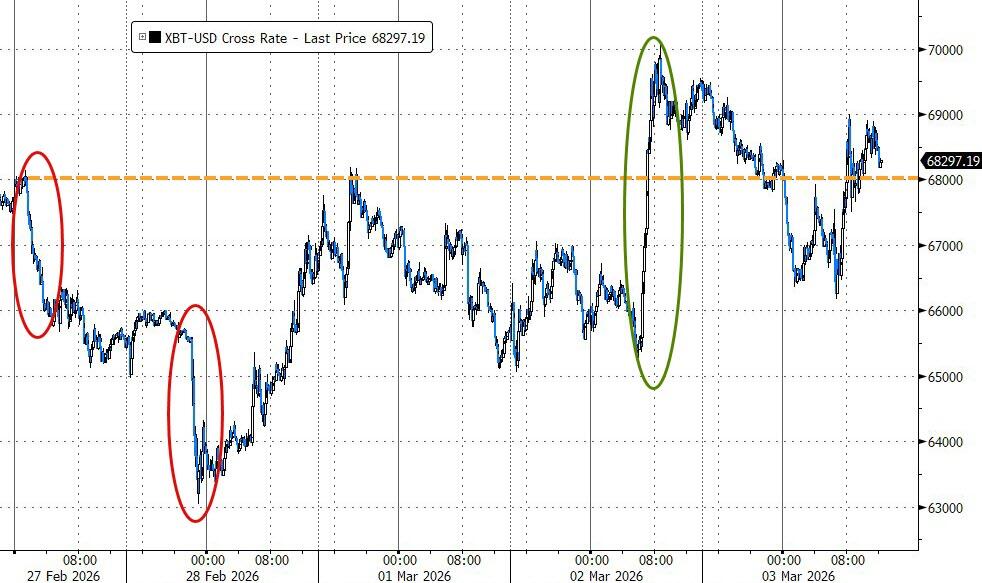
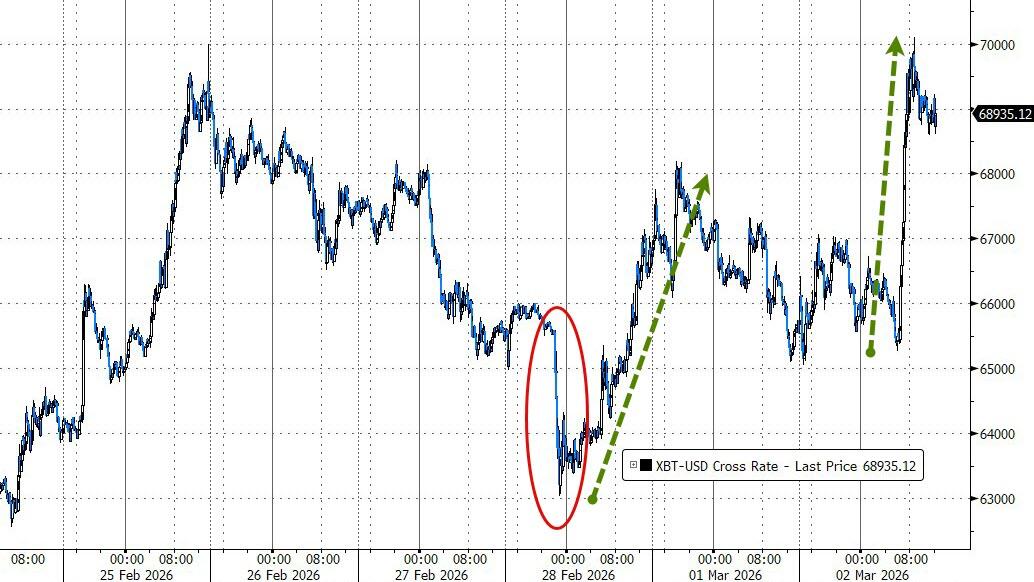
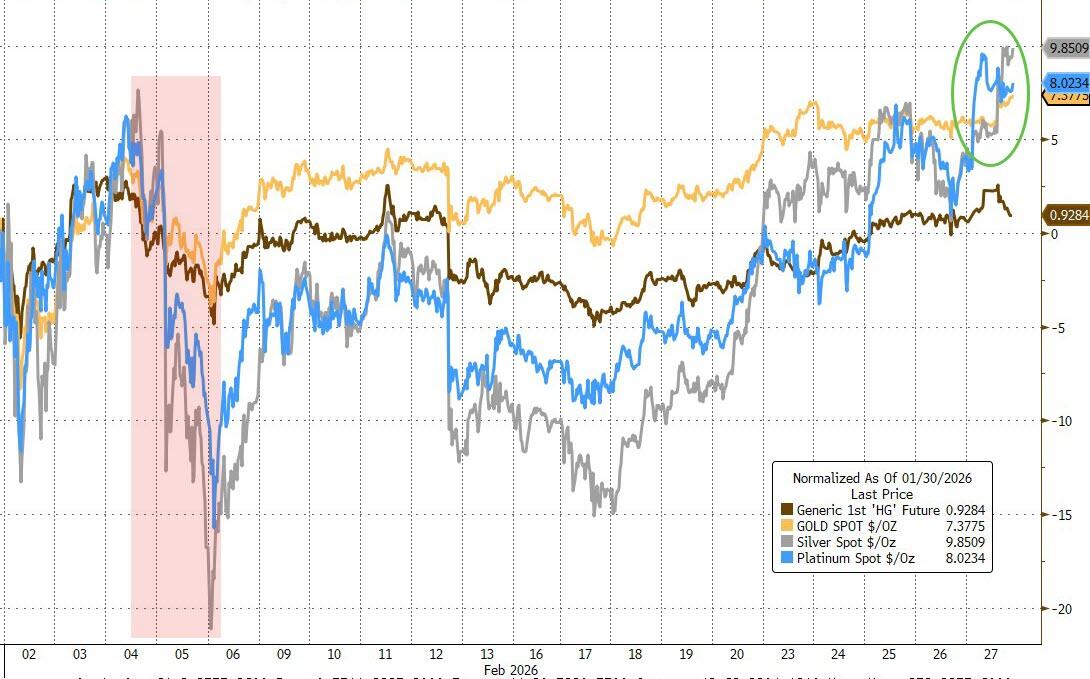
Gold and silver advanced modestly, but Bitcoin stole the show—roaring up to $74K (up over 7% at one point) before settling a bit lower.
ZeroHedge nailed it: the real question is what fresh news from the firehose could surprise the market and restart the scare cycle from scratch?
Read More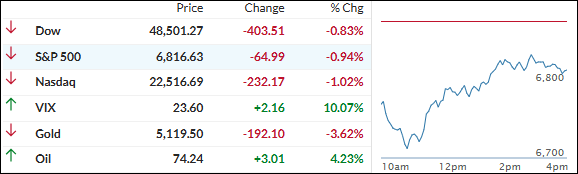
