
ETF Tracker StatSheet
You can view the latest version here.
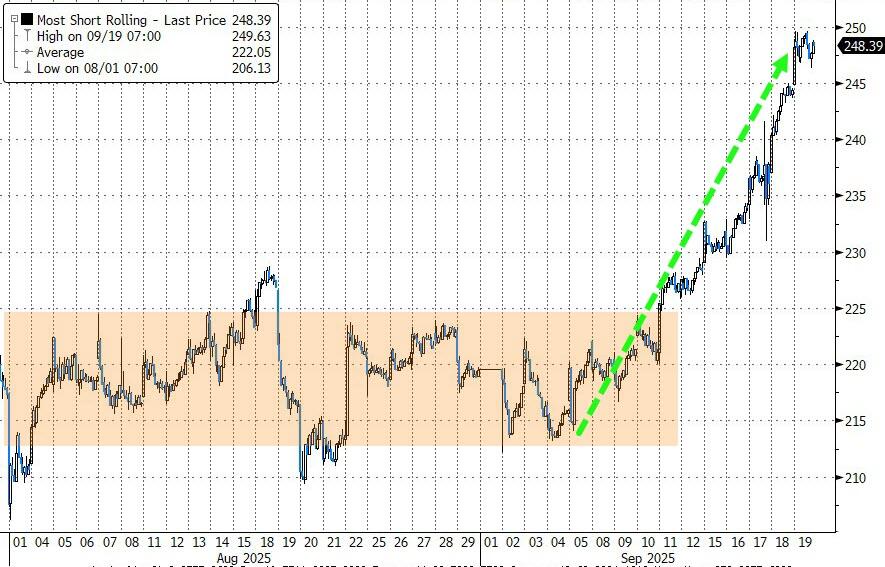
GOLD, SILVER RIP HIGHER WHILE SHORT SQUEEZE RALLY ROLLS ON
- Moving the market
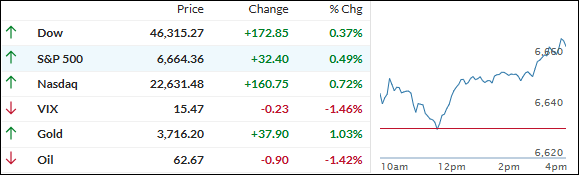
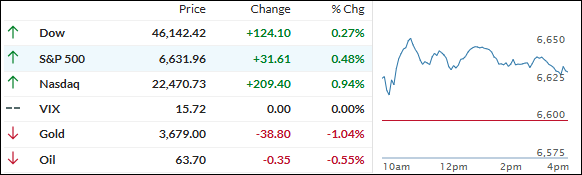
Stocks kept climbing, building on a record-setting week after the Fed finally delivered its much-anticipated rate cut.
As expected, the decision to lower the benchmark rate by a quarter point gave equities another leg up—even if Fed Chair Jerome Powell called the move a “risk management cut” and made it clear this isn’t the start of a freewheeling cutting cycle.
Apple led today’s winner list with a 1.4% gain as the new iPhone hit stores, and Tesla climbed 2%.
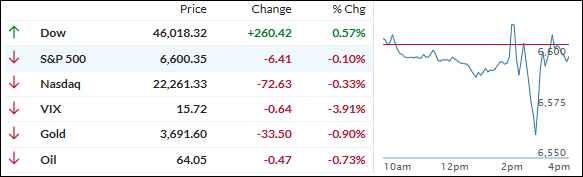
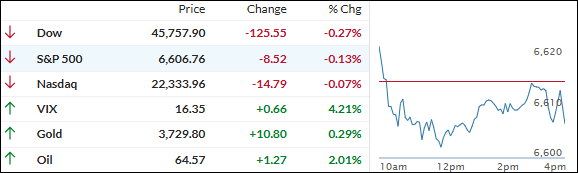
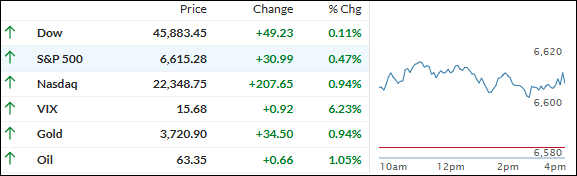
All the major indexes ended the week on a strong note: the S&P 500 and Dow added around 1%, the Nasdaq surged nearly 2%, and the Russell 2000 outperformed, notching its seventh weekly win in a row.
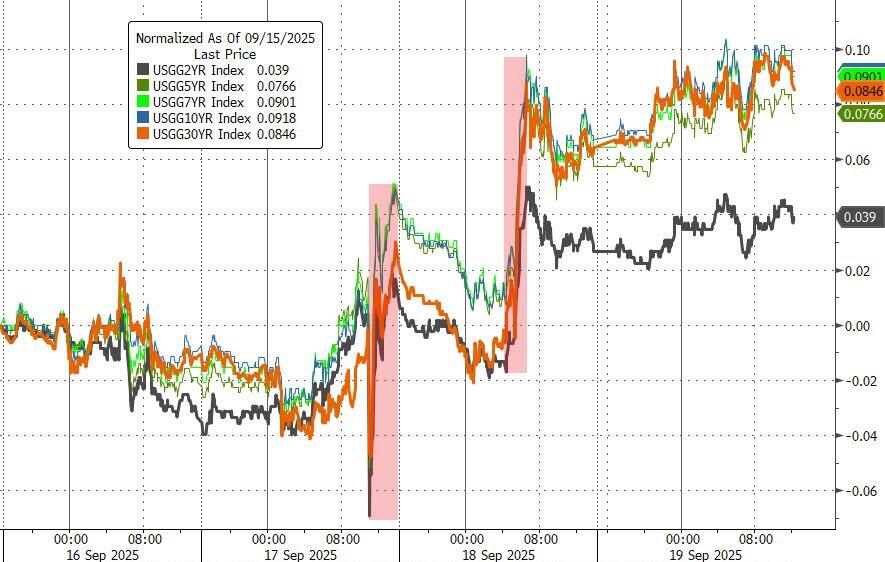
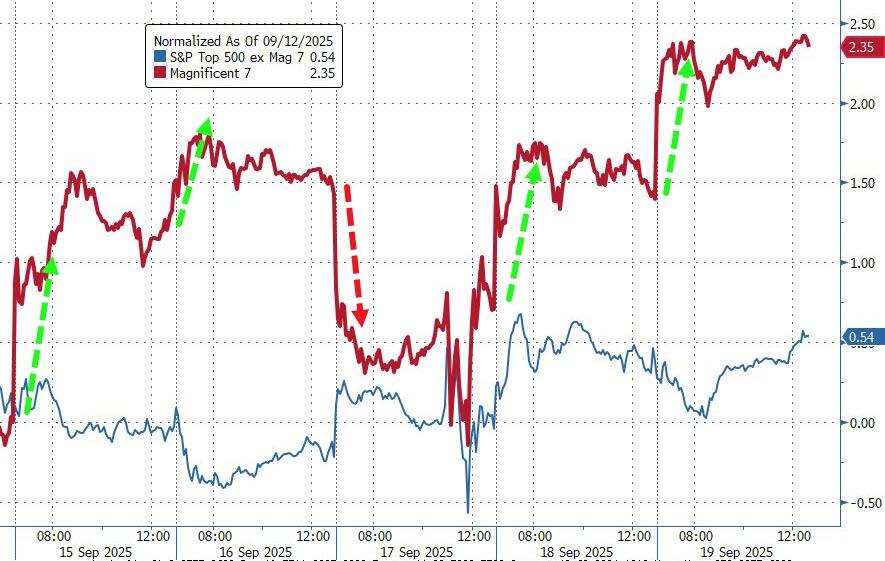
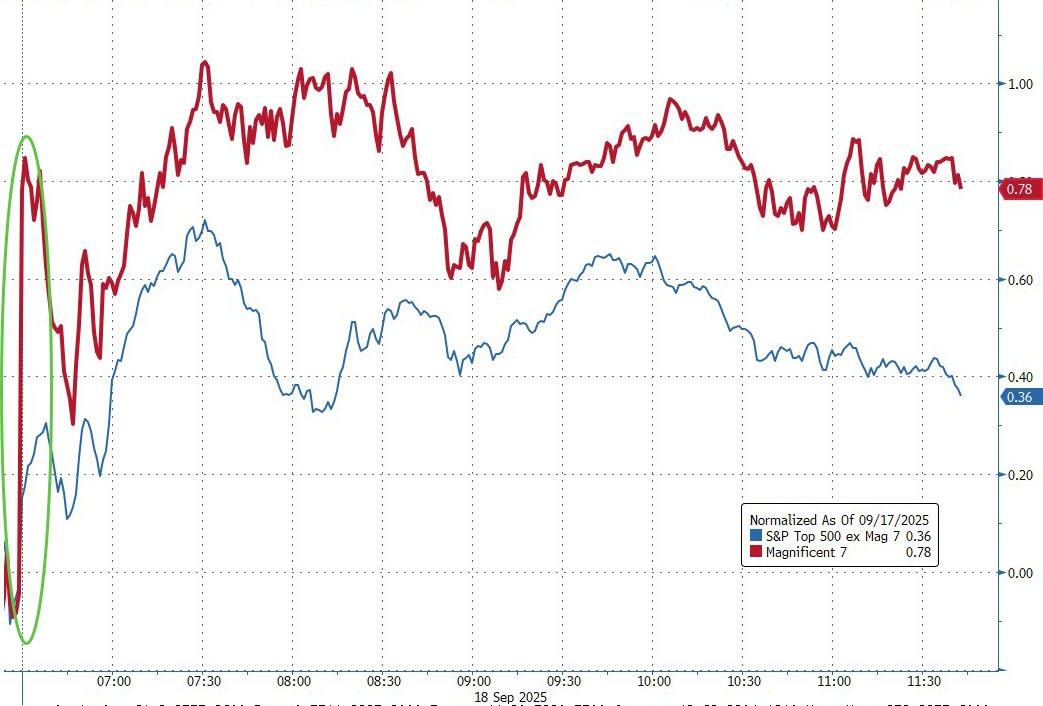
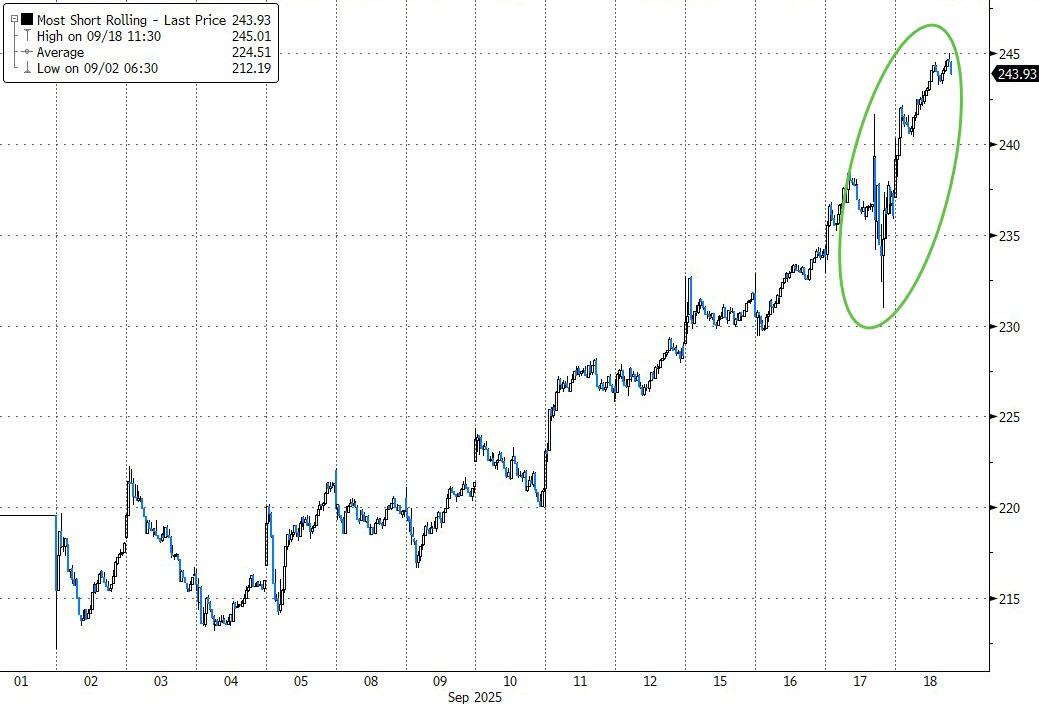
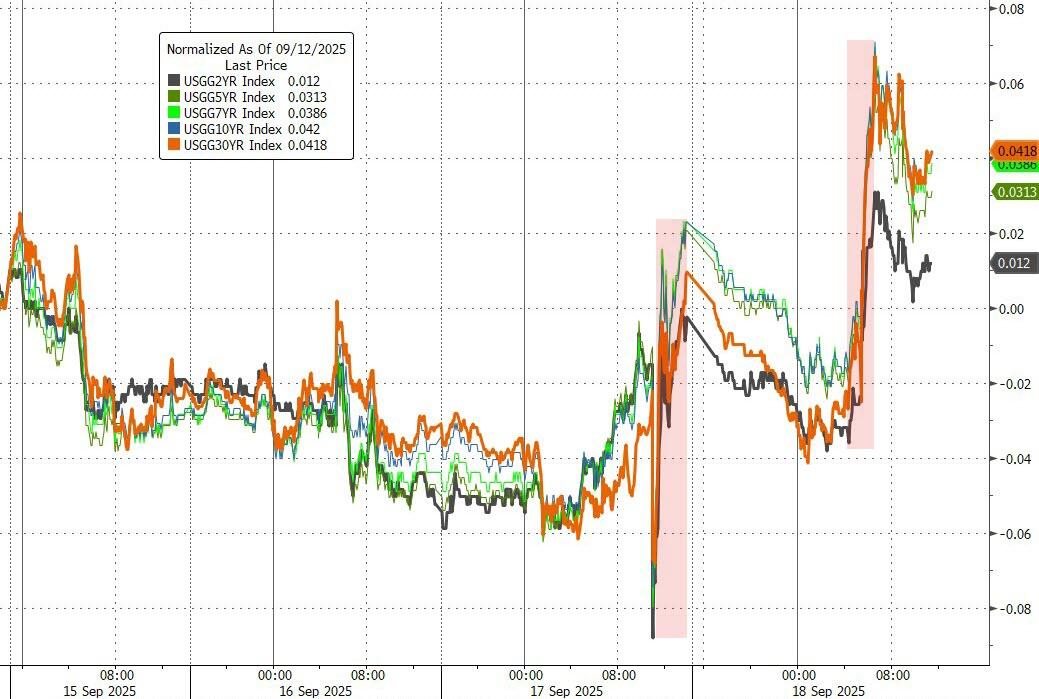
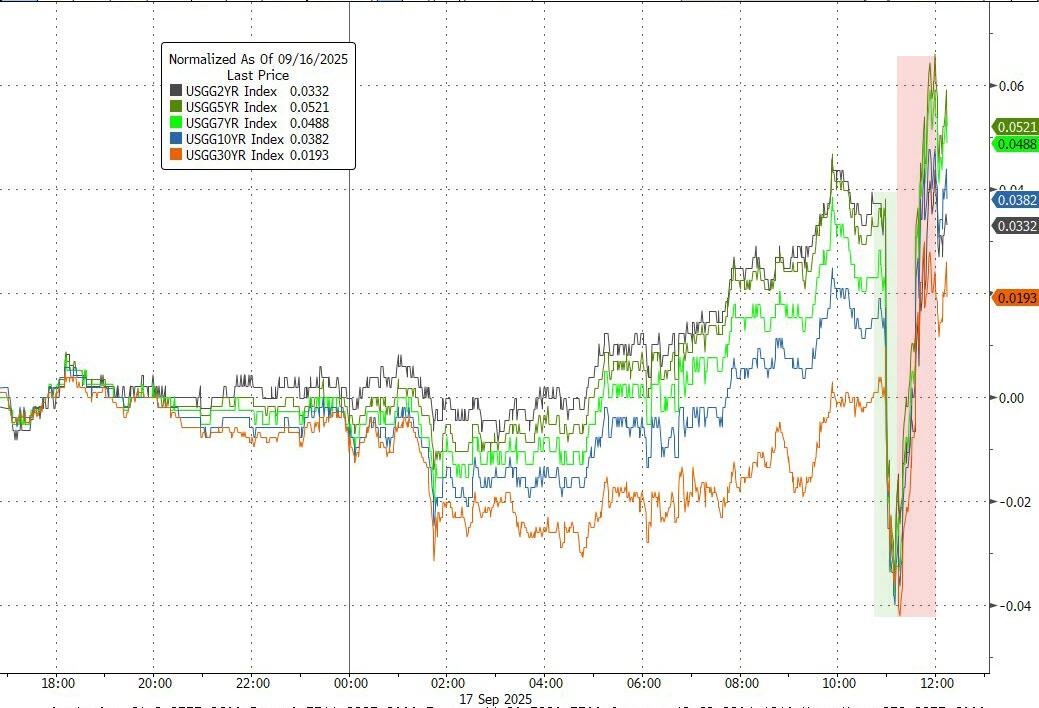
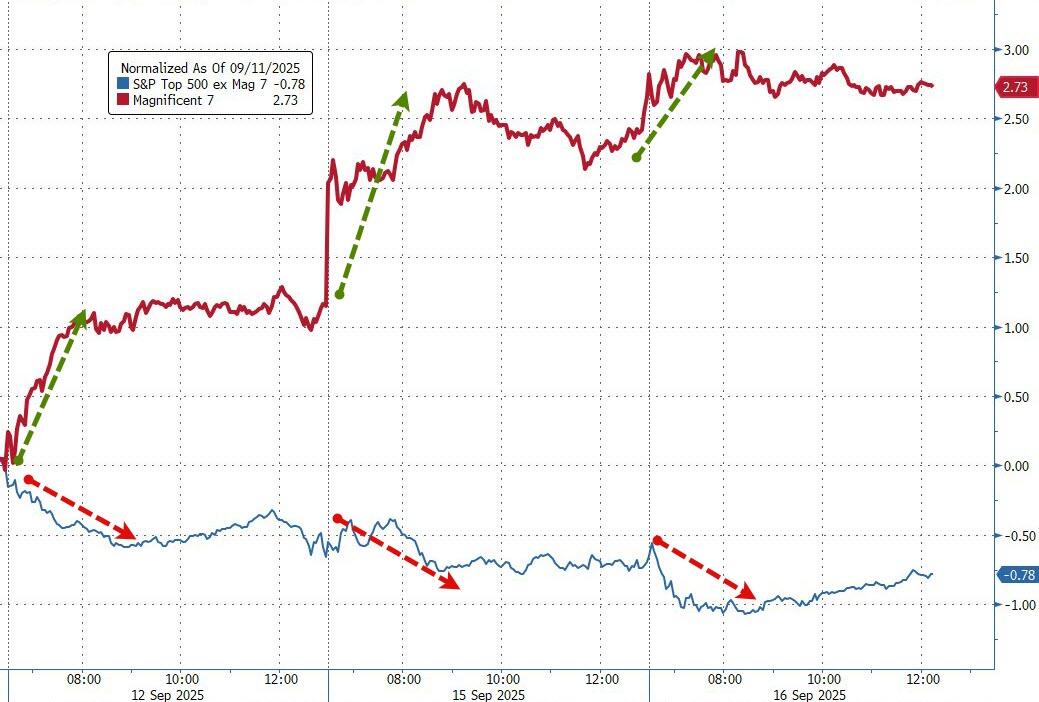
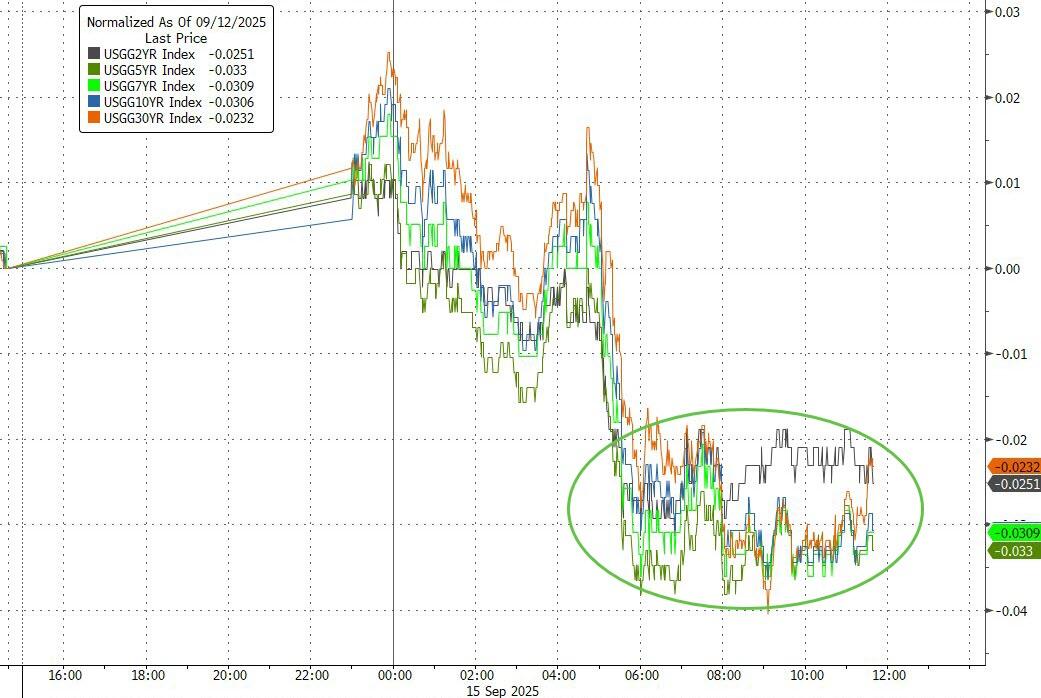
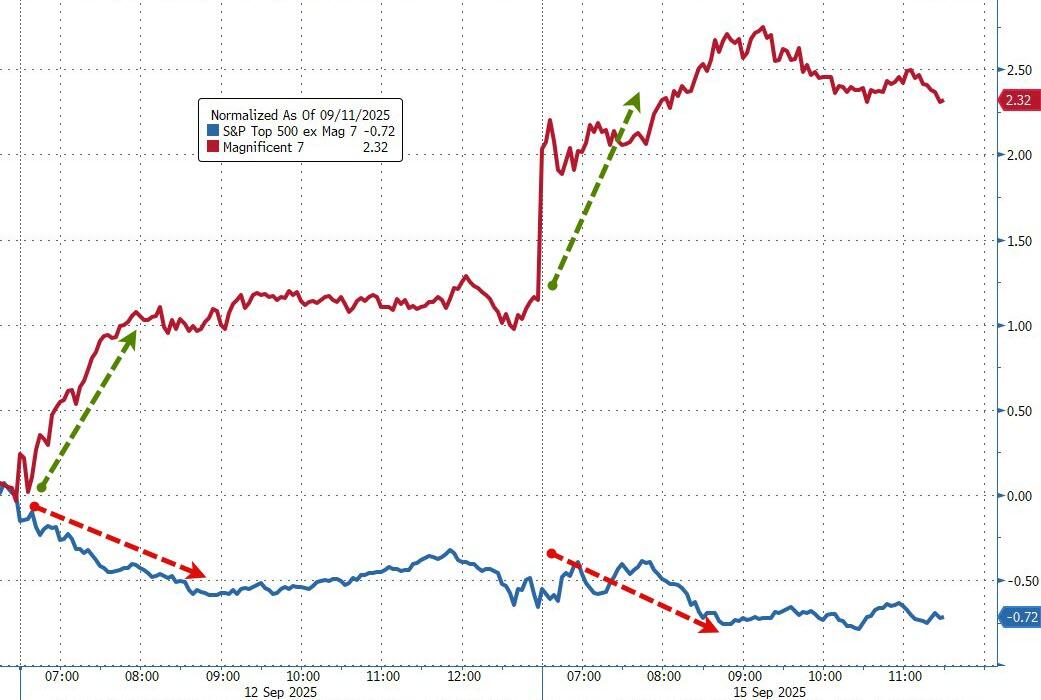
Stubborn inflation and a solid but slightly slowing labor market helped push the Fed to act, but bond yields actually rose for the week—supporting a relentless rally in the most shorted stocks and the Mag 7 basket.
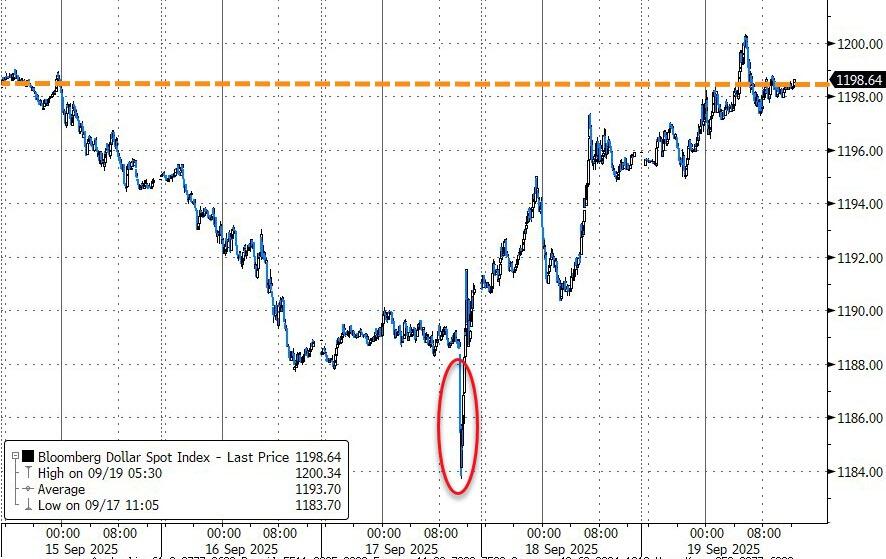
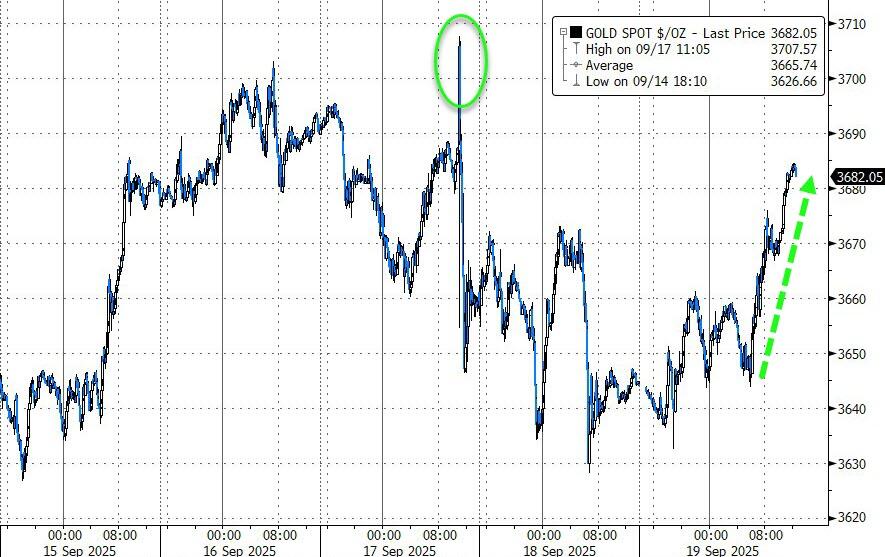
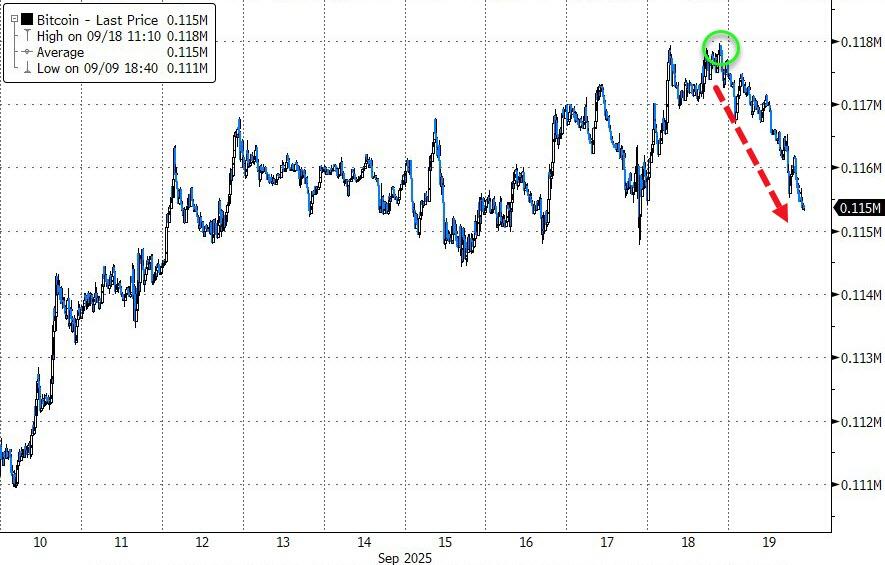
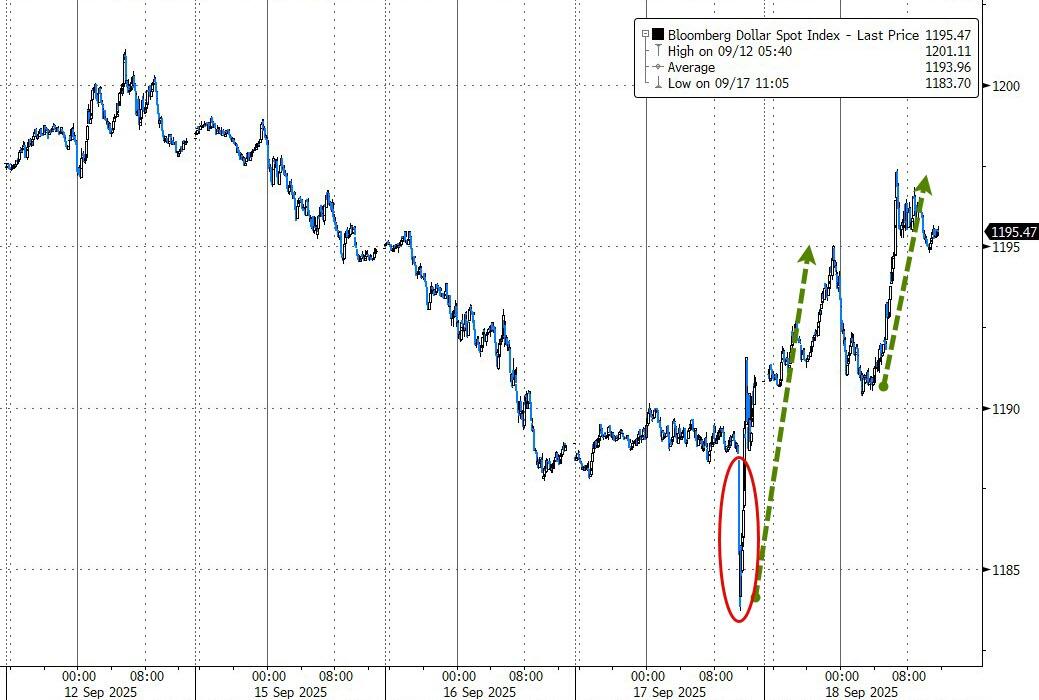
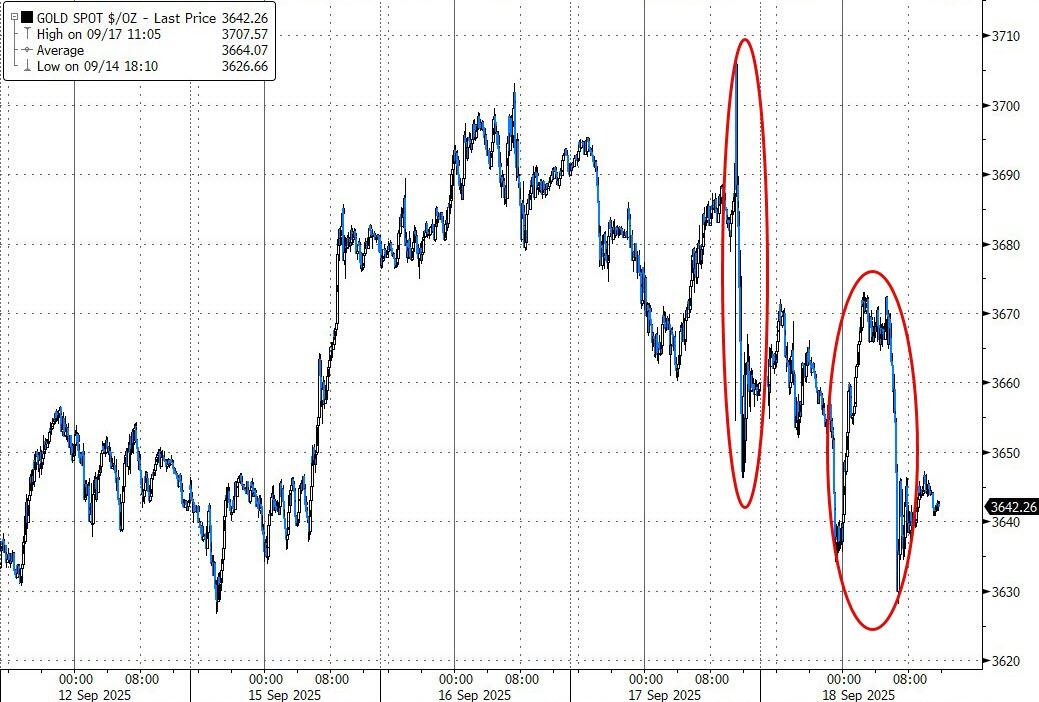
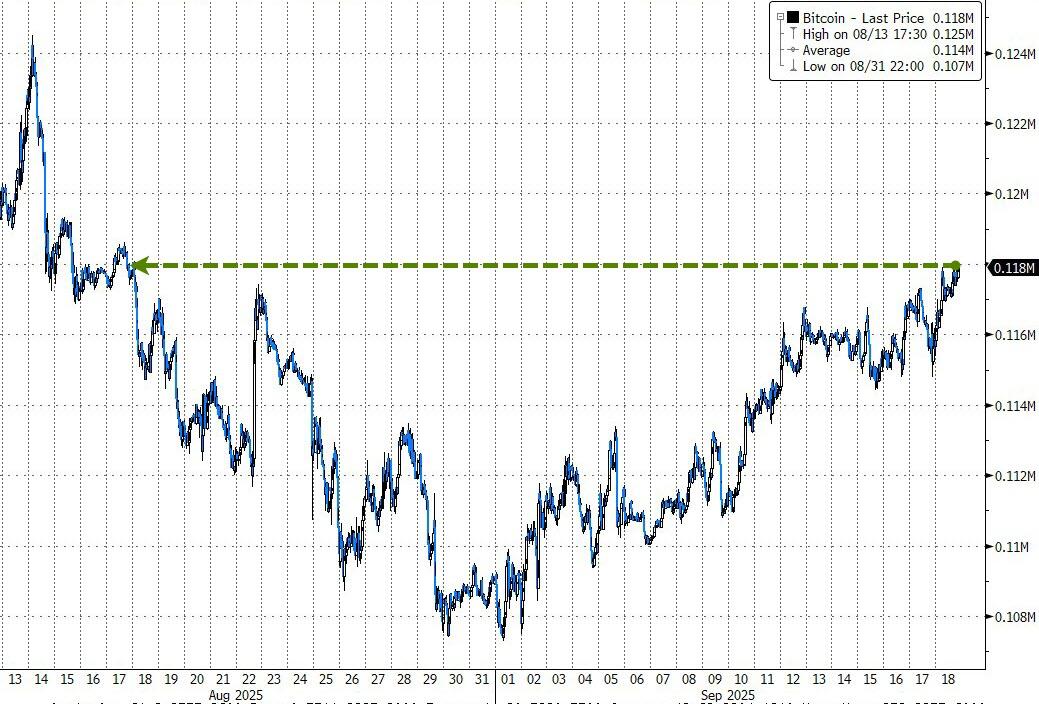
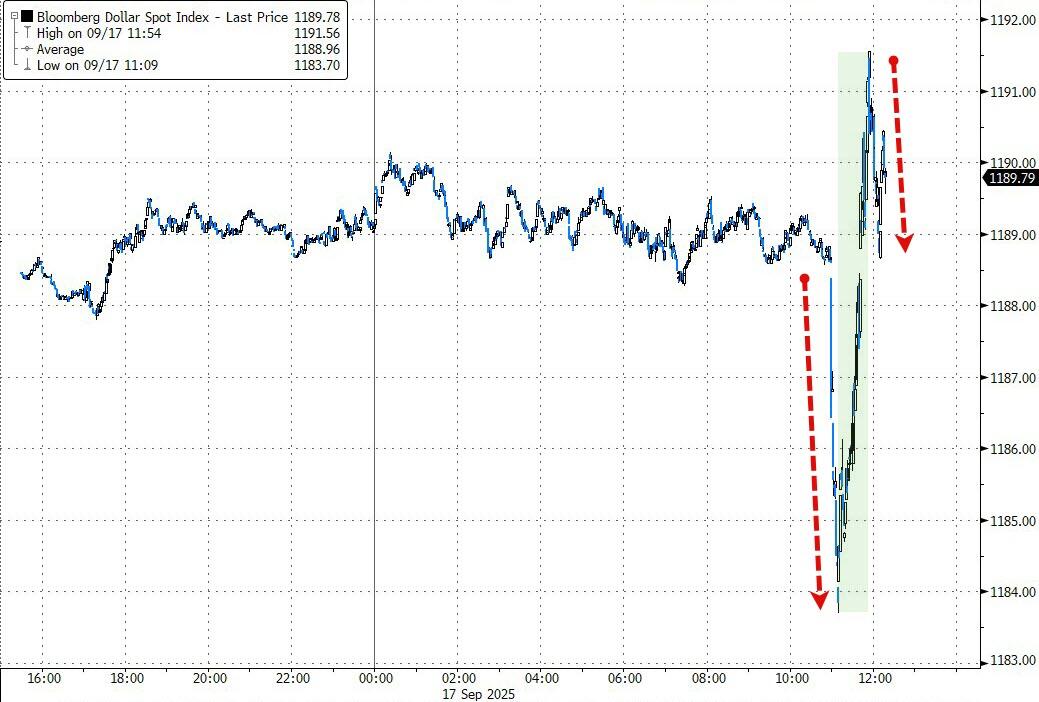
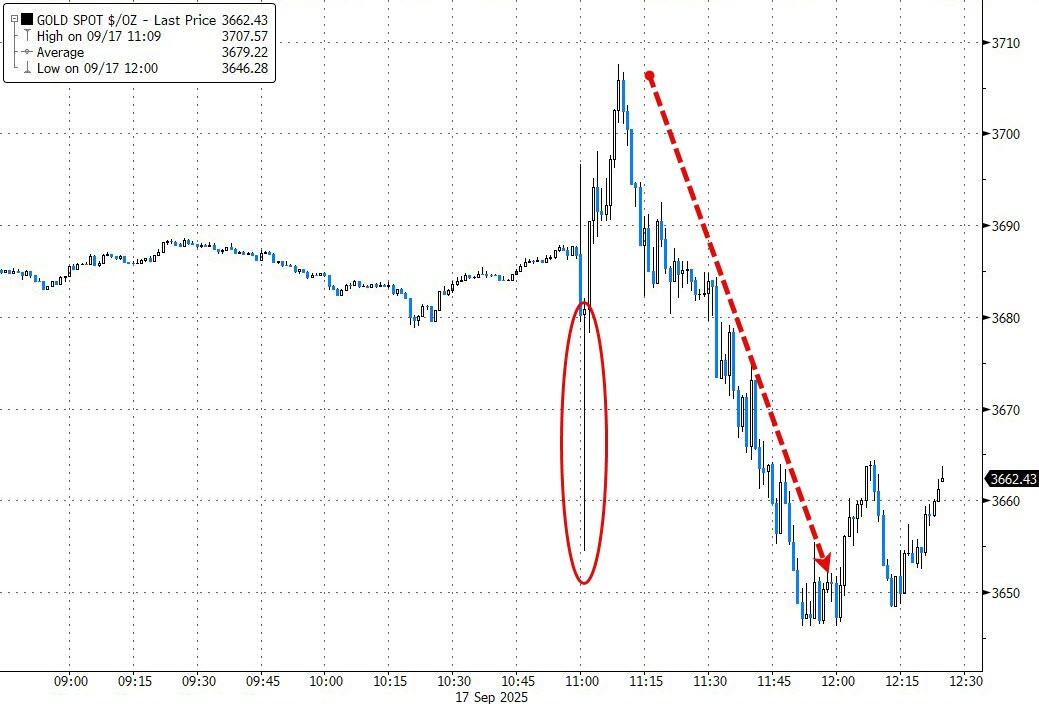
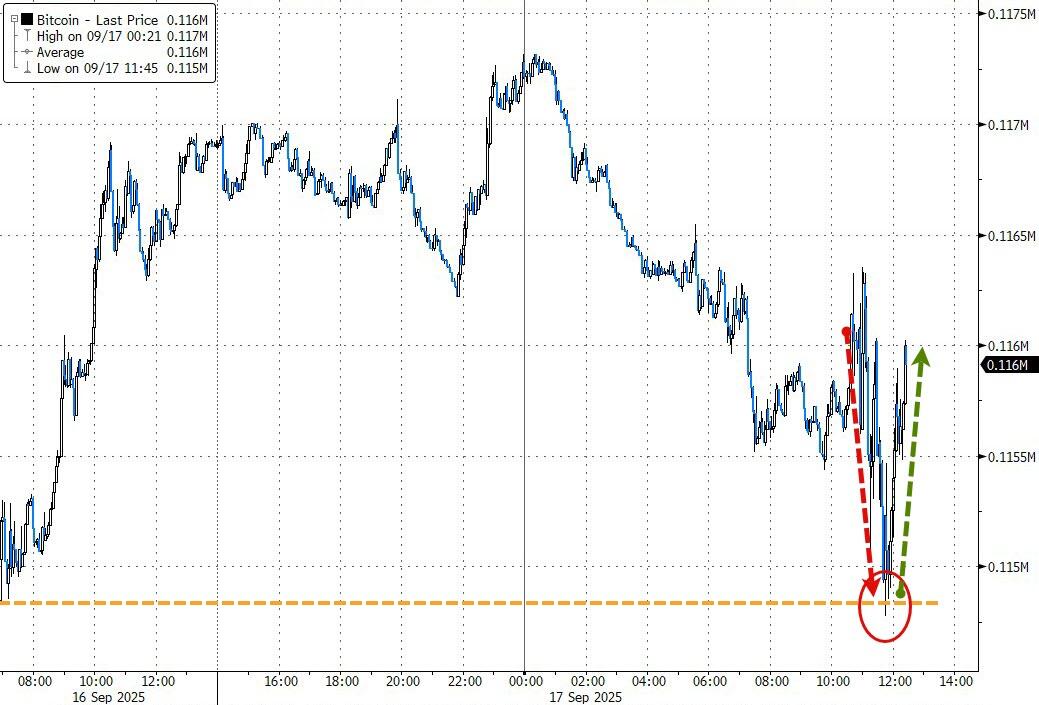
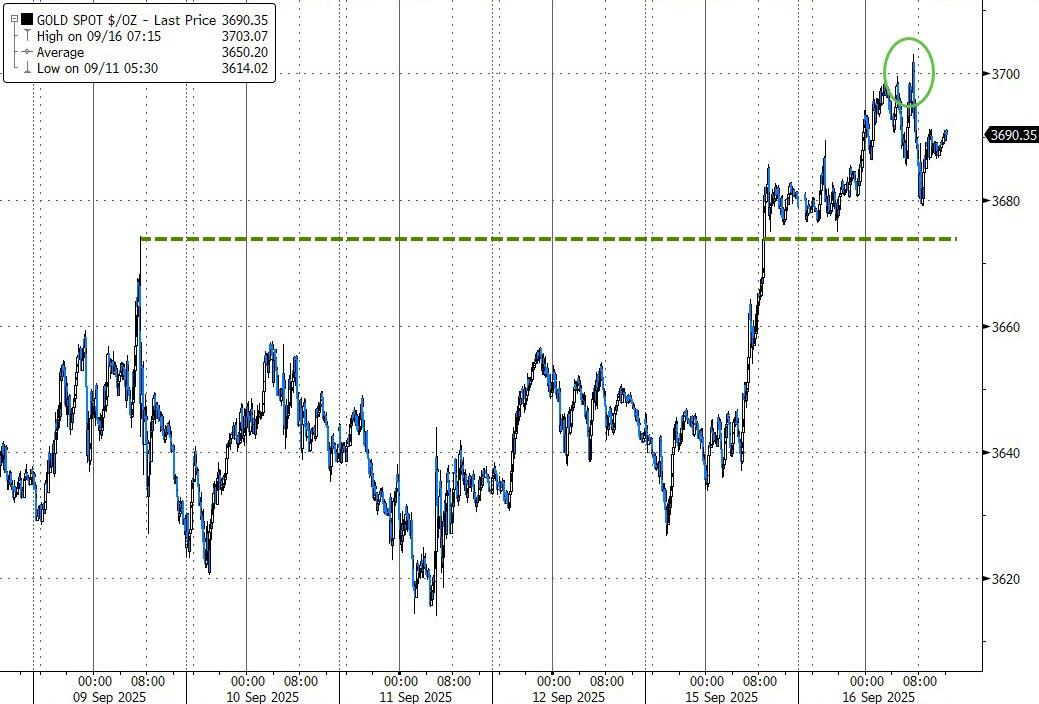
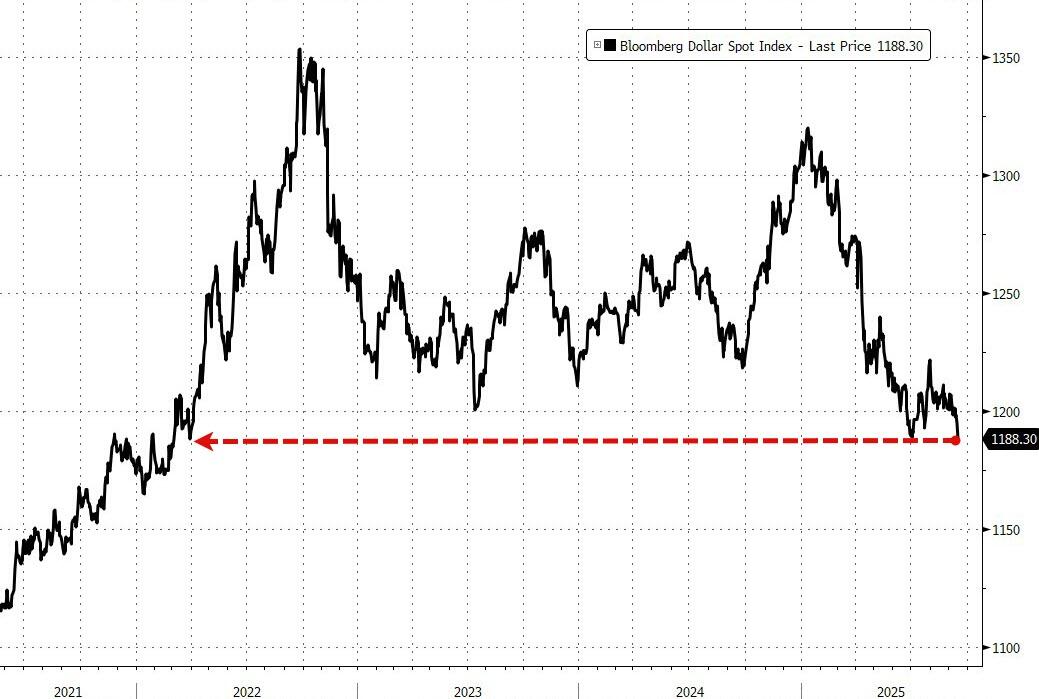
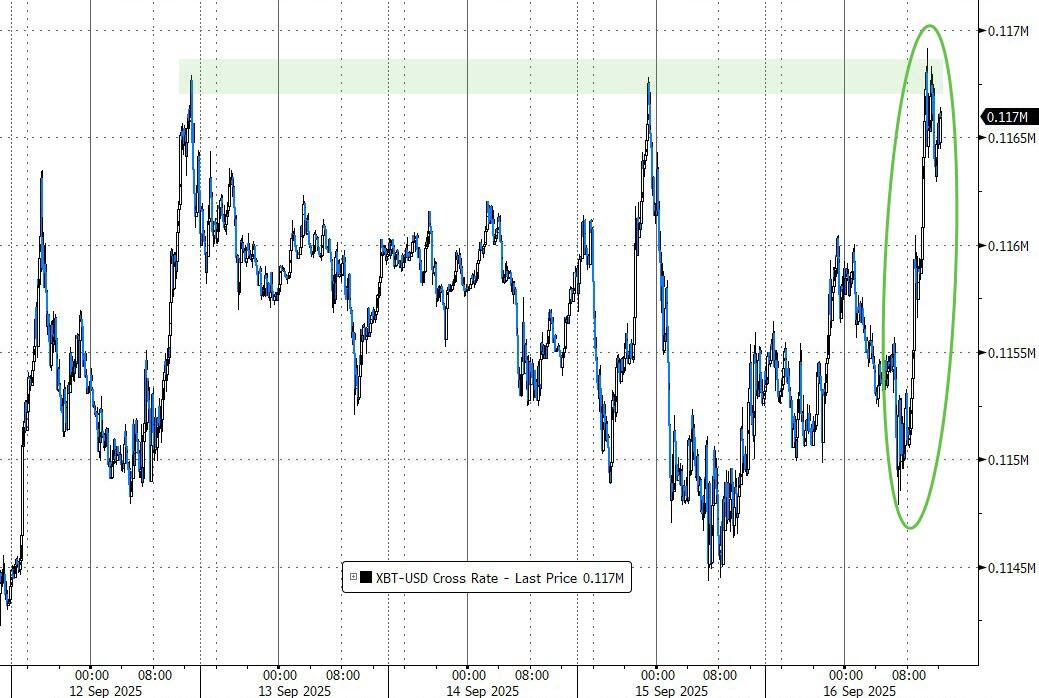
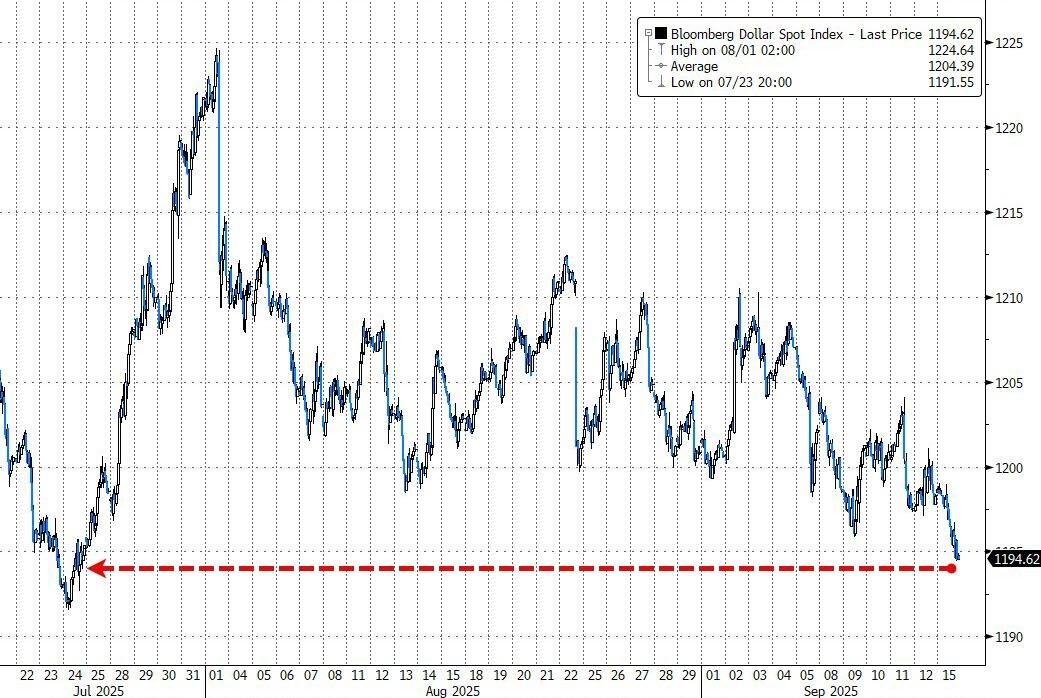
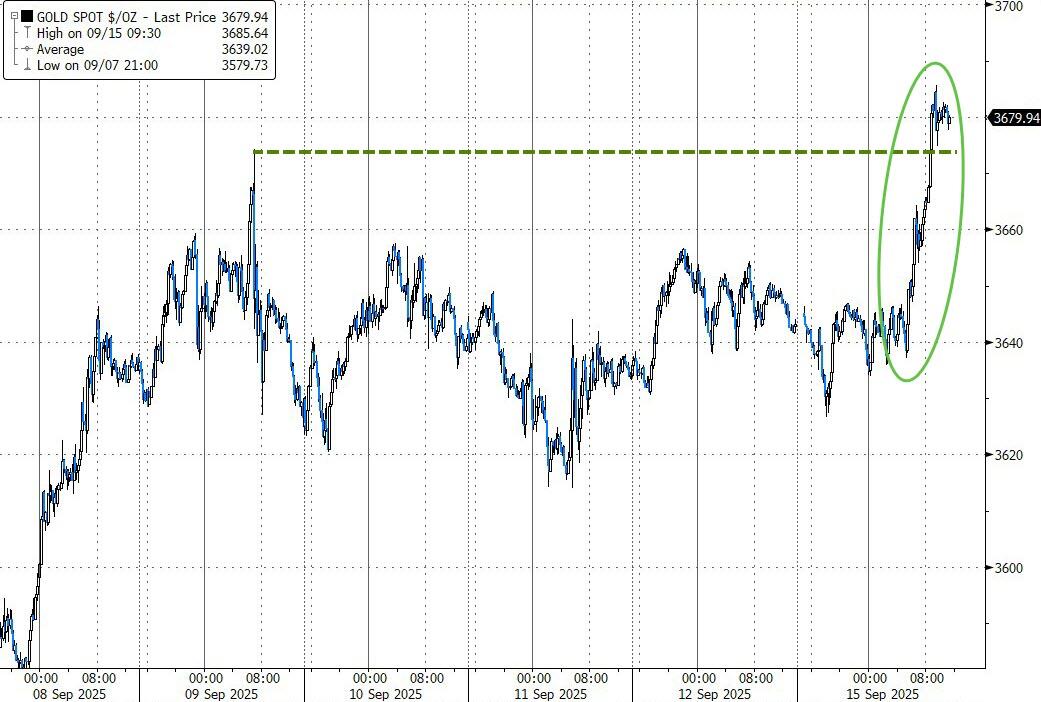
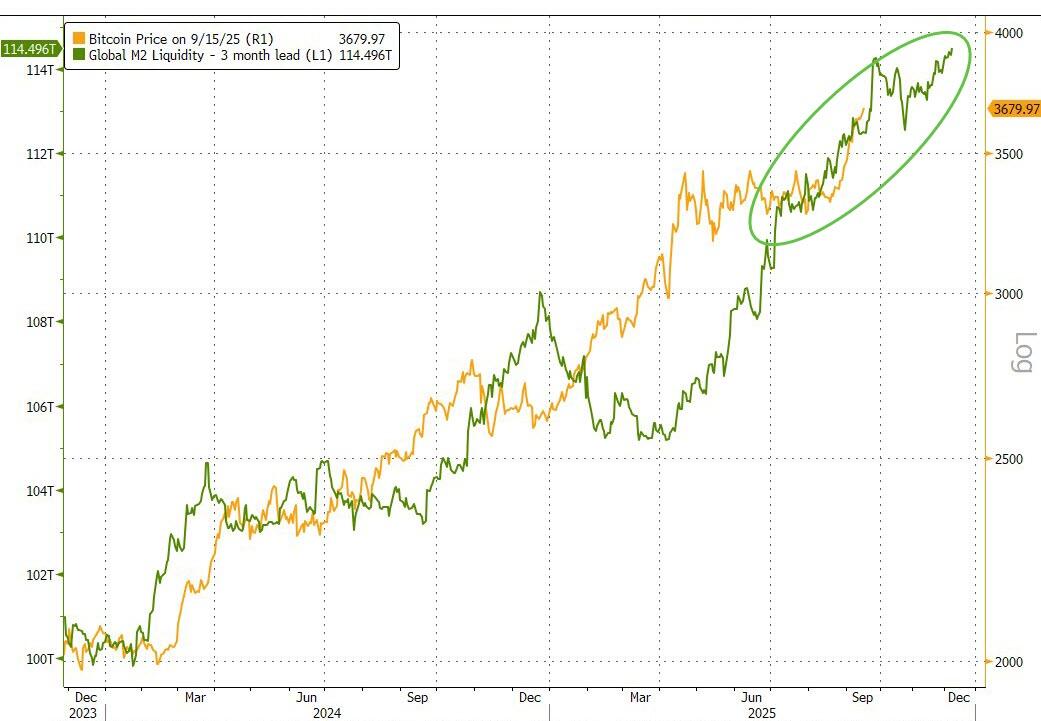
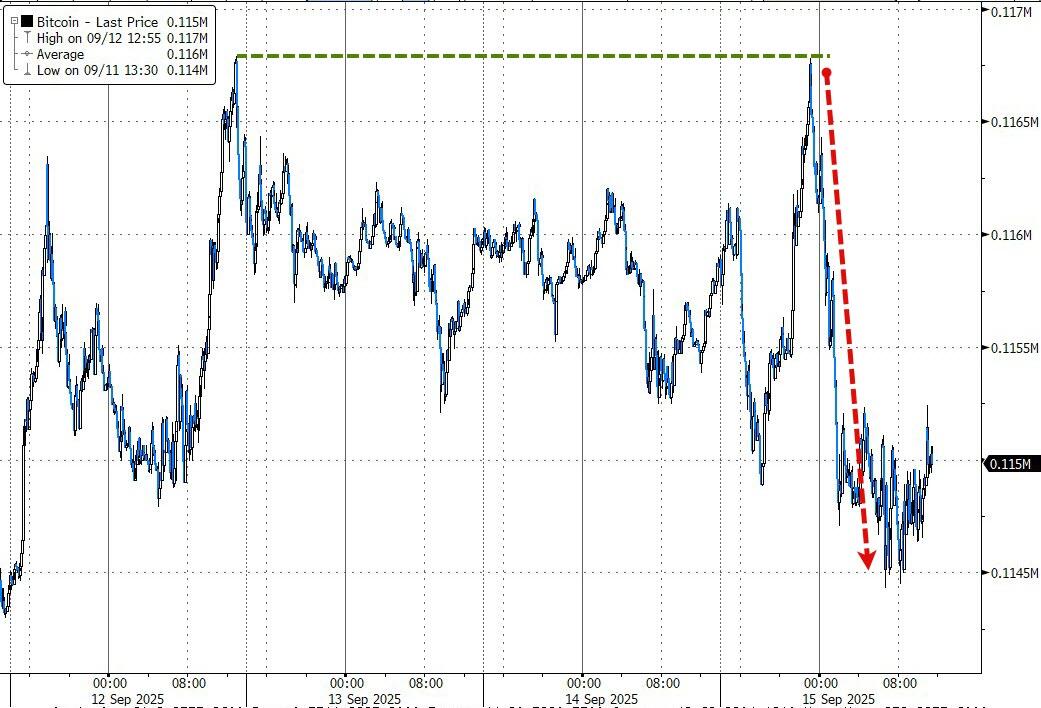
The dollar advanced for a third day, gold capped a fifth straight weekly gain at a new high, and even silver broke out with a 2.7% jump. Bitcoin, meanwhile, cooled off and drifted down to $115k after hitting $118k Thursday.
So far, September has defied its reputation for market whiplash, but with another week and a half to go, will this steady run hold up—or is another bout of volatility right around the corner?
Read More